Stocks vs Bonds — Investing Basics Explained
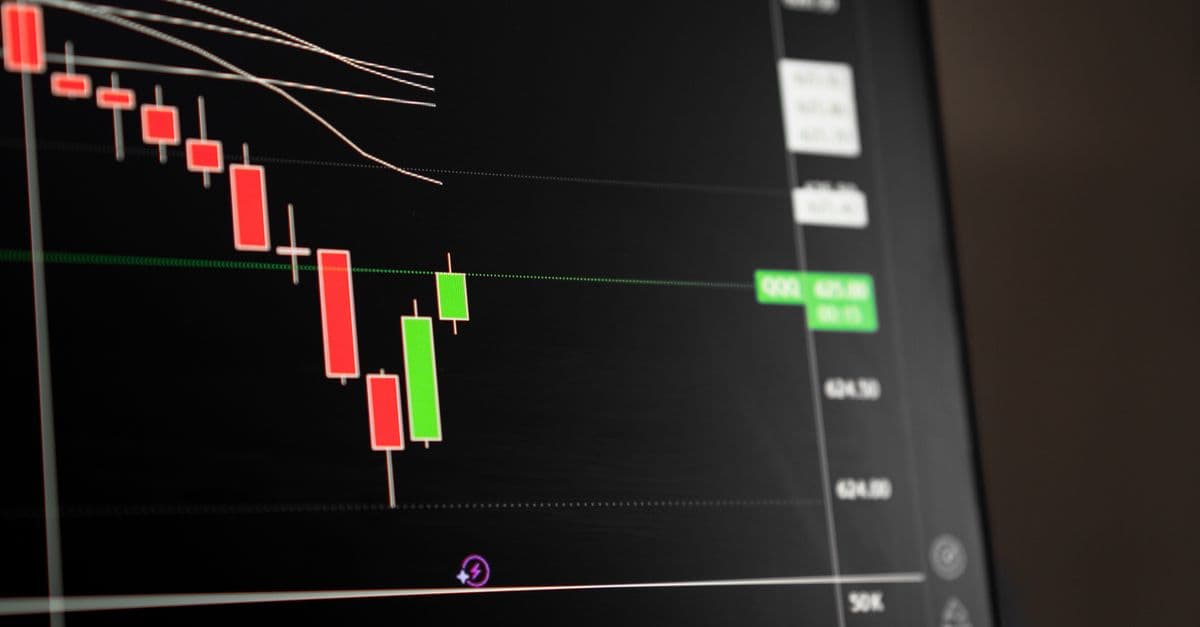
Photo: Alex Luna / Pexels
Nearly every retirement account, pension fund, and college savings plan on Earth is built from two basic ingredients: stocks and bonds. One is a slice of ownership in a company; the other is a loan you make to a government or a corporation. The difference between them explains why some portfolios grow steadily for decades and others swing wildly — and why financial economists have spent a century arguing about the right mix of each.
Educational only — not financial advice. Investing involves risk of loss, including loss of principal. Past performance does not guarantee future results. This article explains mechanisms and historical data; it does not recommend any specific security, allocation, or course of action. Consult a licensed financial advisor before making investment decisions.
What a stock actually is
A stock (also called a share or equity) is a legal claim on a fraction of a company's assets and future profits. Buy one share of a company with a billion shares outstanding, and you own a one-billionth stake in every factory, patent, and dollar of earnings the company generates going forward.
That ownership is why stocks are called "risk capital." Shareholders sit at the bottom of the payment hierarchy. If a company goes bankrupt, bondholders and other creditors get paid first from whatever assets remain; shareholders get whatever is left over, which is often nothing. In exchange for taking on that residual risk, shareholders get the residual reward too — if the company's profits triple, the stock price can triple or more, with no cap.
Stock returns come from two channels. Capital gains are the difference between what you paid and what you sell for. Dividends are cash payments a company distributes directly to shareholders out of its profits, typically on a quarterly basis. Not every company pays them — many fast-growing technology firms retain all their earnings to reinvest in the business rather than distribute cash, on the theory that reinvested capital compounds faster than a dividend check would.
Stocks are the more volatile of the two major asset classes by a wide margin. The S&P 500, the benchmark index of roughly 500 of the largest publicly traded US companies, has had calendar years with total returns above 30% and years with losses beyond 35%. Over long stretches, though, that volatility has historically been compensated. Since 1926, the S&P 500 has delivered an average annual nominal return of roughly 10% including reinvested dividends, which works out to a real (inflation-adjusted) return in the neighborhood of 7% once the long-run average inflation rate of roughly 3% is subtracted out (Official Data Foundation, S&P 500 historical returns; Kapio Analytics, S&P 500 Historical Returns). Historian and finance professor Jeremy Siegel reaches a similar range in his long-running dataset published in Stocks for the Long Run.
What a bond actually is
A bond is a loan with a paper trail. When you buy a bond, you are lending money to whoever issued it — a national government, a city, or a corporation — for a fixed period of time. In exchange, the issuer promises to pay you periodic interest payments, called coupons, and to return the full amount you lent, called the principal or face value, when the bond reaches its maturity date.
There are three broad categories worth knowing:
| Bond type | Issuer | Typical risk level | Example |
|---|---|---|---|
| Treasury / sovereign bonds | National governments | Lowest default risk in their own currency | US Treasury bonds, UK Gilts, German Bunds |
| Investment-grade corporate bonds | Financially strong companies | Low to moderate | Bonds from large, stable, cash-generating firms |
| High-yield ("junk") corporate bonds | Financially weaker or highly leveraged companies | Higher, compensated by higher coupons | Bonds from smaller or debt-heavy firms |
Table: The three main bond categories, ranked roughly by ascending default risk.
Municipal bonds, issued by US states and cities to fund public projects, form a fourth category and often carry a tax advantage: the interest is frequently exempt from federal income tax and sometimes state tax as well, which is why they tend to offer lower stated yields than comparable corporate bonds.
Bonds are the ballast of a portfolio, not the engine. Because the interest payments are fixed and known in advance (assuming the issuer doesn't default), bond prices move in a far narrower band than stock prices. Historically, high-quality bonds have delivered real returns of roughly 1% to 3% annually, well below stocks, but with dramatically less year-to-year swing.
The core tradeoff: why higher returns demand higher risk
Modern finance rests on one non-negotiable rule: an investor who wants a higher expected return has to accept a higher chance of losing money along the way. There is no reliable way to get one without the other. Anyone who tells you they can deliver 15% annual returns with no risk of loss is not describing an investment; they are describing a fraud, and history is full of examples — from Charles Ponzi's 1920s postal-coupon scheme to Bernie Madoff's decades-long fund — where "guaranteed high returns" turned out to be exactly that.
Think of risk and return like the throttle on a car. Pushing the throttle down (taking on more stock exposure, or riskier bonds) gets you to your destination faster on average, but it also means a pothole hits you harder. Easing off the throttle (holding more cash and high-quality bonds) means a smoother ride, but you arrive later, and over a long enough road, "later" can mean falling behind inflation entirely.
A rough hierarchy of asset classes by historical long-run real (inflation-adjusted) return and typical volatility looks like this:
| Asset class | Typical long-run real return | Relative volatility |
|---|---|---|
| Cash / Treasury bills | 0.3% – 1% | Very low |
| Government bonds | 1.5% – 2.5% | Low |
| Investment-grade corporate bonds | 2.5% – 4% | Low to medium |
| Large-cap stocks | 6% – 7% | High |
| Small-cap value stocks | 7% – 8% | Higher |
| Venture capital / private equity | Highly variable, often cited near 8–12% average but with enormous dispersion between funds | Extreme |
Table: Historical real return and volatility by broad asset class. Figures are long-run historical averages, not forecasts, and individual years deviate sharply from these averages.
Nothing in this hierarchy is a promise about the future. It describes what happened, on average, across specific historical periods in specific markets, mostly the United States. Markets in other countries have had very different, sometimes far worse, outcomes over multi-decade stretches, a point worth returning to below.
What actually determines a stock's price?
A stock's price is, in theory, the market's collective estimate of the present value of all the cash the company will ever pay out to shareholders, discounted back to today. In practice, that estimate moves constantly as investors revise their guesses about future profits, interest rates, and risk. Short-term price swings are driven far more by shifting sentiment and macroeconomic news than by any single quarter's earnings report.
What actually determines a bond's price?
A bond's price is the present value of its remaining coupon payments plus its face value at maturity, discounted at the market's current required interest rate for a bond of that risk and maturity. When market interest rates change, the price of already-issued bonds moves in the opposite direction to keep the effective yield competitive with new bonds.
How interest rates move bond prices
This is the single most counterintuitive mechanic in fixed income, and it trips up more new investors than any other concept in this article: when interest rates rise, the price of existing bonds falls.
Here is why. Imagine you own a bond that pays a 3% coupon. If the central bank raises rates and brand-new bonds of similar risk now pay 5%, nobody will pay you full face value for your 3% bond anymore — why would they, when they could buy a new bond paying more? To find a buyer, you have to sell your bond at a discount steep enough that its effective yield, given the lower price you're accepting, comes out roughly in line with the new 5% bonds on the market. That discount is exactly how much your bond's price falls.
The size of that price move is measured by a concept called duration, which estimates how sensitive a bond's price is to a one-percentage-point change in interest rates. As a rough rule of thumb, a bond with 10 years left until maturity will lose approximately 10% of its price for every 1-percentage-point rate hike, and gain roughly the same for every 1-point cut. Longer-maturity bonds have higher duration and are more rate-sensitive; shorter-maturity bonds have lower duration and are more stable.
This is precisely what happened in 2022. As the Federal Reserve raised its benchmark rate aggressively to fight inflation, the broad US bond market posted its worst calendar year in the history of the index, falling roughly 13% (the US Core Bond Index), while long-duration Treasury funds fell considerably further, in some cases losing close to 30% of their value in a single year (CNBC, October 2022). Investors who assumed bonds were "safe" in the sense of never losing money learned the difference between low volatility and no volatility the hard way.
Do bonds ever lose money if you hold them to maturity?
If you buy an individual bond and hold it until maturity, and the issuer does not default, you receive every promised coupon payment plus your full principal back, regardless of what happened to its market price in between. The "loss" from rising rates is only realized if you sell before maturity. Bond funds are different: because they continuously buy and roll over bonds, they never technically "mature," so a bond fund's value can stay depressed for years after a sustained rate increase.
Diversification and the "free lunch" of modern portfolio theory
Economist Harry Markowitz won the 1990 Nobel Memorial Prize in Economic Sciences largely for work he published back in 1952 called Modern Portfolio Theory (MPT). His central insight, formalized with mathematics that was novel at the time, was that combining assets whose prices don't move in lockstep can reduce a portfolio's overall volatility without giving up a proportional amount of expected return. Economists nicknamed this "the only free lunch in finance," because it is one of the rare cases where you can reduce risk without necessarily reducing expected reward.
Think of it like a boat with two sails positioned at different angles. If one sail catches a gust that pushes the boat sideways, the other, angled differently, can partially counteract that push, keeping the overall course steadier than either sail could manage alone. Stocks and bonds have historically played that role for each other: when a recession or financial panic sends stock prices tumbling, investors often flee into the relative safety of government bonds, pushing bond prices up at the same moment stocks are falling. That was visible clearly in 2008, when US stocks fell roughly 37% but high-quality Treasury bonds gained value, cushioning a blended portfolio's overall loss.
The classic implementation of this idea is the 60/40 portfolio: 60% stocks, 40% bonds. It isn't a magic ratio pulled from a formula; it's a widely used rule-of-thumb compromise between growth and stability that has, on average, delivered a smoother ride than an all-stock portfolio while still capturing most of the long-run growth. As the 2022 example above shows, the relationship between stocks and bonds is a historical tendency, not a law of physics, and it can break down, particularly when inflation and interest-rate shocks hit both asset classes through the same channel at once. Over the full 150-year historical record examined in Morningstar's long-run study of the strategy, 2022 stands out as an outlier rather than the norm (Morningstar, "The 60/40 Portfolio: A 150-Year Markets Stress Test").
Comparative snapshot — how these asset classes have behaved
| Asset class | Typical long-run real return | Liquidity | Behavior as an inflation hedge |
|---|---|---|---|
| Cash / T-bills | 0.3% – 1% | Instant | Poor — loses purchasing power in high inflation |
| Government bonds | 1.5% – 2.5% | High | Poor, unless inflation-linked (e.g., TIPS) |
| Corporate bonds | 2.5% – 4% | Medium | Poor |
| Large-cap stocks | 6% – 7% | High | Reasonably good over long horizons |
| Real estate (REITs) | 4% – 6% | Medium | Reasonably good |
| Gold / commodities | 0% – 2.5% | High | Considered a traditional hedge, though its real long-run return has been modest |
| Cryptocurrency | No comparable long-run track record | Variable | Actively debated among economists |
Table: Broad asset class comparison by historical real return, liquidity, and inflation-hedging characteristics. Historical figures; not a forecast of future performance.
For a deeper look at how inflation specifically erodes cash and fixed-income returns, and which assets have historically held up best against it, see our full inflation explainer.
The efficient market hypothesis and why picking winners is hard
In 1970, economist Eugene Fama, who later won the 2013 Nobel Memorial Prize in Economic Sciences, formalized an idea now called the Efficient Market Hypothesis (EMH): in markets that are liquid and flooded with information — like major stock exchanges, where millions of participants are constantly buying, selling, and analyzing — prices tend to reflect essentially everything that is publicly known about a company at any given moment. The implication is unsettling for anyone hoping to get rich by outsmarting the market: if a piece of good news about a company is public, the price has probably already moved to reflect it before most individual investors can act on it.
This doesn't mean markets are perfectly efficient or that prices are always "correct" in some cosmic sense; bubbles, crashes, and periods of clear mispricing do happen. It means that consistently identifying mispriced stocks before everyone else does, quarter after quarter, decade after decade, is extraordinarily difficult, because you are competing against professional analysts, algorithms, and institutional traders who see the same public information roughly as fast as you do.
The data on professional fund managers backs this up directly. According to S&P Dow Jones Indices' SPIVA (S&P Indices Versus Active) scorecard for year-end 2024, over the trailing 15-year period, there was not a single US equity fund category, out of 22 tracked, in which a majority of active managers beat their benchmark index (S&P Global, SPIVA U.S. Scorecard Year-End 2024). Zooming into a single, more recent year, 65% of actively managed large-cap US equity funds underperformed the S&P 500 in 2024 alone (S&P Global, SPIVA U.S. Scorecard Year-End 2024). Underperformance rates tend to climb, not fall, the longer the time horizon measured, which is the opposite of what you'd expect if skilled managers were simply taking longer to "prove" their edge.
If markets are efficient, why does anyone trade actively at all?
Some investors trade for reasons other than beating a benchmark, including managing tax timing, matching specific liabilities like a pension payout schedule, or pursuing niche strategies in less-liquid corners of the market where information genuinely is harder to access. Others simply overestimate their own skill relative to the competition, a well-documented behavioral bias.
Why index funds became the default recommendation
John C. Bogle founded the Vanguard Group in 1975 and, shortly after, launched what became the first retail index mutual fund available to everyday investors. His argument was built on arithmetic rather than any special forecasting ability. Before costs, active management is roughly a zero-sum game: for every investor who beats the market average in a given period, another investor must underperform it by the same amount, because collectively, all investors are the market. Once you subtract the higher fees that actively managed funds typically charge, usually somewhere between 0.5% and 2% annually versus roughly 0.03% to 0.20% for many broad index funds, the average actively managed dollar is mathematically destined to lag the index by close to that fee gap over time.
An index fund, instead of trying to guess which handful of stocks will outperform, simply buys a small slice of every company in a target index — the S&P 500, the total US stock market, a total bond market — in proportion to each company's size. It doesn't try to win; it tries to be the market, at the lowest possible cost. Think of it like refusing to bet on which horse will win a race and instead buying a tiny stake in every horse entered; you'll never have the thrill of picking the winner, but you also can't lose everything on a single bad bet, and on average you'll do better than most people who did try to pick just one horse.
A useful complement to a lump-sum index strategy is dollar-cost averaging, investing a fixed amount at regular intervals regardless of price, which smooths out the emotional and timing risk of trying to guess the "right" moment to buy. Our companion piece on dollar-cost averaging covers the mechanics and the research on when it does, and doesn't, beat investing a lump sum all at once.
A widely-referenced starter allocation
One structure frequently discussed in personal-finance communities, often called the "three-fund portfolio," pairs a total domestic stock market index fund with a total international stock index fund and a total bond market index fund, in proportions the investor adjusts based on age, time horizon, and personal risk tolerance. A commonly cited rule of thumb suggests that the percentage allocated to bonds should roughly track an investor's age, on the logic that an investor with decades left to invest can absorb more stock-market volatility than someone approaching retirement who may need to withdraw funds soon. This is a general heuristic discussed in the personal-finance literature, not a formula that fits every individual's circumstances, and it should not be read as a specific recommendation for any particular reader's account.
What compounding does to both asset classes over time
Whether you hold stocks, bonds, or a mix of both, the multi-decade outcome is shaped enormously by compounding — the process by which returns earned in one period themselves start earning returns in the next. A dollar earning 7% annually doesn't just gain seven cents a year forever; by year 20, the base it's growing from has already roughly quadrupled, so the same 7% is generating far more dollars in absolute terms than it did at the start. This is why financial writers have long called compounding one of the most powerful forces in personal finance, and why starting to invest even a modest amount early tends to outperform investing much larger amounts later. Our detailed breakdown of the mechanics, including the quick mental-math shortcut known as the Rule of 72, lives in our compound interest explainer.
The flip side is that compounding works against you too. A bond fund that loses 13% in a bad year, as the broad US bond index did in 2022, needs a gain of roughly 15% just to get back to even, because the recovery percentage is calculated off a smaller starting base. This asymmetry is one of the underappreciated reasons risk management matters as much as return-seeking.
What people get wrong about stocks and bonds
"Bonds are risk-free." They are lower-volatility than stocks, not risk-free. Government bonds carry interest-rate risk, as 2022 demonstrated dramatically, and corporate bonds carry default risk on top of that. Even the safest sovereign bonds are exposed to inflation risk: a bond paying a fixed 3% coupon is a real loss if inflation runs at 6%.
"A diversified stock portfolio means owning many stocks in different industries." True diversification, in the modern portfolio theory sense, is about combining assets whose prices don't move together, not simply owning a large number of different names. Owning fifty tech stocks is not meaningfully diversified if they all fall together during a tech-sector downturn.
"If a fund beat the market last year, it will probably beat it again." The SPIVA data and decades of academic research on mutual fund persistence consistently show that past outperformance is a weak predictor of future outperformance; a fund's ranking one year has limited correlation with its ranking the next.
"Picking individual stocks is how you get rich." It's possible, but the base rates are unforgiving. A widely cited study by finance professor Hendrik Bessembinder found that a small fraction of publicly traded US stocks, on the order of a few percent, accounted for the entire net wealth creation of the US stock market above what one-month Treasury bills would have earned since 1926; the majority of individual stocks, held in isolation, either matched Treasury bills or lost money outright over their lifetimes (Bessembinder, Do Stocks Outperform Treasury Bills?, Journal of Financial Economics, 2018). Pick the wrong company and you can underperform cash for years; pick the index and you automatically own the handful of big winners along with everything else.
"The stock market always recovers eventually." In the United States specifically, there has never been a rolling 20-year period since 1871 with a negative real return, a data point often cited to reassure long-term US investors. But that record is specific to the United States. Japan's Nikkei 225 index has still not sustainably reclaimed, in real terms, the peak it hit at the end of 1989, more than three decades ago, a sobering reminder that a single country's historical resilience is not a universal guarantee.
FAQs
Q: Are stocks safe in the long run? A: "Safer than they feel day-to-day" is closer to the honest answer than "safe." The US market has never had a 20-year rolling period with negative real returns since 1871, but that is a US-specific pattern, not a law of markets. Other countries, most notably Japan since its 1989 peak, have gone decades without recovering in real terms.
Q: Why hold bonds at all if stocks return more on average? A: Volatility has real consequences beyond a number on a screen. An investor withdrawing income in retirement can be forced to sell stocks at a steep loss during a crash, permanently damaging the portfolio; bonds provide a lower-volatility cushion that can be drawn down instead. Bonds have also historically tended to hold or gain value during the deflationary recessions when stocks fall hardest, though 2022 showed that pattern is not guaranteed.
Q: Are individual stocks bad investments? A: Not inherently "bad," but statistically risky compared to a diversified fund. Bessembinder's 2018 research found that a small percentage of stocks generated essentially all of the market's excess wealth creation over Treasury bills since 1926; the majority of individual companies did not outperform cash equivalents across their lifetimes (Bessembinder, Journal of Financial Economics, 2018).
Q: How does inflation affect stocks versus bonds differently? A: Stocks have historically tended to outpace inflation over long horizons because companies can often raise the prices they charge as costs rise. Fixed-rate bonds do not have that flexibility; their coupon is locked in, so unexpected inflation directly erodes their real value, which is exactly what happened to bond investors in 2022. Treasury Inflation-Protected Securities (TIPS) are a government bond variant specifically designed to adjust principal with inflation.
Q: Is dollar-cost averaging better than investing a lump sum at once? A: Research on this question, including studies published by Vanguard, has generally found that investing a lump sum immediately outperforms spreading it out over time in most historical market environments, simply because markets rise more often than they fall. Dollar-cost averaging remains popular anyway because it reduces the emotional difficulty and regret risk of investing a large sum right before a downturn. See our dollar-cost averaging guide for the full data breakdown.
Q: What's the difference between a stock's price and a company's actual value? A: A stock's price reflects what buyers and sellers currently agree it is worth, based on their collective expectations about future profits and risk. A company's "intrinsic value," a concept central to value investing, is an estimate of what those future profits are actually worth today, discounted appropriately. The two can diverge, sometimes for years, which is the basis of most active-investing strategies, though the SPIVA data above suggests consistently identifying that divergence is rare even among professionals.
Q: Does a higher bond yield always mean a better bond to buy? A: Not necessarily. A higher yield often signals the market perceives higher risk, whether interest-rate risk from a longer maturity or credit risk from a weaker issuer. A bond yielding far more than comparable government bonds is compensating you for a real chance you won't get all your money back, not offering a free upgrade.
Q: What about cryptocurrency as an alternative to stocks and bonds? A: Cryptocurrency is a distinct and considerably younger asset class without the multi-decade return history available for stocks and bonds. Its price behavior has historically been far more volatile than either, and it does not generate cash flows like dividends or coupons the way stocks and bonds do. It should be evaluated on its own terms rather than treated as a direct substitute for either established asset class.
Q: How much of my portfolio should be in stocks versus bonds? A: This depends on individual factors including time horizon, income stability, and personal tolerance for seeing account values drop, and it is genuinely a personal decision rather than a one-size-fits-all formula. This article describes historical patterns and mechanisms to help you understand the tradeoffs; it is not a substitute for guidance tailored to your specific financial situation from a licensed advisor.
The takeaway
Stocks and bonds aren't rival products competing for your money; they're two different tools that solve two different problems. Stocks exist to grow purchasing power over long horizons by taking on the risk, and reward, of company ownership. Bonds exist to preserve capital and generate predictable income by taking on the more modest risk of lending. The historical data is consistent on one point above almost everything else: costs and time in the market have mattered more to most investors' outcomes than any individual stock pick or attempt to time the next downturn.
Read next:
- Compound Interest Explained — The 8th Wonder
- Inflation Explained — Causes, Measurement, and How to Protect Savings
- Dollar-Cost Averaging Explained — Pros and Cons
Sources
- Siegel, J. (2022). Stocks for the Long Run, 6th ed.
- Markowitz, H. (1952). Portfolio Selection. Journal of Finance.
- Fama, E. (1970). Efficient Capital Markets: A Review of Theory and Empirical Work. Journal of Finance.
- Bogle, J. C. (2017). The Little Book of Common Sense Investing.
- Bessembinder, H. (2018). Do Stocks Outperform Treasury Bills? Journal of Financial Economics.
- S&P Global, SPIVA U.S. Scorecard Year-End 2024
- Official Data Foundation, S&P 500 Returns Since 1926
- Kapio Analytics, S&P 500 Historical Returns Since 1926
- CNBC, "Why 60/40 Portfolio Is On Track For Its 'Worst Year Ever'" (October 2022)
- Morningstar, "The 60/40 Portfolio: A 150-Year Markets Stress Test"
- Nobel Prize official site, biographical notes on Harry Markowitz (1990) and Eugene Fama (2013)
Follow new articles
Add SciHub101 to your feed reader to see new science and technology stories.
About the Author
SciHub101 is an independent science and technology publication founded and edited by Buğra Sözeri, a software engineer and app developer based in Türkiye. AI tools assist with drafting and research. Source documentation in the existing archive is uneven, and articles are being reviewed and corrected. The Editorial Team byline identifies editorial responsibility; it does not certify specialist or independent human review. Where we compare products, anything built by our own team is labelled as such — see the editorial guidelines and About page for how corrections and disclosures work.
Related Articles

Personal Finance Basics — Money Management 101
Build wealth with the fundamentals: emergency fund, budget, debt payoff, retirement accounts, index funds, insurance, and credit. Evidence-based guide.

High-Yield Savings Accounts Explained
How HYSAs work, current 4-5% rates, FDIC insurance, and how they compare to CDs, T-bills, and money market funds for parking cash safely.

Asset Allocation Explained — Portfolio Building
Asset allocation is how you split a portfolio across stocks, bonds, and cash. See what research shows, the main model portfolios, and how to rebalance.

Portfolio Rebalancing — When and How to Rebalance
Rebalancing keeps your portfolio at its target risk. How often to rebalance, threshold vs. calendar methods, tax tricks, and what the research says.
How the Stock Market Works: A Complete Guide
Learn how stocks, exchanges, IPOs, valuation, and market indices work — from bid-ask spreads to the efficient market hypothesis.
Why Stock Prices Move After Earnings
Stocks move after earnings because expectations matter more than headlines. Revenue, margins, guidance, cash flow, and narrative all interact.