What Is a Recession — and How Bad Can They Actually Get?
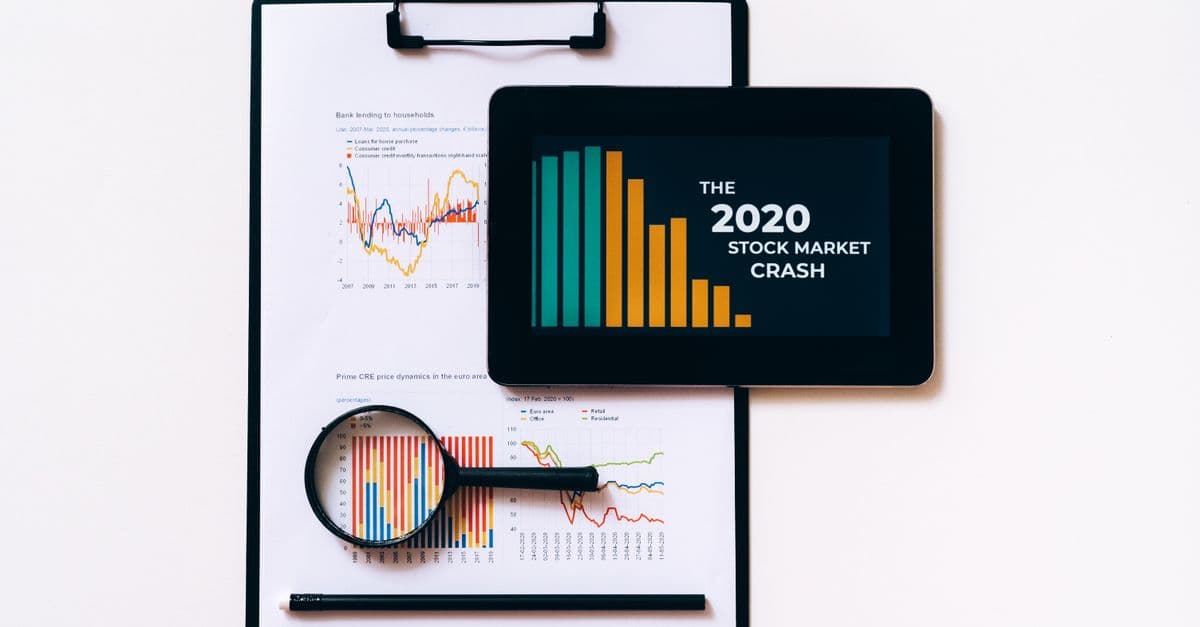
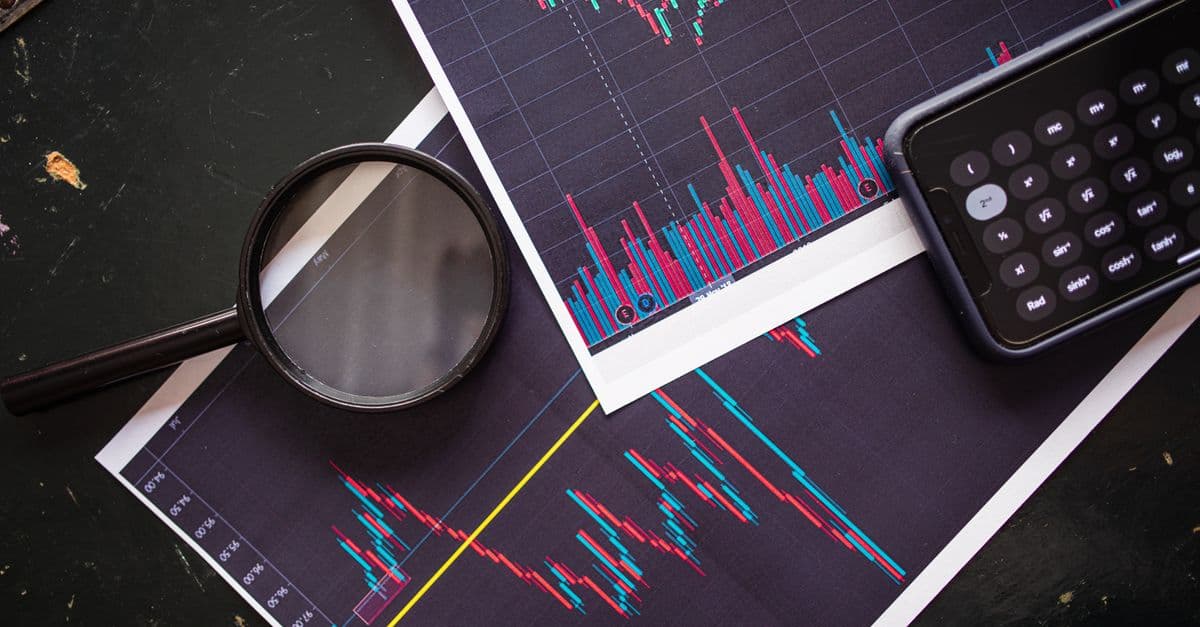
Photo: Leeloo The First / Pexels
A recession is more than just a few months of bad economic news. It's a sustained slowdown that ripples through jobs, businesses, and household finances. Some are mild and quickly forgotten; others reshape economies for decades. Here's what defines a recession, what really causes them, and how to navigate one.
Educational only — not financial advice. Investing involves risk of loss; past performance does not guarantee future results. Consult a licensed financial advisor before making investment decisions.
Key takeaways
- Technical definition: two consecutive quarters of negative GDP growth (commonly used).
- More rigorous: NBER (US) defines as significant decline in economic activity across multiple sectors.
- Common causes: financial crises, oil shocks, inflation responses, pandemics, asset bubbles bursting.
- Average US recession lasts ~10 months but varies widely.
- Recessions reduce wealth and employment but typically end with stronger economies.
What "recession" technically means
Two definitions in common use:
Two consecutive quarters
The simplest definition: GDP shrinking for two consecutive 3-month periods. Used widely in popular discussion.
NBER (more rigorous)
The US National Bureau of Economic Research defines recessions as "a significant decline in economic activity that is spread across the economy and that lasts more than a few months."
The NBER definition considers multiple indicators: employment, real income, retail sales, industrial production. Their declarations come months after the fact, often after the recession is technically over.
Most countries have similar dating committees with similar approaches.
What happens during a recession
Unemployment rises
People lose jobs as businesses cut costs. Companies hire less. New graduates struggle to find work. Unemployment can rise rapidly (1-3 percentage points) in the early months.
GDP shrinks
Total economic output declines. Some sectors hit hard (durable goods, capital equipment, construction); others more resilient (essential services, healthcare).
Consumer spending falls
People worried about jobs save more, spend less. Big-ticket purchases (cars, houses, vacations) drop fastest.
Business investment drops
Companies delay expansion, equipment purchases, hiring.
Asset prices often decline
Stocks usually fall before or during recessions. Real estate may follow. Volatility increases.
Bankruptcy and failures rise
Marginal businesses fail. Some industries see significant consolidation.
Government deficits grow
Tax revenue falls; safety-net spending rises.
Major Recessions in History: Causes, Severity, and Lessons
Recessions vary dramatically in cause, severity, and duration. Understanding historical patterns reveals what drives economic downturns and how policy responses have evolved:
Great Depression (1929-1939): The Benchmark Disaster
The Great Depression remains the standard for economic catastrophe. US unemployment peaked around 25% (some estimates higher in specific regions). The recession lasted approximately 43 months in the US, followed by years of sluggish recovery. Industrial production collapsed by ~50%. Real GDP declined cumulatively by roughly 30% in the US.
Causes: The 1920s stock bubble burst violently in October 1929. Banks failed in cascading waves; the Federal Reserve tightened money supply (exacerbating the crisis, now viewed as catastrophic policy error). International gold standard constraints limited central banks' policy flexibility. Protectionist tariffs (Smoot-Hawley) worsened global downturn.
Aftermath: The Depression fundamentally reshaped economic thinking. It drove creation of the Federal Deposit Insurance Corporation (FDIC), Securities and Exchange Commission (SEC), and modern central banking practices. It also enabled Keynesian economics to dominate academic thinking.
Source: Journal of Economic History (2014) — "Macroeconomic Lessons from the Great Depression"
1973-75 Recession (Oil Crisis and Stagflation)
In October 1973, OPEC imposed an oil embargo on countries supporting Israel, causing crude prices to quadruple in months. This triggered simultaneous recession and inflation (stagflation) — an economically toxic combination.
Impact: US real GDP contracted ~3%, unemployment rose to 9%, and inflation exceeded 12% simultaneously. Traditional policy tools failed — tightening made recession worse; easing made inflation worse. Industrial economies dependent on imported oil (UK, Germany, Japan) suffered severely.
Significance: This recession proved that demand-side economic management (just stimulating growth) wasn't sufficient. It paved the way for supply-side economics and demonstrated how external shocks could destabilize entire economies.
Early 1980s Recession (Volcker Shock)
Federal Reserve Chair Paul Volcker raised interest rates aggressively (federal funds rate peaked above 20%) to break inflation expectations. This deliberately induced recession.
Impact: Unemployment exceeded 10% in the US; industrial capacity utilization fell below 70%. Manufacturing regions suffered severely. Mortgage rates exceeded 15%; housing starts collapsed.
Justification and Outcome: The painful recession successfully reset inflation expectations from double-digit to ~3% — establishing anti-inflation credibility that enabled lower-inflation growth in subsequent decades. Economists now generally view this as necessary and successful, though politically devastating at the time.
1990-91 Recession (Savings and Loan Crisis)
A mild recession triggered by savings and loan institution failures and credit tightening. US GDP declined only ~1.4%; unemployment peaked ~7.8%.
Significance: This recession, though mild, proved politically damaging (George H.W. Bush lost reelection). Demonstrated that recession severity and political impact don't always align.
2001 Recession (Dot-Com Bubble Burst)
The NASDAQ bubble that peaked in March 2000 burst dramatically, wiping out trillions in paper wealth. NASDAQ fell ~78% from peak to trough. The recession was mild by historical standards — ~0.6% GDP decline in 2001.
Unique Features: The recession was driven entirely by technology sector collapse; most other sectors remained robust. Unemployment rose modestly (~5.5%). The recession lasted only 8 months (March-November 2001), brief enough to be barely noticed by average workers.
2008-09 Great Recession (Financial Crisis)
This recession ranks second only to the Great Depression in severity. Housing bubble burst (prices fell ~30% nationwide). Financial institutions failed or required government rescue (Lehman Brothers, Bear Stearns, AIG, Washington Mutual).
Severity: US real GDP declined ~4.3%. Unemployment peaked at 10% in October 2009. Financial sector contracted by double digits. Credit markets froze; interbank lending seized. Millions of households lost homes to foreclosure.
Policy Response: Federal Reserve cut rates to near-zero, engaged in quantitative easing (purchasing $1.7 trillion in assets), and established emergency lending facilities. Treasury injected $700 billion (TARP) into financial system. Congress passed stimulus packages totaling ~$800 billion.
Recovery: Despite aggressive policy response, recovery was glacially slow. Unemployment stayed above 9% for 18+ months. Housing didn't recover to pre-crisis prices for 7+ years in most markets. The recession officially lasted 18 months (December 2007 - June 2009), but psychological recovery took years.
2020 COVID-19 Recession (Pandemic Shock)
The sharpest and briefest recession on record. In March 2020, GDP was expected to contract ~30% on annualized basis (actual Q2 was ~31% annualized). Unemployment spiked from 3.5% to 14.8% in two months — the fastest increase in history.
Unique Characteristics: Driven by government-mandated shutdowns rather than financial dysfunction. Extremely asymmetric — essential workers remained employed while hospitality, entertainment, and travel workers faced catastrophic job losses.
Policy Response: Unprecedented scale. Federal Reserve dropped rates to zero, expanded quantitative easing to >$4 trillion. Congress passed three stimulus bills totaling ~$2 trillion (20% of annual GDP). Stimulus checks, enhanced unemployment insurance, business loans kept household incomes surprisingly stable despite job losses.
Recovery: Recovery was sharply V-shaped. By Q3 2020, GDP had recovered to pre-crisis levels (only 2 quarters of contraction). Unemployment returned to pre-pandemic levels by mid-2021. However, recovery was heavily skewed toward white-collar/remote workers; service sector employment lagged 18+ months.
Source: Federal Reserve Economic Data (2020-2021) — "Economic Recession and Recovery Data"
What causes recessions
Asset bubbles
Bubbles in stocks (1929, 2001), housing (2008), or crypto (varies) eventually burst, destroying wealth and confidence.
Financial crises
Banking failures, credit freezes, debt crises. Famous examples: 1929, 2008. Particularly severe and slow to resolve.
External shocks
Oil price shocks (1973), pandemics (2020), wars affecting major economies.
Central bank tightening
Raising interest rates to fight inflation can tip economies into recession. 1980s, possibly 2022-23 in some economies.
Structural problems
Long-term issues (demographic decline, debt overhang) can trigger recessions.
Confidence collapse
Sometimes recessions develop from coordinated panic — businesses cutting investment, households cutting spending, all reinforcing each other.
Causes usually combine. The 2008 recession had bubble, financial crisis, and confidence collapse all reinforcing.
How long recessions last
US average since WWII
About 10 months from peak to trough.
Recovery time
Time to return to pre-recession GDP levels averages 1-2 years. Time to return to pre-recession employment levels often longer.
Outliers
- Great Depression: 43 months in US.
- 2008 Great Recession: 18 months in US.
- 2020: 2 months (sharpest, briefest).
Modern recessions tend to be shorter than historical ones, partly due to better policy response.
How recessions end
Multiple factors drive recovery:
Adjustment
Excess inventory clears, investments stabilise, prices adjust. Markets find new equilibrium.
Lower interest rates
Central banks cut rates, encouraging borrowing and spending.
Government spending
Stimulus packages provide economic activity.
Inventory restocking
Companies eventually need to restock, driving production.
Pent-up demand
Households eventually need cars, appliances, services. Spending catches up.
Structural reforms
Crisis can drive useful changes that improve productivity afterward.
Recoveries can be:
- V-shaped (quick rebound, like 2020).
- U-shaped (slow recovery, common).
- W-shaped (recovery then second downturn).
- L-shaped (very prolonged stagnation, like Japan post-1990).
How to think about your finances during a recession
Job security
Recessions are when layoffs happen. Strengthen your position: skills, network, employer financial health.
Emergency fund
Aim for 6+ months of expenses. Recessions are when you need it most.
Don't sell stocks at lows
Selling during recession lock in losses. Historically, stocks recover. Selling near lows is the worst time.
Continue investing if possible
Recession-era purchases of broadly diversified investments often look great years later.
Pay down high-interest debt
Recessions are bad times to carry high-interest debt.
Avoid large purchases
If possible, delay big purchases requiring debt or job security.
Don't panic
Most recessions end. Most people recover. Catastrophic outcomes are rare for diversified, employed individuals.
How recessions affect different groups
Different industries
Cyclical industries (automotive, construction, hospitality, retail) are hardest hit. During the 2008 recession, vehicle sales fell 37% from peak. Construction employment fell 20%. These industries depend on consumer spending and business investment, both of which collapse in recessions.
Defensive industries (healthcare, food, utilities, telecommunications) remain relatively resilient. People still need groceries, electricity, and basic medical care regardless of economic conditions. During 2008, these sectors posted employment gains while others collapsed.
Financial services face a unique risk: recessions are often triggered by financial crises, turning financial sector weakness into recession causation rather than merely correlation.
Wealth distribution
Wealthy households often weather recessions better — they have savings, investment portfolios, and access to credit. During 2008, the wealthiest 20% of households lost ~15% of net worth; the poorest 20% lost ~35%.
Lower-income households are more vulnerable to job loss (easier to fire, fewer transferable skills) and have minimal emergency savings. A 2-month job loss can trigger cascading problems (missed rent, mounting debt, credit damage).
This dynamic widened wealth inequality during every recent recession. Recessions are one of the largest drivers of inequality increase.
Demographics
Young workers (age 16–25) face particular hardship. First-time job searches are difficult anyway; during recessions, competition intensifies, hiring freezes, and offers are scarce. A cohort that graduates into a recession often suffers lifelong earnings penalties — studies show 10–15 year old recession cohorts earn 15–20% less over their entire careers compared to cohorts entering during expansions. This isn't just temporary; the career trajectory never fully catches up.
Older workers (55+) face different problems: retraining is harder, employers prefer youth, and older workers' longer job histories sometimes make them targets for cost-cutting. Unemployment duration for workers 55+ can extend 2–3× longer than younger workers during recessions.
Mid-career workers (35–50) typically fare better — they have established networks, specialized skills, and savings. They're less vulnerable to permanent scarring.
Regions
Geographic concentration of recessions: Manufacturing-dependent regions (Rust Belt, industrial Midwest) were devastated by 2008 but recovered much more slowly than service-sector regions. Manufacturing employment in these regions fell 20–30% and didn't recover for 5–7 years.
Resource-dependent regions: Energy hub regions (Louisiana, Wyoming, Texas) suffer when commodity prices collapse. The 2014–16 oil price crash triggered local recessions in these areas despite national recovery.
Pandemic-era patterns: The 2020 recession showed an unusual geographic split. Regions with strong tech sectors (San Francisco, Seattle, Austin) recovered quickly (remote work thrived). Regions dependent on tourism and hospitality (Miami, Las Vegas, Hawaii) suffered extended downturns.
This illustrates that "the recession" is not monolithic — some regions spiral while others surge.
Source: Federal Reserve Bank of St. Louis (2024) — Regional Economic Data and Recession Impact Analysis.
Youth Unemployment and Long-Term Scarring
One of the most studied recession phenomena is the effect on young workers entering the labour market during downturns.
2008 graduation cohort: Workers who graduated high school or college in 2008–2009 faced 25–30% unemployment rates (vs. 5–8% in normal times). Many couldn't find jobs for 18–24 months. Studies tracking these cohorts show:
- Immediate effect: 5–10 percentage point employment gap persists for 3–4 years after graduation.
- Wage scars: Even after re-employment, these cohorts earn 15–20% less than cohorts graduating in 2007 or 2011.
- Job quality: They were forced to accept lower-skill, lower-wage jobs; many never transitioned to better positions.
- Persistence: Tracking studies through 2023 show these effects still visible 15 years later.
Mechanism: The scars likely arise from two factors: (1) lower starting wages that become anchors (employers base new offers on previous salary), and (2) earlier-career disruption that permanently alters skill accumulation and network formation.
This phenomenon is a powerful argument for recession prevention or aggressive intervention to protect young workers' employment during downturns — the long-term costs to both individuals and society are enormous.
Historical Trends: Are Recessions Getting More or Less Severe?
Frequency: The average recession interval was ~8 years before WWII, ~6 years from 1945–2000, and ~7 years since 2000. Recessions haven't become significantly less frequent despite better policy tools, suggesting some cyclicality is inherent to market economies.
Severity: Measured by peak unemployment and output loss, recessions have generally become less severe since WWII. Pre-WWII recessions (1890s, 1920s) often saw unemployment peaks of 15–25%. Post-WWII recessions average 6–10% peak unemployment. The 2008 recession (peak 10%) was the worst since the Great Depression (25%) precisely because it was the severest modern recession.
Duration: Recessions have become shorter. Pre-WWII recessions averaged 18–20 months. Post-WWII average is ~10 months. The 2020 recession (2 months) was the briefest on record, partly because policy response was immediate and massive.
Conclusion: Better monetary and fiscal tools have moderated severity and duration, supporting the hypothesis that knowledge and policy matter. However, recessions haven't disappeared despite this progress, suggesting business cycle oscillation may be fundamental to market economies or at least very difficult to prevent entirely.
Source: Nordhaus, W. D., "Two Centuries of Productivity Growth and the Great Recession" (2009) — Historical recession patterns and severity trends.
How are recessions predicted?
Yield curve inversion
When short-term interest rates exceed long-term rates, often (not always) precedes recession.
Leading indicators
Various indices try to predict 6-12 months out. Mixed reliability.
Economic surveys
Confidence indicators, business sentiment.
Asset markets
Stock market often drops before recession begins, but also has many false alarms.
Credit markets
Tightening credit conditions often precede recessions.
Predictions are notoriously unreliable. Most recessions are unexpected in their exact timing, even when broadly anticipated.
Common misconceptions
"Recessions are always bad"
Painful, but they correct excesses (too much debt, asset bubbles) and lay groundwork for healthier growth.
"We can prevent all recessions"
Some recessions might be preventable; the business cycle has been remarkably persistent across centuries.
"GDP fall = recession"
Sometimes, but usually requires sustained decline across multiple sectors.
"Recessions last forever"
Most are 1-2 years. Recovery varies but usually happens.
"Stock market and economy are the same"
They overlap but aren't identical. Stocks can drop without recession; recessions don't always cause sharp stock declines.
Modern Recession Prevention and Automatic Stabilizers
Since the Great Depression, economies have developed institutional mechanisms to moderate recession severity:
Automatic Stabilizers: Unemployment insurance, progressive taxation, and welfare programs automatically expand during recessions (spending increases, taxes fall), providing income support without requiring legislative action. These stabilizers dampen recession severity — estimates suggest they reduce recession depth by 20-30% compared to pre-Depression economies.
Central Bank Policy Tools: Modern central banks have multiple levers:
- Interest rate adjustment (cuts when recession threatens)
- Quantitative easing (asset purchases to inject liquidity)
- Emergency lending facilities
- Forward guidance (signaling future policy to stabilize expectations)
These tools didn't exist during the Great Depression and would likely have prevented that catastrophe's severity.
Source: IMF Working Paper (2019) — "Automatic Stabilizers in Modern Economies"
International Policy Coordination: In 2008-09, major central banks coordinated rate cuts, currency swaps, and asset purchases. Information sharing and coordinated responses limited contagion compared to 1929-1930 when countries acted unilaterally.
Regulatory Buffers: Post-2008 reforms require banks to maintain capital buffers and stress-test against recession scenarios. These reduce banking system fragility.
Frequently Asked Questions
Q: Are we currently in a recession?
A: Check official statistics from your country's data agency (US: NBER, UK: ONS, Eurozone: Eurostat). Headlines often precede formal recession declarations by 6-12 months. Official announcements typically come months after recessions have actually ended, creating confusion about real-time status.
Q: How does the government officially know when a recession ends?
A: Government agencies track multiple indicators (employment, industrial production, retail sales, personal income). Most countries have official committees (US: NBER) that declare recession start and end dates months after they occur. An official "end" announcement typically comes 6-12 months after economic recovery has already begun.
Q: Why don't politicians and central banks prevent recessions entirely?
A: They try to moderate severity, but tools are imperfect and human knowledge is incomplete. Recessions often stem from external shocks (pandemics, wars, oil crises) that policy cannot directly prevent. Some recessions result from necessary policy adjustments (rate increases fighting inflation). The business cycle has persisted across all economic systems for centuries — suggesting it may be inherent to decentralized economies rather than preventable.
Q: Should I save more during a recession or invest in cheap assets?
A: If your job is secure, continuing to invest during downturns historically produces superior long-term returns (you're buying assets at low prices). If your job is at risk, building emergency savings (6+ months expenses) takes priority. If possible, do both — maintain emergency savings while continuing regular investments if employed.
Q: How does a recession affect my mortgage payment?
A: Fixed-rate mortgages are unaffected — your payment stays identical. Variable-rate mortgages usually see rates fall as central banks cut interest rates, reducing your payment. The bigger recession risk for most households is job loss, which can make any mortgage payment unaffordable. Maintaining employment security is more important than mortgage rate type.
Q: Are rich and poor households affected equally by recessions?
A: No. Wealthy households typically weather recessions better because they have savings, investment portfolios, and can access credit. Lower-income households are more vulnerable to job loss and have minimal emergency savings. Wealth inequality typically widens during recessions. However, recessions do reduce absolute living standards across all income groups — everyone is worse off, though lower-income households experience greater proportional damage.
The bottom line
A recession is a sustained economic decline affecting jobs, output, and wealth. They're painful but temporary, and have been a normal feature of market economies for centuries. Different recessions have different causes and severities; modern policy responses generally limit the duration and depth. For individuals, the keys are: keep an emergency fund, secure your employment situation, don't panic-sell investments, and continue investing if you can. Understanding the cycle helps you prepare for and weather these inevitable downturns rather than be surprised by them.
Read next:
Follow new articles
Add SciHub101 to your feed reader to see new science and technology stories.
About the Author
SciHub101 is an independent science and technology publication founded and edited by Buğra Sözeri, a software engineer and app developer based in Türkiye. AI tools assist with drafting and research. Source documentation in the existing archive is uneven, and articles are being reviewed and corrected. The Editorial Team byline identifies editorial responsibility; it does not certify specialist or independent human review. Where we compare products, anything built by our own team is labelled as such — see the editorial guidelines and About page for how corrections and disclosures work.
Related Articles

How to Actually Plan for Retirement, Without the Marketing Spin
Retirement planning gets oversold by product sellers and undersold by everyone else. Here is the arithmetic behind savings rates, withdrawal rules, tax-advantaged accounts, Social Security, and the risks that quietly break plans.
How Money Actually Works — And Why It's a Social Construct
Money feels real and solid, yet it is built on belief. No gold, no government, no army can make money work if people stop trusting it. Here is what money actually is.
Countries with the Highest GDP Per Capita (Nominal, 2024)
Luxembourg's nominal GDP per capita of $127,674 made it the wealthiest sovereign nation on Earth in 2024 by IMF estimates — about 20% higher than Ireland in second place. The top of this list is dominated by small, open economies with outsized financial sectors, tech hubs, or energy wealth rather than large industrial powers.
What Is a Recession? Economics Explained
Recessions explained: definitions, leading indicators, historical examples, recovery shapes, and what investors typically do during downturns.
What Causes Recessions: Understanding Economic Cycles
Recessions are not random disasters — they follow patterns. Understanding those patterns explains why they keep happening.

Countries with the Highest Purchasing Power (Ranked 2025)
Luxembourg tops the world in purchasing power per capita at approximately $127,674 nominal GDP — but by purchasing power parity, Switzerland, Singapore, Norway, and the United States compete closely for the positions that matter most to daily living standards. This ranking covers the top 15 countries by Numbeo's Local Purchasing Power Index 2025, cross-referenced with IMF PPP GDP per capita, with methodology, caveats, and an explanation of why nominal wealth and real purchasing power so often diverge.