What Is a Recession? Economics Explained
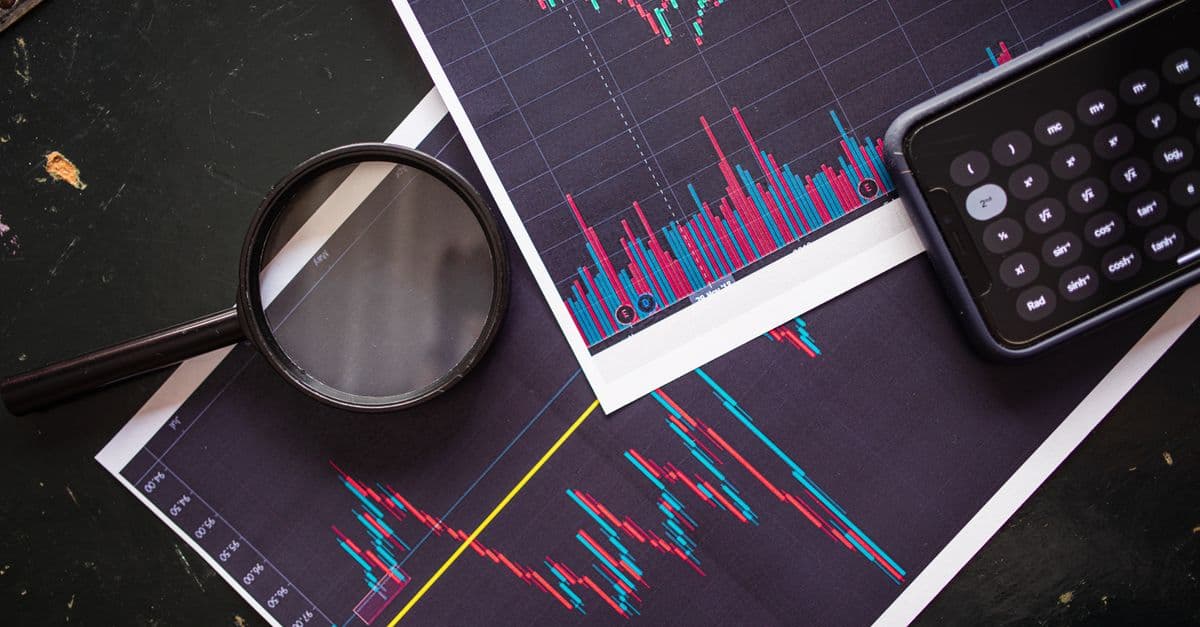
Photo: RDNE Stock project / Pexels
"Recession" is one of the most-feared words in economics, and one of the most misunderstood. A recession is not an economic collapse; it is a normal, recurring phase of the business cycle, the same way winter is a normal phase of the seasons. The United States has gone through 34 of them since 1854, according to the National Bureau of Economic Research (NBER), and the economy has recovered from every single one. Understanding how recessions are defined, what causes them, how economists see them coming, and how they typically resolve gives you a framework for reading economic news without panicking every time a headline uses the word.
Educational only — not financial advice. This article explains economic concepts and historical patterns. It is not a recommendation to buy, sell, or hold any investment. Investing involves risk of loss, past performance does not guarantee future results, and you should consult a licensed financial advisor before making decisions about your own money.
Defining a Recession
Economists actually use two different definitions, and confusing them is the single most common mistake in recession coverage.
The Popular Rule of Thumb
The shorthand most journalists and casual observers reach for is two consecutive quarters of negative real GDP growth ("real" meaning adjusted for inflation). It is easy to calculate from a single number the government already publishes quarterly, which is exactly why it became the household definition after economist Julius Shiskin popularized it in a 1974 New York Times article. The problem is that GDP is a single, backward-looking, frequently revised statistic. It can miss what is actually happening to jobs, income, and production in real time.
The NBER Official Definition
In the United States, the body that actually gets to declare a recession is the NBER Business Cycle Dating Committee, a group of eight academic economists who have served as the country's unofficial-but-authoritative recession referee since 1978. Their definition is broader and more careful:
"A significant decline in economic activity that is spread across the economy and lasts more than a few months, normally visible in real GDP, real income, employment, industrial production, and wholesale-retail sales." (NBER)
Rather than one quarterly GDP figure, the committee looks at six monthly indicators together (real personal income less transfers, nonfarm payroll employment, real personal consumption expenditures, real manufacturing and trade sales, household-survey employment, and industrial production), weighing depth, diffusion (how broadly the decline is spread across industries and regions), and duration. That is why the NBER can decline to call something a recession even when GDP contracted twice in a row, and why the committee typically announces its verdict six to eighteen months after the fact, once revised data removes the guesswork (NBER Business Cycle Dating Procedure FAQ). The first half of 2022 is the textbook case: real GDP fell in both Q1 and Q2, satisfying the popular rule of thumb, but employment kept growing by hundreds of thousands of jobs a month and consumer spending held up, so the NBER never declared a recession for that period.
Most surprising fact: The U.S. economy has spent roughly 15% of the time since 1854 in recession and 85% expanding, according to NBER business cycle data, despite popular perception that downturns dominate the economic story. (NBER US Business Cycle Expansions and Contractions)
How Economists See a Recession Coming
No single indicator perfectly predicts a recession. Economists instead watch a handful of gauges that have historically moved before the broader economy turns down, the way a falling barometer reading warns of a storm before the rain arrives.
The Yield Curve Inversion
Under normal conditions, longer-term bonds pay higher interest than short-term ones, because lending money for ten years carries more risk than lending it for two. When investors expect the economy to weaken, they pile into long-term Treasuries for safety, pushing long-term yields down relative to short-term ones, a pattern called an inversion. A 2-year Treasury yield rising above the 10-year yield has preceded every U.S. recession since 1955 with only one false signal, in the mid-1960s, which is why it is generally treated as the single strongest recession predictor available to the public in real time (Federal Reserve Bank of St. Louis, FRED yield spread series). The lag between inversion and recession has ranged from roughly six months to two years, so it is a warning, not a countdown clock.
The ISM Purchasing Managers Index
The Institute for Supply Management surveys manufacturing executives every month and compiles their answers into a single number. A reading above 50 means manufacturing activity is expanding; below 50 means it is contracting. Sustained readings under 50, especially alongside falling new orders, have historically shown up months before broader recessions, because factories cut production before the slowdown shows up in jobs and retail data.
The Sahm Rule
Economist Claudia Sahm, formerly of the Federal Reserve, proposed this rule in 2019 as a simple, apolitical trigger for automatic recession-relief spending. It fires when the three-month moving average of the U.S. unemployment rate rises 0.5 percentage points or more above its low point over the prior twelve months. The Sahm Rule has triggered within, but never before, every recession since the 1970s, which made it a widely cited "real-time" recession signal (Federal Reserve Bank of St. Louis, Real-time Sahm Rule Recession Indicator). It is not infallible: subsequent research, including a 2024 analysis, has identified false triggers in earlier decades where the rule crossed its threshold without a recession following, and Sahm herself has cautioned against treating it as a mechanical forecasting tool rather than the narrower policy trigger she originally designed it to be.
The Conference Board Leading Economic Index
The LEI blends ten separate data series, including building permits, initial jobless claims, stock prices, and manufacturers' new orders, into a single composite index published monthly by The Conference Board. Because it draws on ten independent sources rather than one, it tends to smooth out noise that any single indicator would produce on its own. Several consecutive months of decline in the LEI have historically preceded recessions, though the index has also produced false or delayed signals in some cycles, notably flashing warnings for extended stretches in 2022 and 2023 without a recession materializing on schedule.
Consumer Confidence and Retail Sales
Consumer spending drives roughly two-thirds of U.S. GDP, so what households say about their own finances, and what they actually buy, matters enormously. Sharp drops in survey-based confidence measures, combined with slowing inflation-adjusted retail sales, often show up as households pull back before layoffs become widespread, since spending decisions react faster to sentiment than hiring decisions do.
What Causes Recessions?
There is no single trigger. Every recession in modern history traces back to one or more of six broad mechanisms.
- Monetary tightening. Central banks raise interest rates to fight inflation, which makes borrowing more expensive for businesses and consumers alike, cooling investment and spending on purpose. This is sometimes called "engineering a soft landing," but it can overshoot into an actual downturn. The 1981–82 Volcker recession is the clearest example: the Federal Reserve pushed the federal funds rate above 19% to break double-digit inflation, deliberately trading a recession for lower prices.
- Asset bubbles popping. When prices for an asset class, tech stocks in 2000, housing in 2007, rise far beyond what underlying earnings or rents justify, the eventual correction destroys wealth fast enough to drag down spending and lending across the whole economy.
- Oil and commodity shocks. A sudden spike in the price of a critical input, like the 1973 OPEC oil embargo that roughly quadrupled crude prices, raises costs for nearly every business simultaneously and squeezes household budgets, producing the unusual combination of high inflation and high unemployment known as stagflation.
- Financial crises. When banks fear that other banks or borrowers cannot repay them, they stop lending to each other and to businesses, freezing the credit that the whole economy runs on. The 2008 collapse of Lehman Brothers turned a housing downturn into a global financial crisis largely through this channel.
- Exogenous shocks. Pandemics, wars, and natural disasters can halt economic activity directly, independent of any prior imbalance in the financial system. The COVID-19 shutdowns in early 2020 produced the sharpest quarterly GDP contraction on record in the United States, alongside the shortest recession NBER has ever dated.
- Loss of confidence. John Maynard Keynes called this "animal spirits." When businesses and households expect a downturn, they cut spending and investment pre-emptively, and that collective pullback can itself cause the very contraction everyone feared, a self-fulfilling loop that is genuinely difficult to distinguish from the "real" economic causes listed above.
These mechanisms frequently compound each other. The 2008 recession combined an asset bubble (housing), a financial crisis (the banking freeze that followed), and a collapse in confidence, which is part of why it became the most severe U.S. downturn since the Great Depression.
Historical Recessions
| Recession | Years | Trigger | Severity |
|---|---|---|---|
| Great Depression | 1929–1933 | Stock market crash, cascading bank failures, deflation, and policy missteps | Catastrophic — roughly 25% unemployment at the peak |
| 1973–75 Oil Crisis | 1973–1975 | OPEC oil embargo, resulting stagflation | Severe — unemployment near 9% |
| Volcker Recession | 1981–1982 | Federal Reserve raised rates above 19% to break double-digit inflation | Severe — unemployment reached 10.8%, the post-WWII high until 2020 |
| Early 1990s Recession | 1990–1991 | Oil price spike from the Gulf War, savings-and-loan crisis, credit crunch | Moderate — unemployment near 7.8% |
| Dot-com Bust | 2001 | Tech stock bubble collapse compounded by the September 11 attacks | Mild and short by historical standards |
| Great Recession | 2007–2009 | Subprime mortgage crisis and the Lehman Brothers collapse | Severe — unemployment near 10%, global financial system near-collapse |
| COVID-19 Recession | Feb–Apr 2020 | Pandemic-driven shutdowns of large sections of the economy | Sharpest GDP contraction on record; shortest NBER-dated recession ever, at about two months |
Table: Major U.S. recessions since 1929, their proximate triggers, and comparative severity. Compiled from NBER Business Cycle Dating Committee announcements and Bureau of Labor Statistics historical unemployment data.
The Great Depression, in context
No later downturn has come close to the Great Depression's scale. Real GDP fell by roughly a third between 1929 and 1933, thousands of banks failed with no deposit insurance to protect savers, and unemployment reached about a quarter of the workforce. It is also the reason most of the tools discussed in this article exist at all: deposit insurance (the FDIC), the Federal Reserve's modern crisis-lending powers, and Social Security were all direct policy responses to that decade.
The Volcker double dip
The early 1980s produced back-to-back recessions, sometimes called a "double dip," because the Federal Reserve under chairman Paul Volcker briefly eased rates in 1980 before inflation re-accelerated and forced an even sharper tightening in 1981–82. It is the most extreme example in U.S. history of a central bank deliberately inducing a recession as the cost of stopping inflation, and it worked: inflation fell from roughly 14% to under 4% within a few years, at the cost of double-digit unemployment.
2008 versus 2020: two very different shocks
The Great Recession and the COVID-19 recession are useful to compare precisely because they look similar on a GDP chart but had almost opposite mechanics. 2008 was a slow-building financial crisis: years of subprime lending and mortgage securitization created a hidden fragility that took over a year to fully unwind once it started cracking, and credit stayed frozen long after the initial shock. 2020 was the opposite: a policy-driven shutdown that hit GDP instantly and then reversed just as quickly once shutdowns eased and unprecedented fiscal and monetary support hit the economy, producing the shortest recession on NBER's record book despite being, for a few weeks, the sharpest.
What Actually Happens Once a Recession Begins
Once a recession takes hold, a fairly predictable sequence tends to unfold, though the exact magnitude and order vary by cycle.
- Unemployment rises, typically by two to five percentage points from its pre-recession low.
- Corporate earnings fall as consumer and business spending contract.
- Stock markets often decline 20% to 50% from their prior peak, the conventional threshold for a bear market.
- Credit tightens as lenders grow more cautious, and financially weaker companies default or restructure.
- Real estate transactions slow, and in severe downturns, prices fall.
- Central banks typically cut interest rates to make borrowing cheaper and stimulate spending.
- Governments often deploy fiscal stimulus: expanded unemployment benefits, tax rebates, or infrastructure spending, to support demand while the private sector retrenches.
The order matters less than the interaction: falling asset prices reduce household wealth, which reduces spending, which reduces corporate revenue and hiring, which further reduces household income and spending. Economists call this kind of mutually reinforcing decline a negative feedback loop, and central bank rate cuts plus government stimulus exist specifically to interrupt it before it spirals further.
Recession vs. Depression vs. Slowdown
These three terms describe points on the same spectrum of severity, not three unrelated phenomena, which is why people use them loosely and inconsistently in everyday conversation.
| Slowdown | Recession | Depression | |
|---|---|---|---|
| GDP impact | Growth decelerates but stays positive | Broad decline, commonly two or more quarters of negative real GDP | GDP falls more than roughly 10%, or a recession that lasts three-plus years |
| Unemployment | Slight uptick | Roughly 6% to 10% is typical | 20% or higher in the most severe cases |
| Duration | A few months | Six to eighteen months is typical | Multiple years |
| Recent example | The 2015–16 oil-price slump | The 2008 and 2020 recessions | The 1929–33 Great Depression |
Table: How economists typically distinguish a slowdown, recession, and depression, using GDP, unemployment, and duration.
There is no single legally binding line between a severe recession and a depression; economists use the term "depression" informally for downturns that dwarf the postwar norm in both depth and length. Some economists have applied the term retrospectively to Greece's decade-long contraction following the 2009–2018 debt crisis, though that case is debated because it combined a domestic recession with an externally imposed fiscal austerity program rather than the classic banking-collapse pattern of 1929.
Recovery Shapes
Economists describe the path out of a recession by the shape it traces on a GDP chart, a shorthand that is more useful for intuition than for precision.
- V-shaped: a sharp drop followed by an equally sharp rebound, illustrated by the 2020 COVID-19 recession, where GDP fell and then recovered within a couple of quarters once shutdowns lifted and stimulus hit.
- U-shaped: a drop, a prolonged flat trough, and then a gradual recovery, as in the 1990–91 recession, where the economy bottomed out and stayed weak for an extended stretch before clearly turning up.
- L-shaped: a drop with little meaningful recovery for years, the pattern most associated with Japan's "lost decade" following its early-1990s asset bubble collapse.
- W-shaped: a "double dip," a brief recovery followed by a second decline, as in the 1980 and 1981–82 back-to-back recessions.
- K-shaped: different parts of the economy recover at different speeds, so that on a chart the lines diverge like the two strokes of the letter K. This label became widely used in commentary on the uneven post-2020 recovery, in which asset owners and white-collar workers rebounded quickly while lower-wage service workers lagged.
- Swoosh, or Nike-shaped: a sharp initial drop followed by a long, gradual climb rather than a quick rebound, essentially a slower cousin of the V shape.
Think of these shapes the way a doctor reads a fever chart: the label doesn't diagnose the cause, but it quickly tells you whether the patient snapped back, stayed sick for a while, or never really recovered.
How Sectors and Assets Have Behaved in Past Recessions
This section describes historical patterns, not guidance for your own portfolio; how any individual investor should respond depends on personal circumstances, risk tolerance, and time horizon that only a licensed advisor can assess for you.
Historically, in past U.S. recessions:
- Defensive sectors, consumer staples, utilities, and healthcare, have tended to outperform the broader market, because people keep buying groceries, electricity, and medicine regardless of the economic cycle.
- Cyclical sectors, industrials, materials, autos, and discretionary retail, have tended to underperform, since demand for big-ticket and discretionary purchases falls first when households tighten budgets.
- High-quality government bonds, especially Treasuries, have often rallied in past downturns as central banks cut interest rates, since falling rates push existing bond prices up.
- Cash preserves flexibility but historically loses purchasing power to inflation over time, which is a separate trade-off worth understanding on its own; see our inflation explainer for how that erosion works.
- Broad, diversified index investors who kept contributing through past downturns have historically captured the recovery that followed, according to long-run academic and industry research on market timing, though this is a description of historical patterns, not a guarantee about any future cycle.
Timing recessions in real time is notoriously difficult, largely because equity markets are forward-looking and have often bottomed before the economic data itself turns positive. Research on lump-sum versus staggered investing, summarized in our dollar-cost averaging explainer, speaks directly to why trying to exit and re-enter the market around a recession is harder in practice than it sounds.
What People Get Wrong About Recessions
"A recession means the whole economy is shrinking uniformly." In reality, recessions are uneven. Manufacturing, housing, and cyclical retail typically contract far more than healthcare, utilities, or government spending, and some regions and industries can even keep growing through a national recession, which is part of why NBER weighs the breadth of a decline rather than relying on a single national number.
"The stock market and the economy move together." They are related but not synchronized. Stock prices are forward-looking and often fall well before a recession is officially declared and recover well before it officially ends, because investors are pricing in expectations about the future, not reporting on the present. That mismatch is exactly why NBER's confirmations arrive six to eighteen months after the fact: markets typically get there first.
"A yield curve inversion means a recession is imminent." The signal has an excellent long-run track record, but the lag between inversion and recession has varied from about six months to more than two years across past cycles, and at least one inversion in the historical record was not followed by a recession at all. Treat it as raising the probability of a future downturn, not as a countdown clock with a fixed number of months on it.
"Recessions are purely destructive." They cause real, serious hardship for workers who lose jobs and businesses that fail, and that human cost should never be minimized. But economists also point out that recessions clear out businesses and investments that were only surviving on cheap credit or speculative excess, reset asset prices closer to underlying fundamentals, and often force productivity-improving changes that businesses had been avoiding. Many economists describe this as a painful but recurring feature of how capitalist economies cycle between expansion and correction, not evidence of system failure.
"Every GDP contraction is a recession, and vice versa." As the 2022 example above shows, the two-negative-quarters rule of thumb and the NBER's actual multi-indicator standard can disagree. Headlines that flatly declare a recession the moment one GDP report comes in negative are almost always getting ahead of the NBER's own process.
The Takeaway
A recession is not a mysterious event that appears out of nowhere; it is the natural corrective phase of a business cycle that has repeated itself roughly three dozen times in U.S. history, and the economy has recovered from all of them. The mechanics that cause and end recessions, tightening credit, popping asset bubbles, and the central bank and fiscal responses that eventually loosen credit again, are the same mechanics economists have been tracking since the 1930s. Understanding the difference between the popular two-quarter rule of thumb and NBER's broader, slower, more careful definition is the single most useful distinction for reading recession headlines critically rather than reactively.
FAQs
Q: Is two negative GDP quarters always a recession? A: Not officially. The NBER Business Cycle Dating Committee uses a broader set of six monthly indicators, including employment, real income, and industrial production (see the full list above), rather than relying on one quarterly GDP figure alone. The United States recorded two consecutive negative GDP quarters in early 2022, but the NBER never declared that period a recession because employment and consumer spending kept growing throughout it.
Q: How long do recessions typically last? A: Post-WWII U.S. recessions have averaged roughly ten to eleven months, according to NBER business cycle data. The COVID-19 recession was the shortest on record at about two months, while the Great Recession of 2007–2009 lasted 18 months, the longest since the Great Depression.
Q: What's the difference between a recession and a depression? A: There is no single official cutoff, but economists generally treat a depression as either a GDP decline exceeding roughly 10% or a downturn that persists for three or more years, far beyond the typical recession's duration. The Great Depression of 1929–1933 remains the reference case in developed economies.
Q: Does a yield curve inversion guarantee a recession? A: No. It has a strong historical track record, preceding every U.S. recession since 1955 with only one widely cited false signal in the mid-1960s, but the lag between inversion and the actual downturn has ranged from about six months to over two years, and the magnitude of the eventual recession has varied considerably.
Q: What is the Sahm Rule, and how reliable is it? A: The Sahm Rule signals a likely recession when the three-month moving average of the unemployment rate rises 0.5 percentage points or more above its low point from the prior 12 months. It has triggered within every recession since the 1970s, but subsequent research has identified earlier instances where it crossed the threshold without a recession following, and even its creator, economist Claudia Sahm, has cautioned against treating it as a mechanical forecasting tool.
Q: Are recessions always caused by the Federal Reserve raising interest rates? A: No. Monetary tightening is one common trigger, as in 1981–82 and arguably 2007–08, but recessions have also been caused by oil shocks (1973), asset bubbles popping (2001), financial-system freezes (2008), and external shocks entirely unrelated to interest rates, like the COVID-19 shutdowns in 2020.
Q: Do stock markets always fall before a recession officially starts? A: Markets often begin declining before a recession is confirmed and often bottom out and start recovering before it officially ends, because equity prices are forward-looking and react to expectations rather than to confirmed, backward-looking economic data. This is one reason NBER's official recession calls typically arrive six to eighteen months after the fact.
Q: What should I do with my investments before a possible recession? A: This article is educational, not financial advice. Historical research broadly suggests that long-term investors who keep contributing to diversified portfolios rather than attempting to time entries and exits around a recession have generally captured more of the eventual recovery, since markets have often turned upward before the economic data confirmed the recession was over. Anyone making decisions about their own money should consult a licensed financial advisor who can account for their personal circumstances.
Q: Can a country be in a recession without the stock market crashing? A: Yes. The link between GDP contractions and stock market declines is correlated but not one-to-one; markets price in expectations well ahead of the data, so a mild or already-anticipated recession can coincide with a comparatively modest market decline, while a market crash can also occur, as in 1987, without a corresponding recession following.
Q: Why does the NBER take so long to declare a recession? A: The committee deliberately waits for revised, confirmed data across its six core monthly indicators (real personal income less transfers, nonfarm payroll employment, real personal consumption expenditures, real manufacturing and trade sales, household-survey employment, and industrial production), rather than relying on preliminary reports that are frequently revised later. That caution is why official recession announcements have historically come six to eighteen months after the actual downturn began.
For more, see our guides on inflation explained, how central banks work, and dollar-cost averaging explained.
Sources
- National Bureau of Economic Research, Business Cycle Dating Procedure: Frequently Asked Questions
- National Bureau of Economic Research, US Business Cycle Expansions and Contractions
- Federal Reserve Bank of St. Louis, FRED, Real-time Sahm Rule Recession Indicator (SAHMREALTIME)
- Federal Reserve Bank of St. Louis, FRED, NBER-based Recession Indicators for the United States (USREC)
- Reinhart, C. & Rogoff, K. (2009), This Time Is Different: Eight Centuries of Financial Folly, Princeton University Press
- The Conference Board, Leading Economic Index methodology and monthly releases
- U.S. Bureau of Labor Statistics, historical unemployment rate data
- IMF World Economic Outlook reports (various years)
Follow new articles
Add SciHub101 to your feed reader to see new science and technology stories.
About the Author
SciHub101 is an independent science and technology publication founded and edited by Buğra Sözeri, a software engineer and app developer based in Türkiye. AI tools assist with drafting and research. Source documentation in the existing archive is uneven, and articles are being reviewed and corrected. The Editorial Team byline identifies editorial responsibility; it does not certify specialist or independent human review. Where we compare products, anything built by our own team is labelled as such — see the editorial guidelines and About page for how corrections and disclosures work.
Related Articles

Bitcoin Mining Explained — How It Actually Works
How Bitcoin mining uses proof of work to order transactions and secure the network, with clear coverage of halvings, difficulty, hardware, energy estimates and profitability uncertainty.

Roth IRA vs 401(k) — Which Retirement Account? (2026 Guide)
Compare Roth IRA, traditional 401(k), Roth 401(k), and HSA for 2026. Contribution limits, tax rules, SECURE 2.0 changes, and a clear decision framework.

What Is GDP and Why It Matters
GDP is the world's most important economic statistic — and one of the most misunderstood. Here's what it actually measures, and what it misses.
What Causes Recessions: Understanding Economic Cycles
Recessions are not random disasters — they follow patterns. Understanding those patterns explains why they keep happening.
What Is a Recession — and How Bad Can They Actually Get?
A recession is two consecutive quarters of negative growth — but that simple definition hides a much more interesting story. Here's what really causes them, what to expect, and how they end.
Complete Finance Guide 2026 — How Money Really Works
The complete guide to finance in 2026: how money, inflation, and central banks work, investing fundamentals, markets, cryptocurrency, and personal finance explained.