Finance & Crypto
Why Housing Is So Expensive
Housing prices rise when land, zoning, interest rates, construction costs, income, speculation, and supply constraints collide.
7 articles tagged with #housing
Housing prices rise when land, zoning, interest rates, construction costs, income, speculation, and supply constraints collide.
Wealth inequality is not the same as income inequality. This guide explains net wealth, housing, pensions, debt, inheritance, top-tail measurement and why country rankings change with the data source.
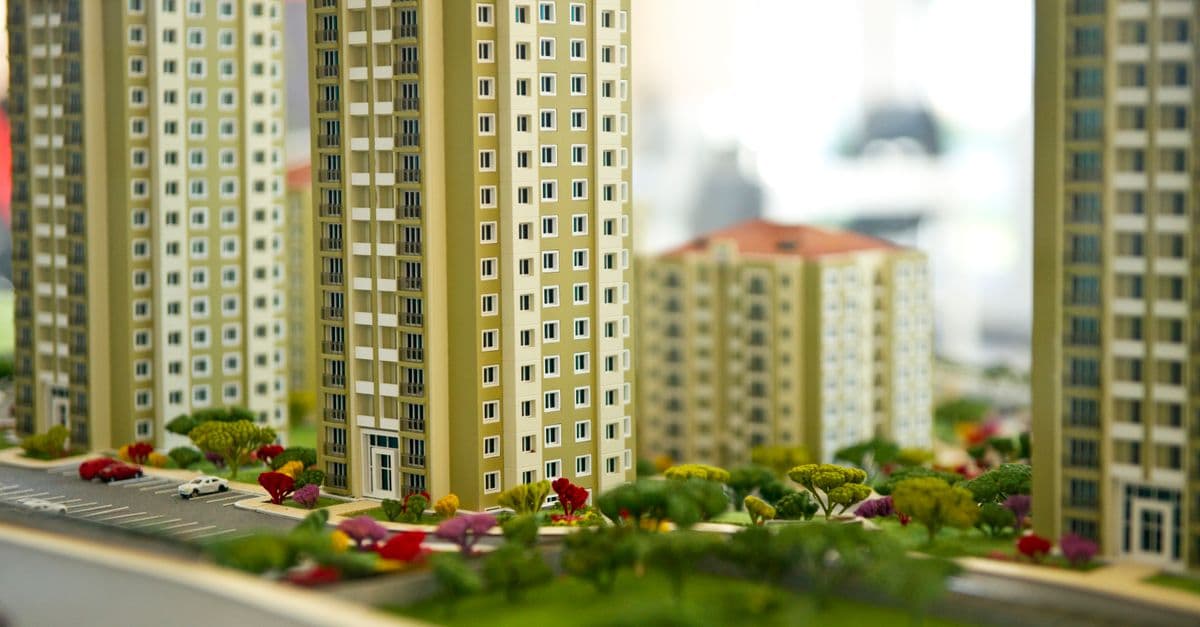
Global real estate was worth about $393.3 trillion at the start of 2025, and China and the United States hold nearly half of it. Annual investment is far smaller, near $840 billion. Here is how the rankings work, where the money goes, and what the data cannot tell you.

High household debt is not a complete risk ranking. This guide explains debt-to-income, debt-to-GDP, debt-service ratios, mortgage structure, household balance sheets and why the distribution of borrowing matters.

Homeownership rates are not a simple prosperity ranking. OECD and Eurostat data show how outright ownership, mortgages, renting, housing costs and historic policy produce very different housing outcomes.

There is no single universal cost-of-living ranking. This guide separates national price levels, expensive cities, housing affordability, food costs and wages using OECD, Eurostat, World Bank, ILO and EIU data.

Monaco packs about 18,500 people into each square kilometre of land, Singapore about 8,300 and Bangladesh about 1,330 — the densest country of any real size. World Bank 2024 data, ranked two ways, with what density does and does not tell you.