Countries with the Most Real Estate Investment (2026 Update)
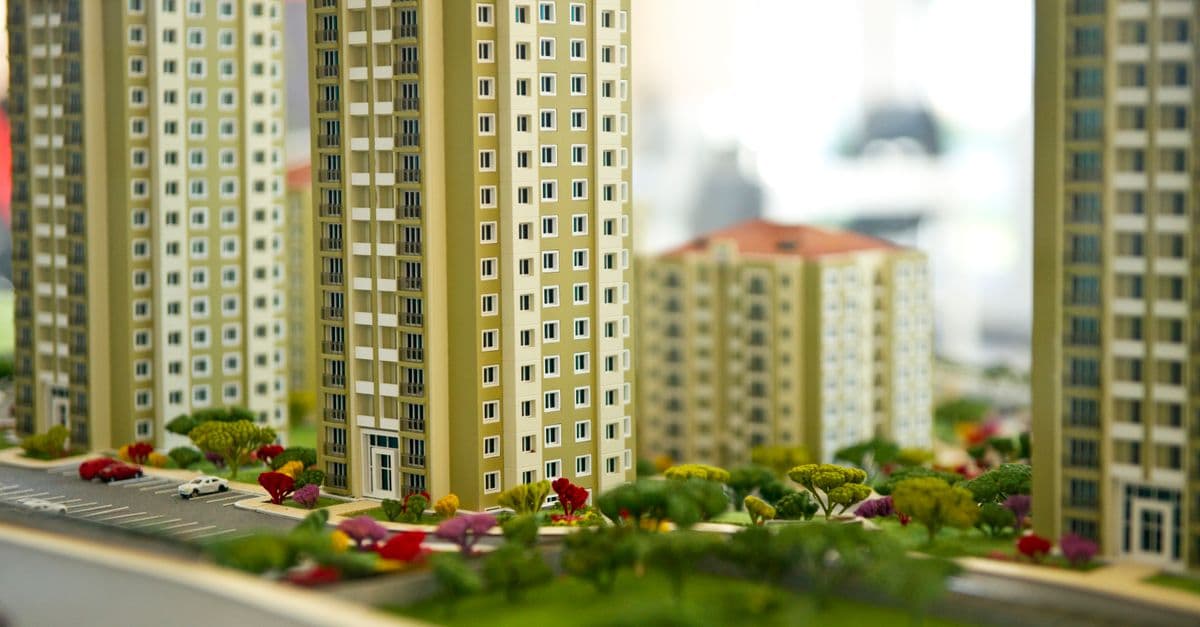
Photo: Engin Akyurt / Pexels
Property is the largest store of wealth on Earth. Savills Research valued all residential, commercial, and agricultural real estate at about $393.3 trillion at the start of 2025, and two countries, China at 23.5% and the United States at 20.7%, hold 44.2% of it. The amount that changes hands each year is much smaller, roughly $840 billion of commercial real estate deals in 2025, according to McKinsey. This article separates those two ideas, shows which countries lead on each, explains how China's slump and housing affordability fit in, and flags where the data are weak.
Educational only, not financial advice. Property investment involves risk of loss, including loss of borrowed money, and past performance does not guarantee future results. This article describes how markets are measured and does not recommend any purchase, fund, or strategy. Consult a licensed professional for personal decisions.
Key takeaways
- Global real estate was worth about $393.3 trillion at the start of 2025, per Savills, which exceeds the combined value of global equities, debt, and gold.
- China (23.5%) and the United States (20.7%) hold the largest shares of global property value. Japan, Germany, the United Kingdom, France, Canada, Australia, South Korea, and Italy complete the top 10, and the 10 together hold 71%.
- Institutionally managed commercial property was worth $13.5 trillion in 2025, according to MSCI, and the US market is larger than the next four combined.
- China's real estate development investment fell 17.2% in 2025, years after Evergrande's 2021 default, and the country's price declines pulled down global residential values in 2024.
- Housing affordability is strained in a few cities. Demographia's 2026 survey put Hong Kong at 14.1 times median household income and Sydney at 14.0.
How much real estate is there, and who owns it?
Start with a distinction that most rankings blur. Stock is the total value of all property that exists. Flow is the value that is bought and sold in a year. Think of a warehouse: its total value is the stock, and the pallets moved in and out this year are the flow. A country can have an enormous stock and a small flow if its owners rarely sell, which is common with homes, farmland, and government buildings.
Savills Research estimates the stock each year. At the start of 2025, residential property was worth $286.9 trillion, commercial property $58.5 trillion, and agricultural land $47.9 trillion. Total value fell 0.5% in 2024 because residential values dropped 2.7%, a decline Savills attributes mainly to falling prices in China. Over the five years since 2019, global real estate value grew 21.3%, slightly below the 25.6% growth in global GDP. Savills also puts all the gold ever mined at $20.2 trillion, a little over 5% of the property total.
| Rank | Market | Share of global real estate value (Savills, end-2024) |
|---|---|---|
| 1 | China | 23.5% |
| 2 | United States | 20.7% |
| 3 to 10 | Japan, Germany, United Kingdom, France, Canada, Australia, South Korea, Italy (in the order Savills lists them) | 71% combined for the top 10 |
Source: Savills Impacts, "How much is global real estate worth?" Savills does not give individual shares for ranks 3 to 10 on that page.
Rankings of national output appear in the largest economies by GDP. The property ranking differs because land and buildings accumulate over centuries, while GDP measures a single year of production.
Why is commercial property worth so much less than housing?
Residential property dominates because nearly everyone needs a home, and homes are numerous. Savills' commercial figure of $58.5 trillion includes less liquid buildings such as schools, civic buildings, and hospitals, not only assets held by investors. A narrower measure comes from MSCI, which reported that global commercial property managed by institutional investors for investment returns reached $13.5 trillion in 2025, up 8.5% and the first rise since 2021. The total covers 38 property markets, 35 of which grew in 2025, and much of the rise came from currency effects. Office buildings were 26.8% of the total and industrial property, including data centers, was 20.5%. MSCI noted that the US market is larger than the next four largest markets combined.
The gap between $58.5 trillion and $13.5 trillion is a reminder that "real estate" can mean very different things depending on what a source counts. The technology that drives industrial demand is covered in countries with the most data centers.
Which countries attract the most real estate investment?
Here is where honesty about data matters. No free, authoritative source publishes a single country-by-country table of 2025 commercial investment volumes. The main providers, including MSCI Real Capital Analytics, JLL, CBRE, Colliers, and Knight Frank, use different definitions, minimum deal sizes, and currency conversions, and the full datasets are behind paywalls. Older rankings of this kind that circulate online often mix domestic and foreign investment, include or exclude development sites, and treat China differently.
What the published summaries do show is consistent in outline.
| Source | What it measures | Reported finding |
|---|---|---|
| McKinsey research, as reported by Institutional Real Estate, Inc. | Global real estate deal value, 2025 | About $842 billion, up 10%, with the overall transaction count flat |
| Knight Frank Wealth Report 2026 | Buyer split, 2025 | Private capital (high-net-worth individuals and family offices) invested $464 billion and institutions $347 billion |
Sources: McKinsey research as reported by Institutional Real Estate, Inc. and Knight Frank data as reported by The Edge Malaysia. These are secondary reports of proprietary datasets, and totals differ by provider.
Two points emerge. First, the United States is the single largest market for professionally managed property, as MSCI's market-size data show, though the exact dollar figure for annual deals depends on the provider. Second, McKinsey reports that deal value rose in 2025 with the transaction count flat, which implies larger average deals.
Why do deal volumes swing so much?
Transaction volume is cyclical. When borrowing costs rise, buyers and sellers disagree about prices, and deals stall rather than prices adjusting immediately. The 2022 to 2024 slowdown across US and European markets showed this pattern, and deal value rose again in 2025. The mechanics of how rates reach property are in why interest rates affect everything, and the institutions that set them are in how central banks work.
Why does the United States dominate institutional property?
Three features help explain US leadership: scale, capital markets, and a century-old financial innovation.
How did REITs open property to ordinary investors?
A real estate investment trust (REIT) is a company that owns income-producing property and distributes most of its income to shareholders, usually receiving favorable tax treatment in exchange. REITs were created by the Cigar Excise Tax Extension Act of 1960, which President Dwight Eisenhower signed in September 1960 (Public Law 86-779). The REIT provision was added as an amendment to a bill extending a cigar tax, an unlikely origin for a trillion-dollar industry.
The idea was to let small investors own a share of a portfolio of buildings in the same way mutual funds let them own a share of a portfolio of stocks. According to Nareit, the US industry association, the FTSE Nareit All REITs index had an equity market capitalization of $1.439 trillion at the end of 2025, and REITs own more than $4.5 trillion of commercial real estate assets. For the broader family of funds that package assets for small investors, see ETFs explained.
What happens to property when interest rates rise?
Imagine a building as a bond with a roof. Its value is the stream of rent it will produce, discounted by the return investors could earn elsewhere. When yields on safe assets rise, buyers require higher returns from buildings, and prices fall unless rents rise to compensate. The same logic is behind how bond prices move with interest rates.
The US experienced this after 2022, when commercial property values fell from their 2022 peak, with offices hit hardest and some other sectors less so.
Can house prices fall nationally?
Yes, and the US has an example. The S&P Case-Shiller National index fell by roughly a third from its 2006 peak to its post-crisis low. That episode was central to the 2008 financial crisis. The dynamics of such downturns are in what causes recessions and how stock market crashes happen.
What happened to China's property market?
China matters more than any other single property market, because of its size and because so much of its economy is tied to construction. Savills gives China 23.5% of global real estate value. In a 2020 working paper, economists Kenneth Rogoff and Yuanchen Yang argued that a decades-long housing boom had produced severe price misalignments, and estimated that an adjustment in housing activity could trim a cumulative 5 to 10 percent from China's output over a period of years. The paper is available from the National Bureau of Economic Research.
How did developers get into trouble?
Large Chinese developers financed expansion by pre-selling apartments before they were built and borrowing heavily against future sales. The model works as long as buyers keep paying and prices keep rising. When sales slow, developers cannot finish old projects and cannot raise money for new ones, so debts accumulate faster than revenue.
China Evergrande defaulted on a dollar bond in December 2021, which spread fear through China's financial markets. A Hong Kong court ordered it to liquidate on January 29, 2024, with Judge Linda Chan citing the lack of progress on a viable restructuring proposal and the company's insolvency. Reports put its liabilities at more than $300 billion. Country Garden, a former top builder by sales, missed payments and defaulted in October 2023.
How large is the slump?
The National Bureau of Statistics reported that national real estate development investment in 2025 was 8.2788 trillion yuan, down 17.2% from 2024. Newly started construction floor space fell 20.4%, and sales of new commercial property floor area fell 8.7%. These figures come from official statistics, which cannot be independently verified in detail, so the true picture may differ.
The consequences reach beyond China. Savills says Chinese price falls were the main reason global residential value fell in 2024. They also affect households. Real estate is a large part of household wealth in many countries, so falling prices can reduce spending, a channel discussed in countries with the highest household debt.
Why is Dubai a magnet for property buyers?
Dubai's market grew quickly after 2020. According to the Dubai Land Department, total real estate transactions in 2025 exceeded 270,000 and were worth AED 917 billion, which is about $250 billion at the dirham's fixed exchange rate of 3.6725 per US dollar. In the first half of 2025 alone, transactions were worth about AED 431 billion, up 25% from a year earlier. A large share of residential sales are off-plan, meaning purchases of units before they are built. The totals above were published in a broker's press release based on Dubai Land Department data, so treat them as indicative.
Analysts cite population growth, new residency programs, a low-tax environment, and global capital looking for a politically stable destination as reasons. Public data do not break down buyers by nationality, so claims about where the money originates are estimates. Because off-plan purchases depend on continued confidence, the market is sensitive to a change in sentiment, the same vulnerability seen in China's pre-sale model on a different scale.
Sovereign wealth funds and other large institutions are also property buyers, which is covered in countries with the largest sovereign wealth funds. The conditions that attract international capital, such as clear property rights and reliable courts, are measured in countries with the most economic freedom.
Which cities are the least affordable?
Investment is one side of the property story, and affordability is the other. The Demographia International Housing Affordability survey compares the median house price with the median pre-tax household income in each market, producing a "median multiple." A multiple of 3 or below is classed as affordable, above 5 as severely unaffordable, and above 9 as "impossibly unaffordable." The 2026 edition used third-quarter 2025 data for 96 major markets in eight countries.
| Market | Median multiple (2026 edition) |
|---|---|
| Hong Kong | 14.1 |
| Sydney | 14.0 |
| San Jose, California | 11.3 |
| Adelaide | 11.2 |
| New York | 7.5 (16th) |
| London | 6.9 (tied 22nd with Seattle) |
Source: Demographia International Housing Affordability, 2026 edition, as reported by The Standard (Hong Kong).
Hong Kong has topped the list for 16 consecutive years, but its multiple has dropped sharply from 23.2 in 2021 because prices fell. Hong Kong's Rating and Valuation Department reported that private residential prices were 26% below their September 2021 peak at the end of September 2025, and about 20.5% below the peak by April 2026 after a rebound. Economists caution that the survey omits one reality: about one-third of Hong Kong residents live in public rental housing.
What drives expensive housing?
Several forces combine. Low borrowing costs between 2008 and 2022 let buyers bid prices up. Zoning rules and construction costs limit supply in popular cities. Population growth and migration concentrate demand. The full set of causes is covered in why housing is so expensive, and the cost of living in expensive cities is in countries with the highest cost of living. The share of households that own their homes varies widely, as shown in countries with the highest homeownership rates.
How do investors gain exposure to property?
The headline numbers hide several different ways of owning real estate, and each carries different costs and risks. The table describes the structures in general terms and is not a recommendation.
| Route | How it works | Typical trade-offs |
|---|---|---|
| Direct ownership | Buying a home, building, or land | Full control and tax and legal responsibilities, but large concentration in one asset and low liquidity |
| Listed REITs | Buying shares in a company that owns a portfolio of properties | Easy to buy and sell, but prices move with the stock market and can diverge from property values |
| Funds and ETFs | Pooled vehicles that hold REIT shares or property companies | Diversification and low minimums, with fees and market-price volatility |
| Private and institutional funds | Pension funds, insurers, and sovereign funds invest in property directly or through managers | Access to large assets, but long holding periods and valuation by appraisal |
MSCI's $13.5 trillion institutional universe is mostly the last row. Pension funds and insurers use property to match long-term liabilities with rental income, and pension systems around the world are among the largest of those investors. The mix between stocks, bonds, and property in a portfolio is discussed in asset allocation explained.
How should you read a country ranking of real estate investment?
Four questions help. Does the ranking measure total value (stock) or annual transactions (flow)? Does it count only commercial property, or homes and farmland too? Is the amount domestic, foreign, or both? And what currency and date does it use? A ranking that does not answer these questions cannot be compared with another one, which is the main reason this article reports several sources side by side instead of one league table.
What do investment rankings miss?
Rankings show where capital goes, not whether it earns a profit or whether a country is a good place to live. Five gaps matter.
Valuation lag. Property is valued by appraisal rather than daily trading, so recorded values can trail real conditions. When prices turn, reported indexes often move slowly at first and then catch up.
Leverage. Most property is bought with borrowed money, which magnifies both gains and losses. A 20% fall in value wipes out a buyer who put down 20%.
Illiquidity. A building cannot be sold in an instant, and in a downturn buyers may not exist at any acceptable price. That is why diversification matters, an idea covered in why diversification reduces risk.
Currency. Stock figures are converted to dollars, so a falling local currency can make a country appear poorer without any change in its buildings. MSCI noted that much of the 2025 rise in global institutional property value came from currency effects.
Data quality. Countries with transparent property registries produce reliable numbers, and others do not. China's official statistics are published but cannot be independently verified in detail, and capital controls limit foreign participation.
Frequently asked questions
Q: Which country has the most real estate?
A: By total value, China, with 23.5% of global real estate value at the end of 2024 according to Savills, followed by the United States at 20.7%. Japan, Germany, the United Kingdom, France, Canada, Australia, South Korea, and Italy complete the top 10, which together hold 71% of the total. Rankings by annual investment volume differ, with the United States leading institutional markets.
Q: What is the difference between commercial and residential real estate?
A: Commercial property, including offices, shops, warehouses, and hotels, is typically valued by the income it produces. Residential property, meaning homes and apartments, is typically valued by comparable sales. Savills estimated residential value at $286.9 trillion and commercial value at $58.5 trillion at the start of 2025.
Q: What is a REIT?
A: A real estate investment trust is a company that owns income-producing property and pays out most of its taxable income to shareholders. The structure was created in the United States in 1960 so that small investors could own a share of commercial property. The FTSE Nareit All REITs index had an equity market capitalization of $1.439 trillion at the end of 2025.
Q: Is a real estate bubble forming or bursting right now?
A: Evidence points in different directions by market. China's property investment fell 17.2% in 2025, and US office values fell sharply after 2022, while Dubai transactions hit records. A bubble is a situation in which prices rise on expectations of further increases rather than on income or fundamentals, and it is usually identified only in hindsight, so the label is best treated with caution.
Q: Can property prices fall nationally?
A: Yes. The Case-Shiller National index fell by roughly a third from its 2006 peak. Hong Kong's private residential prices fell 26% from September 2021 to September 2025. Declines tend to be uneven across cities and are often accompanied by sharply lower transaction volumes.
Q: How is housing affordability measured?
A: A common method is the median multiple, which divides the median home price by the median pre-tax household income. Demographia's 2026 survey found Hong Kong at 14.1 and Sydney at 14.0, against a threshold of 3 for "affordable." The measure ignores mortgage rates, public housing, and household wealth, so it simplifies a complicated picture.
The takeaway
The world holds about $393 trillion of real estate, and where it sits (China and the United States above all) says little about where today's money is flowing. Each year, roughly $840 billion of commercial property changes hands, led by deep markets such as the United States, while China's slump shows how a market that large can pull down global figures. The main lesson of the past few years is that property is a bet on interest rates and credit as much as on bricks, which is why prices in many places fell after borrowing costs rose and why affordability has become a political problem in a few large cities. When you see a ranking of countries by real estate investment, check what it counts, what date it uses, and whether it measures stock or flow.
Sources
- Savills, How much is global real estate worth? and Savills news release, $393.3 trillion.
- MSCI, Real Estate Market Size, August 2026.
- Rogoff and Yang, Peak China Housing, NBER Working Paper 27697, 2020.
- China National Bureau of Statistics, 2025 real estate data, reported by SteelOrbis.
- Demographia International Housing Affordability, 2026 edition, as reported by The Standard.
- Nareit, REIT industry fact sheet, December 2025; Dubai Land Department figures via Zawya.
- McKinsey research via Institutional Real Estate, Inc. and Knight Frank data, as cited in the text.
Related Reading
Follow new articles
Add SciHub101 to your feed reader to see new science and technology stories.
About the Author
SciHub101 is an independent science and technology publication founded and edited by Buğra Sözeri, a software engineer and app developer based in Türkiye. AI tools assist with drafting and research. Source documentation in the existing archive is uneven, and articles are being reviewed and corrected. The Editorial Team byline identifies editorial responsibility; it does not certify specialist or independent human review. Where we compare products, anything built by our own team is labelled as such — see the editorial guidelines and About page for how corrections and disclosures work.
Related Articles
Countries With the Highest Income Inequality: How the Data Should Be Read
Income inequality rankings depend on the Gini definition, survey year and whether income is measured before or after taxes and transfers. This guide separates income, wealth, poverty and human-development inequality.
How Inflation Works: The Economics Explained
Inflation is not simply prices rising — it's the purchasing power of money quietly eroding. Here's how it actually works.
Why Housing Is So Expensive
Housing prices rise when land, zoning, interest rates, construction costs, income, speculation, and supply constraints collide.
The Real Economics of Real Estate Investing
Property is the world's largest asset class. Real estate sells well as "passive income" — the reality is more complicated, more profitable in some ways, less so in others.

Countries with the Highest Purchasing Power (Ranked 2025)
Luxembourg tops the world in purchasing power per capita at approximately $127,674 nominal GDP — but by purchasing power parity, Switzerland, Singapore, Norway, and the United States compete closely for the positions that matter most to daily living standards. This ranking covers the top 15 countries by Numbeo's Local Purchasing Power Index 2025, cross-referenced with IMF PPP GDP per capita, with methodology, caveats, and an explanation of why nominal wealth and real purchasing power so often diverge.
Countries with the Most Venture Capital Investment (2025 Ranked)
The United States attracts over $150 billion in venture capital annually — more than the rest of the world combined. China is a distant second. Israel is the world's highest VC-to-GDP ratio nation. Here's the full venture capital ranking — and why the geography of startup funding determines where tomorrow's industries are built.