Countries with the Most Data Centers (2025 Ranked)

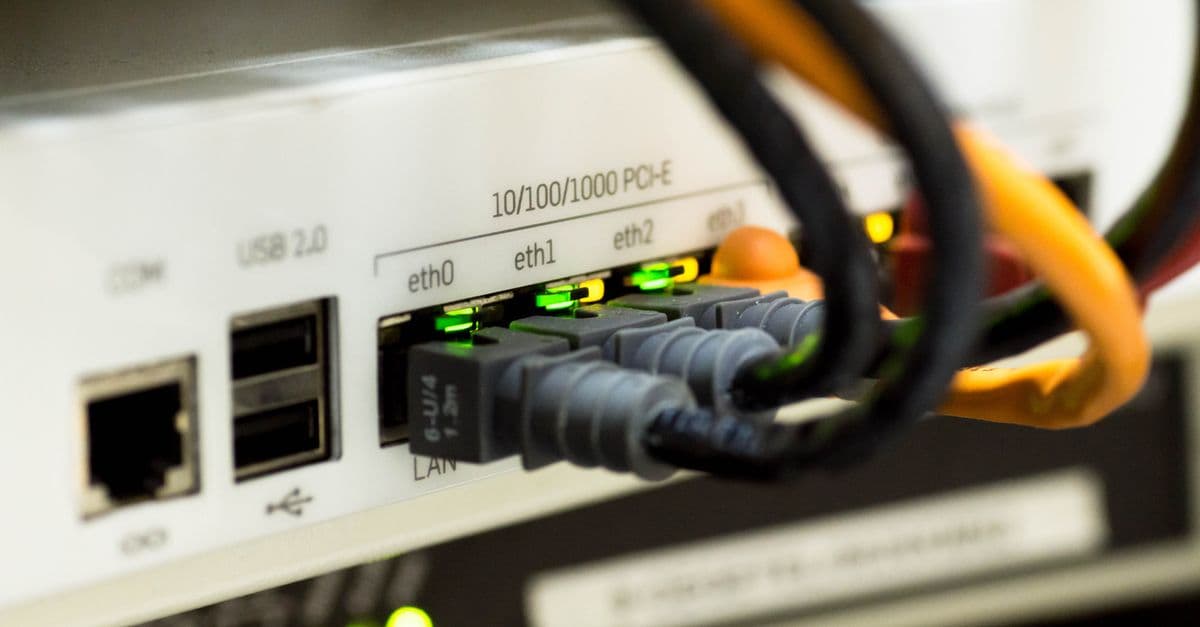
Photo: Christina Morillo / Pexels
Data centers are buildings full of servers, storage and networking equipment, and they are the physical layer beneath everything people call "the cloud." Every search, video stream, payment and AI query is processed in one somewhere. Counting them sounds simple. It is not.
There is no official global register of data centers. Every ranking you see comes from a commercial database, and each database decides for itself what counts as a data center, which operators it tracks, and how often it updates. That is why the United States can appear with about 3,750 data centers in one ranking and about 5,400 in another published within months. Both can be honest; they are counting different things.
This page gives the facility-count ranking from the most widely cited database, shows how a second database differs, and then turns to the measure that matters more for energy and policy: electricity. Every figure carries its source and date. An earlier version of this page included power figures, global-share percentages and claims about internet traffic that we could not trace to a primary source; those have been removed. For the mechanics of how these buildings draw power, see our explainer on how AI data centers use electricity.
Key takeaways
- The United States leads every count. Cloudscene's November 2025 data lists 5,427 US data centers; a Data Center Map-based ranking from May 2025 lists 3,757.
- After the US, Germany (529), the UK (523) and China (449) lead Cloudscene's November 2025 list.
- Facility counts and capacity are different things. The IEA estimates data centres used 415 TWh of electricity in 2024, about 1.5% of world consumption, with the US at 45%, China 25% and Europe 15%.
- In Ireland, data centres used 22% of metered electricity in 2024, up from 5% in 2015, according to the Central Statistics Office.
- In the US, Lawrence Berkeley National Laboratory estimates data centers used 176 TWh in 2023, about 4.4% of national electricity, and could reach 6.7–12% by 2028.
Why Data Center Counts Disagree
Before the ranking, it is worth understanding why two reputable sources can be 1,500 facilities apart on the same country.
What counts as a facility. Some databases count every listed building, including small colocation suites inside office blocks. Others count campuses, where several buildings on one site are one entry. Hyperscale operators such as Amazon, Microsoft and Google often build campuses of many buildings; counting buildings or campuses can change a country's total by hundreds.
Who is tracked. Commercial databases are strongest on colocation providers, the companies that rent space, power and cooling to other businesses, because those firms want to be listed. They are weaker on private enterprise data centers inside banks, hospitals and governments, and on hyperscale sites whose owners do not publish details. A country with many self-built hyperscale or state facilities will be undercounted.
Geography of reporting. Coverage of China, Russia and parts of the Middle East is generally thinner in Western databases. China's place in facility rankings, around fourth, is hard to square with the IEA's estimate that China accounts for a quarter of global data centre electricity use. The most likely explanation is that Chinese facilities are both larger on average and less completely listed, though no database states this directly.
Date. These databases update continuously. A figure without a date is close to meaningless; the totals below are given with the month they refer to.
Count versus capacity. A 1 MW server room in a city basement and a campus drawing hundreds of megawatts each count as one entry. For questions about energy, water, grid planning or AI, megawatts or terawatt-hours are the useful unit, not the number of buildings.
| Measure | What it tells you | Typical source | Main weakness |
|---|---|---|---|
| Facility count | How many listed sites exist | Cloudscene, Data Center Map | Treats tiny and huge sites the same; undercounts private and some national markets |
| IT capacity (MW) | How much server power can be installed | Commercial market research, operator disclosures | Different definitions (IT load vs total site power); often paywalled |
| Electricity use (TWh/year) | Actual energy consumed | IEA, national statistics offices, grid operators | Usually estimated; few countries meter data centres directly |
| Share of national electricity | Grid impact | National statistics (e.g. Ireland CSO), LBNL in the US | Only a handful of countries publish it |
Ranking: Countries by Number of Data Centers
The table uses Cloudscene's count as compiled in November 2025 and reported by the logistics platform Cargoson in a ranking last updated in January 2026. Cloudscene is a directory of data centers, cloud providers and network operators that is widely used for these comparisons. Rank 15 is a tie.
| Rank | Country | Data centers | Source and date |
|---|---|---|---|
| 1 | United States | 5,427 | Cloudscene, November 2025 (via Cargoson) |
| 2 | Germany | 529 | Cloudscene, November 2025 (via Cargoson) |
| 3 | United Kingdom | 523 | Cloudscene, November 2025 (via Cargoson) |
| 4 | China | 449 | Cloudscene, November 2025 (via Cargoson) |
| 5 | Canada | 337 | Cloudscene, November 2025 (via Cargoson) |
| 6 | France | 322 | Cloudscene, November 2025 (via Cargoson) |
| 7 | Australia | 314 | Cloudscene, November 2025 (via Cargoson) |
| 8 | Netherlands | 298 | Cloudscene, November 2025 (via Cargoson) |
| 9 | Russia | 251 | Cloudscene, November 2025 (via Cargoson) |
| 10 | Japan | 222 | Cloudscene, November 2025 (via Cargoson) |
| 11 | Brazil | 197 | Cloudscene, November 2025 (via Cargoson) |
| 12 | Mexico | 173 | Cloudscene, November 2025 (via Cargoson) |
| 13 | Italy | 168 | Cloudscene, November 2025 (via Cargoson) |
| 14 | India | 153 | Cloudscene, November 2025 (via Cargoson) |
| 15= | Poland | 144 | Cloudscene, November 2025 (via Cargoson) |
| 15= | Spain | 144 | Cloudscene, November 2025 (via Cargoson) |
Seen this way, the US has more listed data centers than the next fifteen countries combined. Add up ranks 2 to 16 and you get about 4,224, well short of the US total.
How a second database compares
A ranking from the research site IntelPoint, based on Data Center Map data as of May 2025, gives much lower totals for the leaders:
| Country | Cloudscene (Nov 2025) | Data Center Map (May 2025, via IntelPoint) | Difference |
|---|---|---|---|
| United States | 5,427 | 3,757 | 1,670 |
| Germany | 529 | 443 | 86 |
| United Kingdom | 523 | 428 | 95 |
The order of the top three is identical in both sources, which is the robust finding. The absolute numbers are not. IntelPoint describes the US figure as "more than 8×" any other country in its top ten. The same IntelPoint data put South Africa, the largest African market, 36th with 49 data centers in May 2025.
The practical lesson: quote the ranking order with confidence, quote the exact totals only with their source and month, and never compare a Cloudscene number for one country with a Data Center Map number for another.
The Better Measure: Electricity
The International Energy Agency's Energy and AI report is the most authoritative global estimate of data centre energy use. Its main findings, from the executive summary:
- Data centres used about 415 TWh of electricity in 2024, around 1.5% of global electricity consumption.
- Consumption has grown by about 12% a year since 2017, more than four times faster than total electricity demand.
- The United States accounted for 45% of the 2024 total, China 25% and Europe 15%.
- In the IEA's Base Case, data centre use more than doubles to around 945 TWh by 2030, slightly more than Japan's total electricity consumption today. The US accounts for the largest share of the increase, followed by China.
- The Base Case reaches about 1,200 TWh by 2035, with a range across scenarios of 700 to 1,700 TWh.
- A typical AI-focused data centre, the IEA notes, uses as much electricity as about 100,000 households.
| Region | Share of global data centre electricity, 2024 | Approx. TWh (derived) | Source |
|---|---|---|---|
| United States | 45% | ~187 | IEA, Energy and AI (2025) |
| China | 25% | ~104 | IEA, Energy and AI (2025) |
| Europe | 15% | ~62 | IEA, Energy and AI (2025) |
| Rest of world | ~15% | ~62 | Derived from IEA shares |
| World | 100% | 415 | IEA, Energy and AI (2025) |
The TWh column multiplies the IEA's shares by its 415 TWh total and is rounded; the IEA itself reports the shares.
This table changes the picture. By facility count, China looks like a mid-sized market with a twelfth of America's data centers. By electricity, it is clearly the world's second-largest data centre country, using more than half as much as the US. Europe's many listed facilities add up to only 15% of the world's data centre electricity. Note too that the old figure on this page, 240 TWh in 2022, was an earlier IEA estimate; the 2025 report's revised 415 TWh for 2024 supersedes it.
United States: 4.4% of national electricity
The US Department of Energy commissioned Lawrence Berkeley National Laboratory (LBNL) to estimate domestic data center demand. Its December 2024 report found that US data centers used about 176 TWh in 2023, roughly 4.4% of total US electricity, up from 58 TWh in 2014. LBNL projected 325 to 580 TWh by 2028, or 6.7% to 12% of US electricity, depending on how fast AI servers are deployed and how the rest of the economy grows. LBNL's 176 TWh is close to the ~187 TWh implied by the IEA's US share for 2024, given that demand grew between those years.
Ireland: a fifth of national metered electricity
Ireland is one of very few countries whose statistics office measures data centre electricity directly from meters. The Central Statistics Office (CSO) examined around 2.5 million electricity meters to identify connections used primarily for data centre activity. Its 2024 release found:
| Year | Data centre metered electricity | Share of total metered electricity | Source |
|---|---|---|---|
| 2015 | — | 5% | CSO, Data Centres Metered Electricity Consumption 2024 |
| 2023 | 6,335 GWh | 21% | CSO |
| 2024 | 6,969 GWh | 22% | CSO |
For comparison, urban households used 18% of metered electricity in 2024 by the same measure, so Irish data centres now use more electricity than all urban homes combined. Ireland's attraction for US technology companies dates back decades, and it has become a major European location for hyperscale cloud. Between 2023 and 2024, the CSO found data centre consumption rose 10% while consumption by all other metered users rose about 3%.
Where the Data Centers Cluster
Northern Virginia: the densest cluster on Earth
Loudoun County, Virginia, home to Ashburn, is the best-documented data center cluster anywhere because the county publishes its own figures. As of 1 March 2026, Loudoun counted about 233 existing data center buildings, built or under construction, totalling about 56.5 million square feet. A further 35.7 million square feet was approved but not yet built, which the county estimates could mean roughly 115 more buildings. The county issued permits for more than 10 million square feet in 2025, its highest one-year total.
The cluster's origins go back to 1992, when the MAE-East internet exchange was set up in nearby Vienna, Virginia, making the region a natural meeting point for networks. Data centers now produce a large share of local revenue: Loudoun expected about $1.2 billion in real and personal property tax from data centers in fiscal 2026, about 39% of its budget. A claim often repeated online, that most of the world's internet traffic flows through Ashburn, does not appear in the county's own material and we have not found a primary source for it.
Germany and the Netherlands: Europe's exchange hubs
Germany (529 in Cloudscene's count) and the Netherlands (298) owe much of their data center density to large internet exchange points in Frankfurt and Amsterdam, where networks interconnect. Data centers cluster near exchanges because proximity cuts latency and the cost of connecting to many networks. For how traffic moves between networks, see how the internet actually works. Germany's 2025 Digital Decade report also counts edge computing nodes (an estimated 652 in 2024, up from 358), an emerging category of small, distributed facilities that sit closer to users.
United Kingdom: London's financial and cloud market
The UK ranks third by Cloudscene's count, with 523 facilities. London's financial sector, with its demand for low-latency trading and strict data-residency needs, was an early driver, and the region later attracted hyperscale cloud regions. The gap between the two databases (523 vs 428) is smaller in relative terms than for the US, which suggests most UK facilities are commercial colocation sites that both databases track.
Singapore: a moratorium and a reset
Singapore is a case study in how land and power limits shape data center geography. A de facto moratorium on new large-scale data centre approvals ran from 2019 to 2022. When it ended, the Infocomm Media Development Authority (IMDA) and the Economic Development Board (EDB) ran a pilot call for applications targeting about 60 MW of new capacity, and by 2023 about 80 MW had been awarded to four operators. IMDA's 2024 Green Data Centre Roadmap committed to adding at least 300 MW more in the near term under stricter sustainability conditions, and in October 2025 the government announced land on Jurong Island set aside for data centres. The episode showed that, on a small island, grid capacity rather than demand sets the ceiling on data centre growth.
China: undercounted by facility databases
With 449 facilities in Cloudscene's list but a quarter of global data centre electricity in the IEA's estimate, China is the clearest case of facility counts understating a market.
Why Data Centers Locate Where They Do
Across all these markets, the same factors recur:
- Power. Availability of large grid connections is now the binding constraint in many hubs, including Dublin, Amsterdam, Singapore and parts of Northern Virginia. Price matters too, but a megawatt you cannot connect is worth nothing.
- Network connectivity. Proximity to internet exchanges and submarine cable landings lowers latency and interconnection costs. Our explainer on fibre-optic cables covers the physical links involved.
- Customers and regulation. Data protection rules and data-residency requirements push companies to keep certain data inside particular jurisdictions, which keeps demand local.
- Land and water. Large campuses need space, and evaporative cooling uses water. Cooler climates allow more "free cooling" with outside air.
- Tax and planning. Local tax incentives, zoning and permitting speed can make one county far more attractive than its neighbour, as Loudoun shows.
The AI Factor
The IEA identifies artificial intelligence as the most important driver of projected growth in data centre electricity, alongside other digital services. AI training and inference run on dense racks of accelerators, mostly GPUs, which draw far more power per rack than traditional servers and often need liquid cooling. Our guide to how GPUs work and why AI needs them explains why these chips concentrate so much power.
The shift to AI also changes what a "data center" is. A single AI campus can draw as much power as a city district, so the old practice of counting buildings becomes even less informative. Expect future rankings to move toward capacity in megawatts and actual consumption in terawatt-hours, and expect countries with spare grid capacity and cheap clean power to gain share.
For the most extreme examples, see our list of the largest data centers in the world. For how cloud platforms turn this infrastructure into rentable services, see cloud computing explained.
Environmental Questions
Electricity and emissions. Data centres' 1.5% share of global electricity is modest, but concentrated: in Ireland it is 22% of metered demand. Emissions depend on the local grid mix. The same server running in a hydro-powered grid and a coal-heavy grid can have very different carbon footprints.
Water. Many data centers use evaporative cooling, which consumes water, especially in hot weather, and that matters most in regions already facing water scarcity. Operators increasingly report water use and adopt air or liquid cooling designs that reduce it, but published figures vary so widely by site and climate that a single "litres per kWh" number is not meaningful. The earlier version of this page gave one; we removed it because we could not source it.
Grid planning. The bigger near-term issue is local: large new loads arriving faster than transmission lines and power plants can be built. That is the common thread linking Singapore's moratorium, Ireland's 22% share and Northern Virginia's rapid build-out.
Common Misconceptions
"The US has a third of the world's data centers." By Cloudscene's November 2025 count, the US has more listed facilities than the next fifteen countries combined. But because global totals depend on what is counted, a precise global share is hard to state. The IEA's electricity share, 45% for the US in 2024, is a firmer number.
"China has relatively few data centers." Facility databases list fewer Chinese sites than German or British ones, but the IEA estimates China uses a quarter of global data centre electricity. China is the second-largest market by energy.
"Data centers use 2% of world electricity." The IEA's latest estimate is about 1.5% in 2024. The share is rising, and the IEA expects consumption to more than double by 2030.
"More data centers means a better digital economy." Many smaller facilities can mean a fragmented market. What matters for users is latency, capacity and resilience, which depend on networks and power more than on the number of buildings.
Frequently Asked Questions
Q: Which country has the most data centers? A: The United States, by every major database. Cloudscene's November 2025 data lists 5,427 US data centers, more than the next fifteen countries combined. A Data Center Map-based ranking from May 2025 lists 3,757. The totals differ because the databases count facilities differently.
Q: How many data centers does Germany have? A: Cloudscene's November 2025 data lists 529, which places Germany second in the world by facility count. Data Center Map data from May 2025 lists 443. Frankfurt's internet exchange is a major reason for the concentration.
Q: How much electricity do data centers use worldwide? A: The IEA estimates about 415 TWh in 2024, around 1.5% of global electricity consumption. Its Base Case projects around 945 TWh by 2030 and about 1,200 TWh by 2035, with AI the main driver of growth.
Q: Which country's data centers use the most electricity? A: The United States, with about 45% of global data centre electricity in 2024 according to the IEA, followed by China at 25% and Europe at 15%. Lawrence Berkeley National Laboratory estimates US data centers used 176 TWh in 2023, about 4.4% of US electricity.
Q: Why do data centers use so much electricity in Ireland? A: Ireland hosts a large share of European cloud infrastructure relative to its small population. The Central Statistics Office found data centres used 6,969 GWh in 2024, 22% of all metered electricity, more than all urban households combined.
Q: Why did Singapore stop building data centers? A: Singapore paused approvals for new large-scale data centres from 2019 to 2022 because of land and power constraints. It then reopened through a pilot that awarded about 80 MW to four operators by 2023, and its 2024 Green Data Centre Roadmap plans at least 300 MW more.
Q: Why do different websites give different data center counts? A: There is no official global register. Commercial databases such as Cloudscene and Data Center Map decide what counts as a facility, which operators to track and how often to update. Comparing figures from different databases, or different dates, produces apparent contradictions.
Sources
- International Energy Agency, Energy and AI, executive summary (2025): https://www.iea.org/reports/energy-and-ai/executive-summary
- Central Statistics Office (Ireland), Data Centres Metered Electricity Consumption 2024, key findings: https://www.cso.ie/en/releasesandpublications/ep/p-dcmec/datacentresmeteredelectricityconsumption2024/keyfindings
- Lawrence Berkeley National Laboratory, "Berkeley Lab Report Evaluates Increase in Electricity Demand from Data Centers" (January 2025): https://newscenter.lbl.gov/2025/01/15/berkeley-lab-report-evaluates-increase-in-electricity-demand-from-data-centers/
- Loudoun County, "Data Centers: The Loudoun Story": https://www.loudoun.gov/6408/Data-Centers-The-Loudoun-Story
- Cargoson, "Number of data centers by country" (Cloudscene data, November 2025): https://www.cargoson.com/en/blog/number-of-data-centers-by-country
- IntelPoint, "The United States of America hosts over 3,700 data centres" (Data Center Map data, May 2025): https://intelpoint.co/insights/the-united-states-of-america-hosts-over-3700-data-centres-8x-more-than-any-other-country-as-of-may-2025
- Reed Smith, "Singapore's data centre expansion" (November 2025): https://www.reedsmith.com/articles/singapores-data-centre-expansion-jurong-island-sustainable-growth/
Related Reading
Follow new articles
Add SciHub101 to your feed reader to see new science and technology stories.
About the Author
SciHub101 is an independent science and technology publication founded and edited by Buğra Sözeri, a software engineer and app developer based in Türkiye. AI tools assist with drafting and research. Source documentation in the existing archive is uneven, and articles are being reviewed and corrected. The Editorial Team byline identifies editorial responsibility; it does not certify specialist or independent human review. Where we compare products, anything built by our own team is labelled as such — see the editorial guidelines and About page for how corrections and disclosures work.
Related Articles

History of Aviation: From the Wright Brothers to Today
On December 17, 1903, Orville Wright flew 120 feet in 12 seconds. In 2024, airlines carried about 4.7 billion passengers. Here is how the engineering got from one to the other.

Countries with the Most Internet Users (2026 Ranked)
China has 1.09 billion internet users — the largest national online population on Earth. India is close behind at 920 million, with the fastest growth. The US (315M), Indonesia (220M), and Brazil (190M) round out the top 5. By 2026, 5.5 billion people — 67% of humanity — are online. Here's the full ranking and what it means.
Countries with the Fastest Internet Speeds (Fixed Broadband Ranked)
The United Arab Emirates leads the world with a median fixed broadband download speed of 413.2 Mbps — more than four times the global average of roughly 90 Mbps. High urbanization rates, state-backed fiber rollout programs, and competitive telecoms markets are the common threads running through every country at the top of the Ookla Speedtest Global Index 2024.
How Google DeepMind Uses AI to Cut Data Center Energy Consumption
DeepMind's reinforcement learning system cut Google's data center cooling energy by 40%—a case study in applying AI to climate-critical infrastructure.

How the Internet Actually Works
Undersea cables, packets, IP addresses, routers, DNS and encryption: the engineering that moves every click from your device to a server and back in a fraction of a second.

How Does the Internet Actually Work? From Your Click to a Server and Back
When you load a web page, dozens of systems coordinate across continents in milliseconds. Here's exactly what happens — DNS, TCP/IP, routers, packets, and the cables under the ocean.