Countries With the Most Satellites in Orbit (2026 Data)
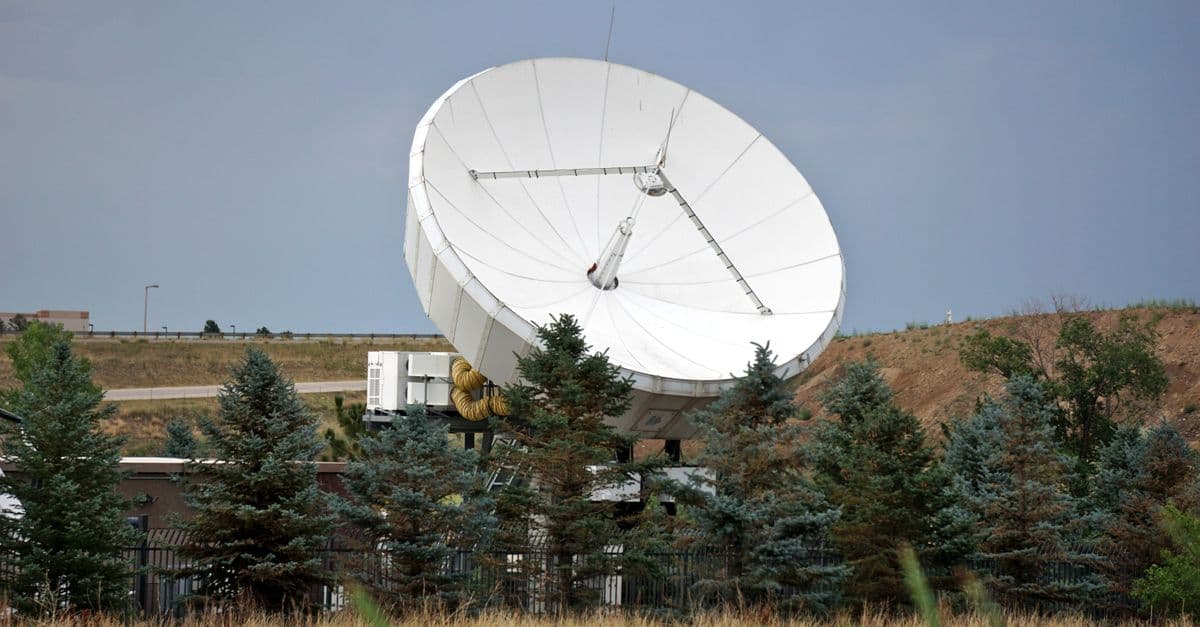
Photo: Joshua Brown / Pexels
On October 12, 2026, Jonathan McDowell's public tracking pages counted 16,988 active satellites around Earth. Of those, 11,114 were Starlink spacecraft built and launched by the American company SpaceX. That one constellation explains why the United States tops every satellite ranking, why China's fleet looks modest beside it, and why "which country has the most satellites?" has no single clean answer. Below are four different counts, the places where they disagree, and what each one actually measures.
Key takeaways
- The United States leads every count: 15,677 of the 24,865 objects in the UN-based launch registry through 2025 (about 63%), and 5,184 of 7,560 active satellites in the last Union of Concerned Scientists snapshot, from May 2023.
- Starlink alone was 11,114 of the 16,988 active satellites on October 12, 2026, roughly 65%. The frequently repeated claim that it makes up 85% of the fleet does not match that tally.
- China is far behind in cumulative launches (1,759) but launched 374 objects in 2025, and it is building two national mega-constellations, Guowang and Qianfan.
- Russia's 3,914 registered objects are mostly history. It launched 89 objects in 2025, and the Union of Concerned Scientists listed 181 active Russian satellites in 2023.
- The European Space Agency estimated about 11,000 active satellites among roughly 40,000 tracked objects at the end of 2024, so every new launch also tightens the debris problem.
How many satellites are in orbit right now?
Three words get used interchangeably in satellite headlines, and they are not the same. A satellite is "launched" if it ever left the ground, even if it burned up years ago. It is "in orbit" if it is still up there, working or dead. It is "active" if it is still doing its job. Most of the confusion in satellite rankings comes from mixing these three.
The most current count of active satellites comes from McDowell's open statistics pages, last read for this article with data as of October 12, 2026. They list 16,988 active satellites. Of those, 11,114 are Starlinks, 3,644 are other active satellites that can maneuver, and 2,229 are active satellites that cannot change their orbits, which is typical of small, low-cost spacecraft without propulsion. Take Starlink out and about 5,900 active satellites remain for the entire rest of the world, commercial and government combined.
For scale, the European Space Agency's Space Environment Report 2025, which covers data through the end of 2024, put active satellites at about 11,000 and the total number of tracked objects in Earth orbit at about 40,000. In other words, roughly one tracked object in four is a working spacecraft. The rest are dead satellites, spent rocket stages, and fragments large enough to follow with radar.
Four ways to count, and why they disagree
No single organization has a complete, audited list. Each of the main sources answers a slightly different question, which is why a blog post quoting "10,000 satellites" and another quoting "17,000" can both be citing real data.
| Source | What it counts | Data date | Headline figure |
|---|---|---|---|
| McDowell's statistics pages | Active satellites, by type | October 12, 2026 | 16,988 (11,114 Starlink) |
| Union of Concerned Scientists (UCS) Satellite Database | Operating satellites, curated from open sources | Through May 1, 2023 (updates paused) | 7,560 |
| ESA Space Environment Report 2025 | Active payloads, and all tracked objects | End of 2024 | About 11,000 active; about 40,000 tracked |
| UN Office for Outer Space Affairs registry, via Our World in Data | Objects registered by launching state, cumulative | Through 2025 (updated February 25, 2026) | 24,865 |
The UCS database deserves a flag. It was long the standard reference for "who owns what," because staff assembled it by hand with 28 data fields per satellite, including purpose, owner, operator, and builder. But the page states that updates are paused and the data runs only through May 1, 2023. It is now a benchmark for 2023, not a live ranking.
The UN registry is different in kind. It records what states report under the Registration Convention, so it measures launches, not working satellites. Our World in Data, which processes the registry, notes that the UN estimates national registers cover about 88% of all launched objects. Launches carried out by one country on behalf of another are credited to the country the launch was made for, and joint launches appear in each participant's series but only once in the world total. That last rule means the country rows in the registry cannot be added up cleanly to reach the world figure.
The ranking: objects launched by country, 1957 to 2025
If you want one list that runs across the whole space age, the UN registry is the best public option. Our World in Data's cumulative series covers 1957 through 2025.
| Rank | Country or agency | Objects launched, cumulative to 2025 | Share of world total |
|---|---|---|---|
| 1 | United States | 15,677 | 63.0% |
| 2 | Russia | 3,914 | 15.7% |
| 3 | China | 1,759 | 7.1% |
| 4 | United Kingdom | 807 | 3.2% |
| 5 | Japan | 384 | 1.5% |
| 6 | France | 200 | 0.8% |
| 7 | India | 163 | 0.7% |
| 8 | Germany | 158 | 0.6% |
| 9 | European Space Agency | 115 | 0.5% |
| World | 24,865 | 100% |
Source: UNOOSA Online Index of Objects Launched into Outer Space, processed by Our World in Data, updated February 25, 2026. Shares are our arithmetic on those figures.
A cumulative count works like the number of cars ever registered in a city. It tells you about history and industrial capacity, but not what is on the road today. Russia's 3,914 appears to include the Soviet era, since the dataset starts in 1957, and most of those spacecraft are long gone. The United Kingdom's 807 is a similar caution in a different direction: it is a surprising fourth place for a country with a small national space program, and it is consistent with the large OneWeb constellation, discussed below, being registered to the UK.
Who launched the most in 2025?
The same registry has a year-by-year series. For 2025 the picture is much more lopsided than the all-time table.
| Country or agency | Objects launched in 2025 | Share of 4,510 world total |
|---|---|---|
| United States | 3,708 | 82.2% |
| China | 374 | 8.3% |
| Russia | 89 | 2.0% |
| Japan | 30 | 0.7% |
| France | 25 | 0.6% |
| Germany | 20 | 0.4% |
| United Kingdom | 10 | 0.2% |
| India | 7 | 0.2% |
| European Space Agency | 6 | 0.1% |
Source: UNOOSA via Our World in Data, 2025 series. Shares are our arithmetic.
Two comparisons stand out. First, 4,510 objects in a single year is about 18% of the 24,865 launched across all of history. Second, the US launched 3,708 objects in 2025, nearly a quarter of everything it has ever registered. China's 374 is about 21% of its all-time total, so both leaders are accelerating, but the US is accelerating from a much larger base and at roughly ten times China's annual pace.
The active fleet: what the trackers show
Launch counts include satellites that have since burned up or died. For a ranking of what is working, the best country-level snapshot remains the UCS data from May 1, 2023.
| Country | Operating satellites (UCS, May 1, 2023) | Share of 7,560 |
|---|---|---|
| United States | 5,184 | 68.6% |
| China | 628 | 8.3% |
| Russia | 181 | 2.4% |
| All other countries | 1,572 | 20.8% |
The four rows add to 7,565, five more than the database's stated total of 7,560, a small mismatch on the source page.
Compare that with the McDowell total of 16,988 in October 2026. The two use different methods, so the ratio, about 2.2 times, is not a clean growth rate. But the direction is not in doubt, and almost all of it is Starlink: the constellation by itself, at 11,114, is larger than the entire UCS count of 7,560 from three years earlier.
A fair reading is that the United States leads in two separate ways. It has the most government and military spacecraft of any country, and it hosts the largest commercial operator by a wide margin. China is second in both registry lists, with Russia third by cumulative history but with a much smaller active fleet.
Why "which country?" is harder than it looks
Attributing a satellite to a country sounds simple and is not. There are at least four plausible definitions: the country that launched it, the country that registered it with the United Nations, the country where the operator is headquartered, and the country whose owners control it. Most satellites satisfy all four with the same answer. The big commercial constellations do not.
OneWeb is the clearest example. It went through Chapter 11 bankruptcy in the United States, filing on March 27, 2020. A consortium of India's Bharti Global and the UK government bought it, with the sale closing in November 2020. Eutelsat, a French-led operator, then merged with it, a deal the company announced as complete in September 2023. The resulting Eutelsat Group has offices in Paris, London, and Virginia. Depending on whether you follow the registry, the owners, or the headquarters, OneWeb's roughly 650 satellites are British, Indian, French, or international. McDowell's constellation list shows 660 OneWeb satellites launched against 588 planned, and 636 operational, with the gap between launched and planned reflecting replacements.
Launching on behalf of others adds another wrinkle. The UN registry credits a launch to the country it was made for, so a Falcon 9 carrying a Canadian or Japanese satellite does not inflate the American count. For commercial rideshares, ownership can shift again after launch. When you read a ranking, ask which of the four definitions it uses.
Starlink: one constellation, most of the fleet
Starlink is operated by SpaceX, and its scale is the single most important fact in current satellite statistics. Two test satellites flew in February 2018, and the first 60 operational Starlinks launched on May 24, 2019. The Federal Communications Commission approved an initial 4,425 satellites in March 2018 and, on December 1, 2022, authorized the first 7,500 second-generation satellites across three shells at 525, 530, and 535 kilometers altitude.
By June 2026 the network had approximately 10,413 satellites in orbit, 10,397 of them operational, according to the figures summarized on Wikipedia, and more than 12 million subscribers. McDowell's October 12, 2026 tally of 11,114 active Starlinks is consistent with continued growth since then. Public sources disagree on how many countries are served: the same Wikipedia article says "approximately 160 countries and territories" in its lead but notes that licenses covered 115 countries as of July 2025, so treat any single number with caution.
McDowell's constellation list shows how much more is filed than flown. Across all Starlink generations it lists 34,864 planned satellites against 13,075 launched and still on record. That gap is a reminder that regulatory filings are ambitions, not inventory.
What Starlink did in Ukraine
Starlink's strategic importance became clear in 2022. Ukraine's government asked SpaceX for help on February 26, 2022, service was activated nationwide, and the first terminals arrived on February 28, during the Battle of Kyiv. By early April 2022 about 5,000 terminals had been delivered, and by December about 22,000. SpaceX donated roughly 73% of the first 5,000, with the US Agency for International Development buying the rest; Poland paid for almost 9,000. The service connected command centers, supported drone flights and artillery spotting, and was the main link for troops in besieged Mariupol. In June 2023 the Pentagon formalized a contract to buy Starlink services for Ukraine.
The episode raised an uncomfortable question for any satellite ranking. When a privately owned constellation becomes military infrastructure, a count of "American satellites" is also a count of one company's decisions. In September 2022 Ukraine asked for coverage over Russian-occupied Crimea to support naval drone operations, and SpaceX declined. Early accounts claimed Elon Musk had secretly switched coverage off; the author of that claim later retracted it, and corrected accounts say coverage had already been geofenced and the request was refused.
For the physics of how these networks hand traffic from satellite to satellite, our explainer on how satellite internet reduces latency walks through the routing.
China's two answers: Guowang and Qianfan
China has two competing state-backed efforts to build a Starlink-style network, and neither is close to Starlink's size yet.
Guowang ("national network") is run by China SatNet, a state-owned operator. It is planned at more than 13,000 satellites, roughly 6,000 at 500 to 600 kilometers and about 7,000 at around 1,145 kilometers. The earliest test satellites flew on July 9, 2023, and the first operational low Earth orbit batch, Hulianwang 1 to 10, launched on December 16, 2024, on a Long March 5B. As of September 2026, Wikipedia counts 204 Guowang satellites in low Earth orbit, plus three in high orbit and 27 experimental satellites.
Qianfan ("Thousand Sails"), also called Spacesail, is run by Shanghai Spacecom Satellite Technology, backed by the Shanghai municipal government and the Chinese Academy of Sciences. It is planned at more than 15,000 satellites, with a first phase of 1,296. McDowell's list shows 258 launched against 16,000 planned. Its first launch, on August 6, 2024, put 18 satellites into polar orbit on a Long March 6A from Taiyuan. Soon afterward the rocket's upper stage broke apart, and US Space Command reported more than 300 pieces of trackable debris. The program also slipped: 108 satellites were planned for 2024 and 54 flew, and by the end of 2025 about 108 had launched against a target of 648.
The numbers across catalogs do not line up neatly. McDowell's list tracks Chinese national-network efforts under the label Xingwang, with 261 launched against 960 planned in one entry, and a separate entry called Xingwang2 (GW) that lists 12,992 planned and none launched, close to Guowang's 13,000-plus plan. Wikipedia, meanwhile, counts about 200 Guowang launches. Naming conventions differ between catalogs, so do not add the Guowang and Xingwang figures together.
What the data do support is the pace. The UCS counted 628 operating Chinese satellites in May 2023. China registered 374 objects in 2025 alone. If the current cadence holds, the gap with the US will narrow in launches, though from far behind in active satellites.
The constellation scoreboard
The table below compiles the best-documented large constellations. "Launched" means still on record as of the cited source, not necessarily working, and "planned" reflects regulatory filings or operator plans, which are often revised.
| Constellation | Operator country | Planned | Launched | Source and date |
|---|---|---|---|---|
| Starlink (all generations) | United States | 34,864 | 13,075 | McDowell constellation list, read October 2026 |
| Kuiper (Amazon) | United States | 7,736 | 398 | McDowell, read October 2026 |
| Starshield | United States | 1,600 | 245 | McDowell, read October 2026 |
| OneWeb | UK, India, and France (ownership) | 588 (1,116 including Eutelsat's planned next generation) | 660 | McDowell, read October 2026 |
| Qianfan | China | 16,000 | 258 | McDowell, read October 2026 |
| Guowang | China | 13,000+ | 204 (LEO) | Wikipedia, as of September 2026 |
| Telesat | Canada | 300 | 0 | McDowell, read October 2026 |
Two patterns jump out. The American operators dominate launched counts but also dominate plans, and the plans are enormous. And operators other than Starlink are mostly still building: Amazon's Kuiper, for instance, had 398 satellites launched against a plan of more than 7,700. The ranking of countries by working satellites in 2028 will depend on whether those plans are met.
Russia: a large legacy count and a small active fleet
Russia's position is the clearest case of history outweighing the present. It is second in the registry's cumulative table with 3,914 objects, but the UCS counted just 181 operating Russian satellites in 2023, and the registry shows 89 objects launched in 2025 compared with 3,708 for the US.
One area where Russia still operates a full constellation is satellite navigation, covered in the next section. Beyond that, we could not verify a reliable current count of Russian active satellites from open sources newer than the 2023 UCS snapshot, so we do not offer one.
Navigation satellites: where the rankings flip
Not every satellite constellation is about internet access. Global navigation satellite systems, or GNSS, sit much higher, in medium Earth orbit, and are run by a handful of governments for strategic independence. Here the ranking looks very different from the mega-constellation story.
| System | Operator | Operational satellites | Orbit altitude | Notes |
|---|---|---|---|---|
| GPS | United States | 30 (24 by design) | 20,180 km | Globally available since 1994 |
| GLONASS | Russia | 24, plus 1 spare | 19,130 km | Full global coverage since 1995 |
| BeiDou | China | 35 (BeiDou-3) | 21,150 km | Global service December 2018; BDS-3 completed June 2020 |
| Galileo | European Union | 26 (24 by design) | 23,222 km | Last constellation launch December 2021 |
| NavIC | India | 3 (7 by design) | About 36,000 km | Regional system, public use from early 2018 |
| QZSS | Japan | 4 (7 planned) | 32,600 to 39,000 km | Services started November 2018 |
Source: Wikipedia, "Satellite navigation," table of operational systems. Counts shift as satellites are launched and retired.
A GNSS system needs only a few dozen satellites because each one sees a large fraction of the planet from high altitude. That is why the countries with national navigation systems, the US, Russia, China, and the EU, are a different club from the countries with the most satellites. For how the signals actually give you a position, see our explainer on how GPS works, and for the history of the system, GPS invention: satellites, atomic clocks, and relativity.
Orbits explained: why altitude decides how many satellites you need
Altitude sets the economics of a constellation, and understanding it explains why one American company can field thousands of satellites while a navigation system needs a few dozen.
| Orbit | Altitude | Orbital period | Typical use |
|---|---|---|---|
| Low Earth orbit (LEO) | About 200 to 2,000 km | Roughly 1 h 29 min to 2 h 8 min | Mega-constellations, Earth imaging, the space station |
| Medium Earth orbit (MEO) | 2,000 km up to 35,786 km | Hours | Navigation systems |
| Geostationary orbit (GEO) | About 35,786 km | 23 h 56 min 4 s (one sidereal day) | Broadcast, weather, traditional communications |
Source: Wikipedia, "Geocentric orbit." The period at LEO depends on altitude.
Think of a geostationary satellite as a lighthouse. It is very high, it sees a huge area, and it never moves relative to the ground, so a handful of them can cover most of the planet. A LEO constellation is more like streetlamps along a road. Each lamp lights only a small patch for a short time, so you need a lot of them to keep every spot lit continuously. A Starlink at 530 kilometers altitude circles Earth in about 95 minutes, and from any one spot on the ground it is overhead for only a few minutes, so another satellite must be ready to take over.
The physics of latency
Altitude also sets a hard floor on delay. Light travels about 299,792 kilometers per second. For a geostationary link, a request must go up to the satellite and down to a ground station, and the reply must make the same trip back: four legs of 35,786 kilometers, or 143,144 kilometers, which takes about 0.48 seconds at light speed even in the best case. No improvement in hardware can beat that. For a satellite directly overhead at 530 kilometers, the four legs total about 2,120 kilometers, a minimum of roughly 7 milliseconds. That calculation ignores routing and processing, which add delay in practice, but it explains why LEO internet feels like a normal broadband connection and GEO internet feels slow.
The same physics explains the cost of a low orbit. At 530 kilometers a satellite moves at about 7.6 kilometers per second, roughly 27,000 kilometers per hour, and the thin atmosphere there still drags on it. Satellites at these altitudes need propulsion to hold their positions and are designed to come down on their own at the end of life. Solar activity changes that drag; our piece on Solar Cycle 25 and the 2025 solar maximum explains why active periods matter for low orbits.
India, Japan, and Europe
Beyond the big three, the registry shows a second tier with small numbers: Japan with 384 objects cumulative and 30 in 2025, France with 200 and 25, India with 163 and 7, Germany with 158 and 20, and the European Space Agency with 115 and 6. These are national or agency totals only. They do not capture commercial operators that launch under another country's flag, and the EU's Galileo satellites are often credited to ESA or to launching states.
India deserves a note because its influence exceeds its count. ISRO's Chandrayaan-3 landed on August 23, 2023, making it the fourth space agency to soft-land on the Moon, after the Soviet program, NASA, and China's agency, and the first to land near the lunar south pole. Former ISRO chairman K. Sivan estimated the mission's cost at about 615 crore rupees. India also holds a stake in the OneWeb story through Bharti Global's role in the 2020 rescue, and it operates NavIC, a regional navigation system with three operational satellites out of seven designed.
For another angle on state investment in space-adjacent technology, see our ranking of countries with the highest R&D spending, and for the broader commercial picture of who is spending on orbit, countries with the most space tourism activity.
Orbital debris: the cost of the count
More satellites means more objects that can collide. ESA's 2025 report, covering data through the end of 2024, counts about 40,000 tracked objects and estimates more than 50,000 objects larger than 10 centimeters and more than 1.2 million larger than 1 centimeter. It also notes that several major fragmentation events in 2024 added at least 3,000 tracked objects in a single year. Earlier ESA modeling, as reported in January 2019, estimated about 128 million pieces smaller than 1 centimeter.
Think of low orbit as a motorway where every vehicle travels at roughly 7.6 kilometers per second and nobody can brake quickly. A fleck of paint hitting a spacecraft at those speeds carries far more energy than its size suggests. The 2009 collision between the American Iridium 33 and the Russian Kosmos 2251, which met at about 11.7 kilometers per second, produced more than 2,000 large fragments.
Three events dominate the record:
- January 2007: China's anti-satellite test against the Fengyun-1C weather satellite at roughly 850 to 880 kilometers created more than 3,000 tracked objects, according to analyst Brian Weeden.
- February 2009: The Iridium 33 and Kosmos 2251 collision over Siberia added more than 2,000 large pieces.
- November 2021: A Russian anti-satellite test against Kosmos 1408 at about 450 kilometers created more than 1,500 trackable fragments, according to the US State Department.
NASA scientist Donald Kessler and Burton Cour-Palais proposed in 1978 the scenario now called Kessler syndrome, in which debris density becomes high enough that collisions cascade, each one creating fragments that cause more. Some researchers argue the early estimates overstated the risk, noting that only one major satellite collision had occurred by the time of that assessment. Debris tracking is increasingly an AI problem; our article on AI and space debris tracking covers how operators decide when to maneuver.
Common mistakes when reading satellite rankings
Treating cumulative launches as active satellites. The UN registry counts everything ever launched. Russia's 3,914 is mostly spacecraft that no longer exist.
Quoting a percentage that does not match the data. Some articles state that Starlink is 85% of all active satellites. By McDowell's October 2026 count it is about 65%, and by the UCS's 2023 count it would have been a much smaller share of a smaller fleet.
Assuming a country list is a capability list. A small, advanced government satellite can matter more strategically than a hundred identical communications relays. Counts say nothing about mass, resolution, or what the satellite does. For military context, see the ranking of countries with the biggest defense budgets.
Mixing sources and dates. The UCS figure of 7,560 is from May 2023, McDowell's 16,988 is from October 2026, and ESA's 11,000 is from the end of 2024. They belong in different columns.
Treating filings as inventory. FCC and ITU filings for tens of thousands of satellites are plans. McDowell's list shows 34,864 Starlink satellites planned against 13,075 launched.
Frequently asked questions
Q: Which country has the most satellites? A: The United States, by every available measure. It accounts for 15,677 of 24,865 objects in the UN-based registry through 2025, 5,184 of 7,560 operating satellites in the Union of Concerned Scientists' May 2023 snapshot, and operates Starlink, which was 11,114 of 16,988 active satellites on October 12, 2026.
Q: How many satellites are in orbit in 2026? A: McDowell's tracker listed 16,988 active satellites on October 12, 2026. ESA's report put active satellites at about 11,000 at the end of 2024, among about 40,000 tracked objects, most of the rest being debris and spent stages.
Q: How many satellites does China have? A: The Union of Concerned Scientists counted 628 operating Chinese satellites in May 2023. China registered 1,759 objects cumulatively through 2025 and 374 in 2025 alone. Guowang had roughly 200 low-orbit satellites by September 2026 per Wikipedia, and McDowell lists 258 Qianfan satellites launched.
Q: Why do satellite counts differ between sources? A: They answer different questions. Some count active satellites, some count everything tracked, and the UN registry counts launches by registering state. Update dates differ, and attribution of commercial constellations to a country is a judgment call.
Q: What is the difference between LEO, MEO, and GEO? A: Low Earth orbit is roughly 200 to 2,000 kilometers up and holds mega-constellations. Medium Earth orbit extends to 35,786 kilometers and hosts navigation systems like GPS and Galileo. Geostationary orbit, at about 35,786 kilometers, matches Earth's rotation so a satellite appears fixed in the sky.
Q: Is Starlink a danger to other satellites? A: It adds a large number of objects to low orbit, and operators and regulators have to manage collision risk. The measured debris concerns in this article come from anti-satellite tests, collisions, and rocket stage breakups, which ESA says added at least 3,000 tracked objects in 2024 alone.
The takeaway
The honest answer to "which country has the most satellites" is the United States, and the margin is wide on every list. The more useful answer is that the question mixes at least three things: history, current working fleets, and corporate ownership. History belongs to the US and Russia. The current fleet belongs mostly to one American company. The next decade's ranking depends on whether China's state constellations, Amazon's Kuiper, and the European and Canadian efforts deliver on plans that, so far, are filed much faster than they are flown. Read any satellite ranking by asking what it counts, as of what date, and whose name goes on the constellation.
Sources
- Union of Concerned Scientists Satellite Database (data through May 1, 2023)
- Jonathan McDowell, active satellite statistics (as of October 12, 2026)
- Jonathan McDowell, satellite constellation list
- ESA Space Environment Report 2025
- Our World in Data, cumulative objects launched into space (UNOOSA data)
- Our World in Data, yearly objects launched into space (UNOOSA data)
- Wikipedia: Starlink, Starlink in the Russo-Ukrainian War, Guowang, Qianfan, OneWeb
- Wikipedia: Space debris, Satellite navigation, Geocentric orbit, Chandrayaan-3
Related Reading
Follow new articles
Add SciHub101 to your feed reader to see new science and technology stories.
About the Author
SciHub101 is an independent science and technology publication founded and edited by Buğra Sözeri, a software engineer and app developer based in Türkiye. AI tools assist with drafting and research. Source documentation in the existing archive is uneven, and articles are being reviewed and corrected. The Editorial Team byline identifies editorial responsibility; it does not certify specialist or independent human review. Where we compare products, anything built by our own team is labelled as such — see the editorial guidelines and About page for how corrections and disclosures work.
Related Articles

Countries with the Most Internet Censorship (2025 Ranked)
North Korea's internet is accessible to fewer than 1,000 people — everyone else uses a sealed domestic intranet. China's Great Firewall blocks 10,000+ websites. Iran blocks 50% of the world's top websites. Here are the countries with the most internet censorship.

Countries with the Most Video Game Players (Ranked, 2024 Data)
China has the most video game players, then India and the United States. But national surveys disagree with global trackers by tens of millions, and the country with the most players is not the one that spends the most.

How Satellites Orbit Earth: The Physics and Engineering Behind Eyes in the Sky
There are over 8,000 active satellites orbiting Earth right now. Here's how they stay up and what they do.

Countries with the Most Space Tourism Activity (2025 Ranked)
The United States dominates space tourism — SpaceX, Blue Origin, and Virgin Galactic are all American companies. Only 30+ private citizens have reached space as tourists since 2001. Russia's Soyuz programme was the world's first commercial space tourism route before it ended in 2009.

Countries with the Most Skyscrapers (Ranked by 150m+ Buildings)
China has 3,492 buildings standing at 150 metres or taller — more than three times the United States total of 905 — making it the undisputed skyscraper capital of the world. The top ten countries account for roughly 90 percent of the world's tall building stock. This ranking uses Council on Tall Buildings and Urban Habitat (CTBUH) data, cross-referenced with the Skyscraper Center database, and covers the top 15 countries with methodology, historical context, and analysis of what drives vertical construction.

Countries with the Fastest Internet Speeds (Fixed Broadband Ranked)
The United Arab Emirates leads the world with a median fixed broadband download speed of 413.2 Mbps — more than four times the global average of roughly 90 Mbps. High urbanization rates, state-backed fiber rollout programs, and competitive telecoms markets are the common threads running through every country at the top of the Ookla Speedtest Global Index 2024.