Countries with the Fastest Internet Speeds (Fixed Broadband Ranked)
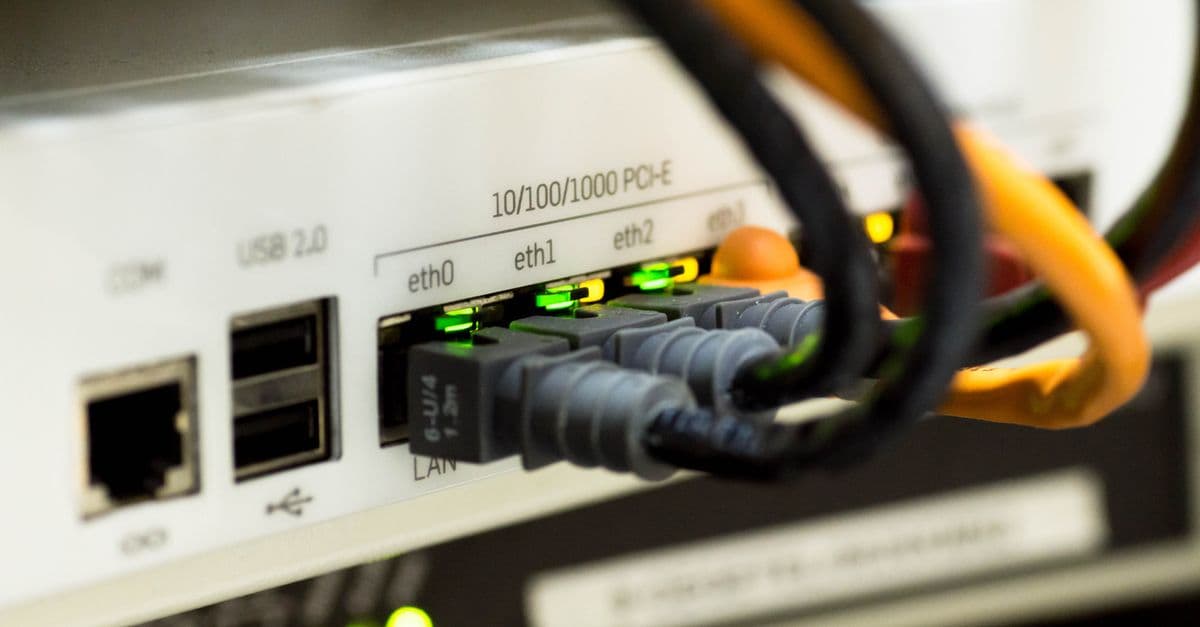
Photo: Pixabay / Pexels
The United Arab Emirates posted a median fixed broadband download speed of 413.2 Mbps in the Ookla Speedtest Global Index 2024 — the highest figure ever recorded at national scale. Singapore follows at 348.2 Mbps, making it the most structurally impressive result on the list: 5.9 million residents in a fully built city-state served by one of the world's most comprehensively fiber-connected networks. Behind those two leaders sits a cluster of wealthy, highly urbanized nations — Hong Kong, Denmark, Chile, Romania — separated by smaller margins but still far above the global median of roughly 90 Mbps. The gap reflects not just technology but decades of policy decisions about network architecture, market structure, and infrastructure investment that are now expensive to reverse.
Methodology
Q: What does "fastest internet" measure in this ranking? A: This ranking uses median fixed broadband download speed in megabits per second (Mbps), as measured by Ookla's Speedtest Global Index. Ookla aggregates billions of consumer-initiated speed tests per year across 181 countries. The metric is the median — the point at which half of all tested connections are faster and half are slower — which limits distortion from extreme high or low values. Fixed broadband is measured separately from mobile; this article covers fixed connections only. Data year is full-year 2024 as published in the Ookla Speedtest Global Index. Ookla applies quality thresholds to exclude anomalous tests; results for very small countries may reflect fewer total samples than large ones.
Source: Ookla Speedtest Global Index, 2024 — https://www.speedtest.net/global-index
Top countries by median fixed broadband download speed (2024)
| Rank | Country | Median Download (Mbps) | Notes |
|---|---|---|---|
| 1 | United Arab Emirates | 413.2 | e& (Etisalat) FTTH; 90%+ urbanized population |
| 2 | Singapore | 348.2 | Near-universal FTTH via NetLink Trust open-access model |
| 3 | Hong Kong | 310.2 | HKBN, HKT, China Mobile fiber competition drives speeds up |
| 4 | Monaco | ~271 | Microstate; sub-40,000 population, near-total fiber saturation |
| 5 | Denmark | ~268 | Open-access regulation; TDC and competing FTTH networks |
| 6 | Chile | ~260 | Fastest in Latin America; competitive urban fiber market |
| 7 | Romania | ~255 | Soviet-era apartment density lowers FTTH cost per connection |
| 8 | Iceland | ~245 | Small high-income population concentrated in Reykjavik metro |
| 9 | Netherlands | ~240 | KPN and VodafoneZiggo competing under open-access rules |
| 10 | Switzerland | ~238 | Swisscom FTTH rollout; premium pricing, premium measured speeds |
| 11 | South Korea | ~235 | KT, SK Broadband, LG Uplus on gigabit fiber; 100% urban FTTH |
| 12 | Norway | ~230 | Telenor FTTH in urban centers; rural subsidy program extends coverage |
| 13 | Sweden | ~225 | Municipal fiber networks supplement commercial FTTH rollout |
| 14 | France | ~220 | Orange FTTH; national Plan France Très Haut Débit targets |
| 15 | United States | ~212 | AT&T Fiber, Comcast, Verizon Fios competing; national average pulled down by rural areas |
| — | China | ~200 | Massive state-led FTTH build; large urban-rural speed differential |
| — | Japan | ~190 | NTT Hikari FTTH mature; high penetration but aging portions of network |
| — | Australia | ~145 | NBN mixed-technology rollout (FTTN) suppresses national median |
| — | United Kingdom | ~145 | BT Openreach FTTP below 50% of premises as of 2024; legacy FTTC dominant |
| — | India | ~75 | Jio FTTH expanding rapidly; national average suppressed by rural gap |
| — | Global median | ~90 | Ookla 2024 global median, fixed broadband, 181 countries |
Source: Ookla Speedtest Global Index, 2024 — https://www.speedtest.net/global-index
Why the UAE leads the world
The United Arab Emirates' position at number one is the product of deliberate state policy, not market accident.
The UAE's telecoms market is controlled by two operators: Etisalat (rebranded as e& in 2022) and du (EITC). Both are partly state-owned. When the government chose to build a fiber-to-the-home (FTTH) network at national scale, it could direct capital through these entities without waiting for private market incentives that might not materialize in a country with a modest total population and alternative investment options. The UAE's roughly 10 million residents are concentrated in three metropolitan areas — Dubai, Abu Dhabi, and Sharjah — that form one of the most densely networked urban clusters in the world.
The UAE's built environment reinforces the investment. Dubai, Abu Dhabi, and Sharjah are modern cities, largely constructed after the fiber era began. Legacy copper telephone networks in suburban sprawl are limited; many residential towers and commercial buildings were wired for fiber during original construction. Real estate developers actively advertised FTTH connectivity as a premium building amenity, which normalized full-fiber access across new construction stock. The result is FTTH penetration among the world's highest, a competitive dynamic between e& and du that incentivizes speed upgrades, and near-universal gigabit-capable access in urban areas.
Source: ITU Digital Development Dashboard, UAE country profile, 2024 — https://www.itu.int/itu-d/reports/statistics/2024/
Singapore: structural separation as a policy model
Singapore's 348.2 Mbps median is, in many respects, more remarkable than the UAE's lead. The UAE benefits from concentrated wealth, a small national population, and direct policy levers via state-influenced operators. Singapore is a genuine metropolitan area of 5.9 million people operating in a commercially competitive market.
Singapore's broadband success traces to a deliberate policy decision made in the mid-2000s: separating the network infrastructure layer from the service layer. The government-backed Open Singapore Fibre Network (OpenNet, later NetLink Trust) built and owns the passive fiber infrastructure — the physical cables, ducts, and termination equipment reaching every home and business. Multiple internet service providers lease access to this infrastructure at regulated wholesale prices. Structural separation removes the incentive for any single operator to withhold network investment to disadvantage rivals, and lowers barriers to entry for competing service providers.
By 2017, Singapore had achieved over 95% household fiber coverage. The residential market features five or more competing ISPs offering gigabit plans at moderate prices. Consumers can switch providers without infrastructure changing — only their service contract and router change. Gigabit plans are standard; speeds above 500 Mbps are widely available at price points below what comparable service costs in the US or UK.
Source: Infocomm Media Development Authority (IMDA) of Singapore, Annual Infocomm Usage Household Survey, 2024 — https://www.imda.gov.sg/resources/statistics-and-research
Romania and the apartment block effect
Romania's sustained presence in the global top 10 confounds observers who track GDP per capita rather than infrastructure history. It is among the EU's lower-income countries by economic output, yet it routinely outperforms France, Germany, and the United Kingdom on fixed broadband speed.
The explanation is structural and historical. Romania urbanized rapidly under communism through standardized prefabricated concrete apartment blocks — paneluri — built across every city and town. When Romanian entrepreneurs began building fiber networks in the late 1990s, the economics were unusually attractive: a single fiber run to a twelve-story building could serve 120 households at a cost per-connection far below what suburban fiber deployment in Western Europe would require.
Romanian ISPs, operating in a market with minimal legacy copper infrastructure to defend and low labor costs, built competitive LAN-based networks through apartment buildings years before Western European incumbents upgraded from ADSL. RCS&RDS (now Digi Communications) built a national fiber network offering gigabit residential service at prices below €15 per month — a price-to-speed ratio that incumbents in richer countries could not and did not match. Digi has since exported this model to Spain, Portugal, Belgium, and Hungary, disrupting incumbents in each market.
Source: ANCOM (Romanian National Regulatory Authority for Communications), Annual Report 2023 — https://www.ancom.ro/en/annual-reports
Chile: the Latin American outlier
Chile is the only Latin American country that consistently places in the global fixed broadband speed top tier. Its median download speed of approximately 260 Mbps exceeds the United States, France, and most of Western Europe — economies with substantially higher per-capita incomes.
Chile's broadband performance reflects geographic concentration and market structure. The country's population is concentrated in the Santiago metropolitan area and a coastal urban chain. This density lowers the per-connection economics of FTTH investment to commercially viable levels without requiring large state subsidies. Chile's broadband market is relatively competitive by regional standards: Movistar, Claro (after merging with VTR), WOM, and GTD have competed aggressively on price and speed in urban areas.
The Chilean government's Fibra Óptica Austral program extended FTTH to remote Patagonian regions using state subsidy, but urban Chile's speeds were already competitive before the program launched. The combination of market competition in cities and state investment in rural areas has produced a national median that outperforms most developed-world peers.
Source: SUBTEL (Subsecretaría de Telecomunicaciones de Chile), Informe Semestral de Velocidades, 2024 — https://www.subtel.gob.cl/
The UK and Australia: cautionary tales of mixed-technology decisions
The United Kingdom and Australia both rank far below what their per-capita income levels would predict, and for structurally similar reasons: both countries made political decisions to upgrade broadband networks using mixed-technology approaches that preserved existing copper telephone infrastructure rather than replacing it with fiber.
Australia's National Broadband Network (NBN), launched in the 2000s, was redesigned under political pressure in 2013 to replace full FTTH coverage with Fiber to the Node (FTTN) across a significant portion of the network — running fiber to street-level cabinets, then using copper for the final connection to homes. Copper is inherently speed-limited and degrades with distance and age. The resulting national median of approximately 145 Mbps is respectable globally but well below what a full FTTH build would have delivered. Australia has since launched an Upgrade to Fibre program reversing some FTTN deployments, but the legacy of the original mixed-technology decision will persist through the late 2020s.
The UK's situation is analogous. BT's Openreach division deployed Fiber to the Cabinet (FTTC) extensively through the 2010s, preserving copper for the final stretch to homes. Full-fiber (FTTH/FTTP) coverage remained below 50% of UK premises as of 2024. Alternative network builders — CityFibre, Nexfibre, Virgin Media O2 — are constructing FTTP at accelerating pace, but the national median remains suppressed by the large installed base of slower FTTC connections inherited from the copper-preservation decisions of the previous decade.
Source: Ofcom Connected Nations Report, 2024 — https://www.ofcom.org.uk/research-and-data/telecoms-research/connected-nations
Five structural factors that determine broadband speed rankings
1. Fiber penetration rate. The single strongest predictor. Countries where fiber reaches the home (FTTH) rather than a street cabinet (FTTC) or remote node (FTTN) achieve dramatically higher speeds. FTTH can be software-upgraded toward multi-gigabit capacity; copper-based last-mile connections cannot.
2. Urban density. Dense cities are cheaper to wire with fiber than dispersed suburbs. Singapore, Monaco, and Hong Kong are effectively single cities. The UAE's population is concentrated in three metros. Romania's apartment blocks create ideal economics. The continental US, Canada, and Australia face structural disadvantages from low-density settlement patterns that raise cost per connection to levels requiring either subsidy or acceptance of underservice.
3. Regulatory structure. Countries that mandated structural separation of network from service (Singapore) or required open-access wholesale at regulated prices (most EU countries under the European Electronic Communications Code) created conditions where multiple ISPs compete over the same physical infrastructure. Open access lowers barriers to service competition without requiring each ISP to build an entire separate network.
4. Competition intensity. Markets with three or more facility-based competitors consistently outperform monopoly or duopoly markets on speed, price, and investment pace. Romania's historically competitive and fragmented ISP market is the canonical example. Chile's urban market is more competitive than other Latin American countries, and its speeds reflect that.
5. State policy and investment. The UAE's state-owned operators, Singapore's government-backed NetLink Trust, France's national broadband plan, Chile's rural fiber subsidy, and the US Infrastructure Investment and Jobs Act (2021) allocating $65 billion to broadband all reflect governments treating broadband as infrastructure rather than a purely commercial service. Countries willing to direct or subsidize investment produce faster national rollout timelines than those relying solely on market incentives.
Source: OECD Broadband Portal, 2024 — https://www.oecd.org/sti/broadband/broadband-statistics.htm
Regional patterns
East Asia and Southeast Asia — Singapore and Hong Kong achieve top-tier speeds via dense urban concentration and competitive fiber markets. South Korea's median of around 235 Mbps slightly underrepresents its achievement: it has had near-universal residential fiber since the early 2010s, and older 100 Mbps symmetric contracts pull the median below what newer gigabit contracts deliver. China's national median of ~200 Mbps conceals a significant urban-rural divide; major cities like Shanghai and Shenzhen test at speeds competitive with global leaders.
Europe — Western European leaders (Denmark, Netherlands, Switzerland, France) cluster between 220–270 Mbps. Eastern European outliers (Romania, Hungary, Slovenia) punch above their income levels due to infrastructure history. Germany and the UK lag significantly behind their economic peers, both due to slow FTTH adoption. Germany's Glasfaser rollout accelerating from 2023 onward should improve its ranking by 2026.
Americas — The US sits around 15th globally despite being the world's largest technology economy. Geographic scale, incumbent cable market structure, and slow FTTH transition explain the gap. Chile's position above the US in fixed broadband speed is one of the most counterintuitive data points in the global connectivity landscape. Canada faces similar challenges to the US but with a smaller population over a larger geography.
Oceania and developing world — Australia's mixed-technology NBN suppresses Pacific regional averages. Sub-Saharan Africa and South Asia are largely below the global median, though India's Jio-led FTTH and 5G expansion are closing gaps faster than fixed-line economics alone would predict.
Source: ITU, Measuring Digital Development: Facts and Figures 2024 — https://www.itu.int/en/ITU-D/Statistics/Pages/publications/misr2024.aspx
Mobile broadband: a separate picture
This article measures fixed broadband, but mobile broadband speeds matter increasingly as more households globally use 4G and 5G as their primary access.
South Korea consistently leads global mobile speed rankings, reflecting near-complete 5G coverage and dense small-cell deployment in urban areas. The UAE leads for mobile speeds in the Middle East. Norway and Sweden lead Europe on 5G download speeds — Nordic telecom companies Ericsson and Nokia have domestic markets where new technology typically deploys first.
The global mobile picture is more equitable than fixed broadband: mobile networks have reached populations that will never be reached by fiber, particularly in sub-Saharan Africa and rural South and Southeast Asia. The global median mobile download speed of roughly 55 Mbps is lower than fixed, but the gap between fast and slow countries is narrowing more quickly via mobile than via fixed. India's 5G rollout under Jio and Airtel — covering over 100 cities by end of 2024 — represents a faster path to broad connectivity than FTTH in a country of 1.4 billion with dispersed settlement.
Source: Ookla Speedtest Global Index (Mobile), 2024 — https://www.speedtest.net/global-index
Frequently asked questions
Q: Why does the UAE have faster internet than countries like Japan or South Korea? A: Japan and South Korea consistently rank in the top 15 globally for fixed broadband. The UAE leads through a combination of state-directed investment, a small concentrated urban population, and two operators with direct government backing who have built FTTH to near-saturation levels. Japan's large rural population and South Korea's mountainous terrain raise the cost and complexity of universal FTTH coverage. The UAE's geographic and demographic concentration makes national saturation with FTTH structurally simpler.
Q: Does faster internet translate to measurable economic gains? A: Research consistently finds positive effects. World Bank studies estimate that each 10 percentage point increase in broadband penetration correlates with approximately 1.3 percentage points of GDP growth in developing economies. OECD research at the firm level finds faster broadband positively correlates with productivity and innovation output. Effects are strongest for knowledge-economy sectors, remote-work adoption, and small businesses accessing larger markets.
Q: Why does the United States rank below its economic status? A: The US is a continental country with extensive low-density settlement patterns that make FTTH costly. Its market was historically dominated by cable operators (Comcast, Charter, Cox) who deployed upgraded coaxial networks rather than fiber, producing moderate but not globally leading speeds. Federal policy for decades allowed incumbents to operate without the open-access obligations common in the EU. Since 2021, federal broadband funding and ISP FTTH investment have accelerated, and US median speeds are rising relative to global peers.
Q: What is the practical difference between 413 Mbps and 90 Mbps for a household? A: At 90 Mbps, a household can stream 4K video on two to three simultaneous devices and support standard web browsing and video calls without obvious congestion. At 413 Mbps, the same household can run a dozen 4K streams, cloud backup, video calls, and gaming simultaneously without constraint. The more significant implication of high national median speeds is what they indicate about the floor of service — in the UAE, even entry-level plans are fast by global standards.
Q: Is Ookla Speedtest data fully representative? A: Ookla's measurements are self-selected — users who run tests tend to be more digitally engaged, and some tests are initiated when users suspect poor performance, introducing directional bias. However, with billions of tests per year across 181 countries, the dataset is the largest and most comprehensive available for this purpose. For country-level comparative rankings, Ookla Speedtest Global Index is the most widely cited and methodologically transparent source. The M-Lab NDT dataset provides an open-source alternative; results are broadly consistent with Ookla at the country ranking level.
The takeaway
Internet speed rankings track infrastructure policy choices more reliably than national wealth. The UAE and Singapore top the list not because they are richer than Germany or the United States, but because they made specific decisions — state-backed fiber rollout, structural separation of network from service, open-access regulation — that translate into measured consumer outcomes. Romania punches far above its income level due to building density and early market competition; Australia and the UK punch below theirs due to political decisions to preserve copper infrastructure. The countries closing the gap fastest — India on 5G mobile, Brazil on FTTH, Indonesia via a combination — suggest the global connectivity hierarchy of 2035 will look different from today's rankings, but the structural fiber advantage of the current leaders will persist for years.
Sources
- Ookla Speedtest Global Index, 2024 — https://www.speedtest.net/global-index
- ITU Digital Development Dashboard, 2024 — https://www.itu.int/itu-d/reports/statistics/2024/
- IMDA Singapore, Annual Infocomm Usage Household Survey, 2024 — https://www.imda.gov.sg/resources/statistics-and-research
- ANCOM Romania, Annual Report 2023 — https://www.ancom.ro/en/annual-reports
- SUBTEL Chile, Informe Semestral de Velocidades, 2024 — https://www.subtel.gob.cl/
- Ofcom Connected Nations Report, 2024 — https://www.ofcom.org.uk/research-and-data/telecoms-research/connected-nations
- OECD Broadband Portal, 2024 — https://www.oecd.org/sti/broadband/broadband-statistics.htm
- ITU, Measuring Digital Development: Facts and Figures 2024 — https://www.itu.int/en/ITU-D/Statistics/Pages/publications/misr2024.aspx
Related Reading
Follow new articles
Add SciHub101 to your feed reader to see new science and technology stories.
About the Author
SciHub101 is an independent science and technology publication founded and edited by Buğra Sözeri, a software engineer and app developer based in Türkiye. AI tools assist with drafting and research. Source documentation in the existing archive is uneven, and articles are being reviewed and corrected. The Editorial Team byline identifies editorial responsibility; it does not certify specialist or independent human review. Where we compare products, anything built by our own team is labelled as such — see the editorial guidelines and About page for how corrections and disclosures work.
Related Articles

Countries with the Most Robots in Manufacturing (Robot Density Ranked)
South Korea has 1,012 industrial robots per 10,000 manufacturing workers — the highest robot density ever recorded for a major economy. That is more than six times the global average of 162, and more than double Germany's figure. The IFR World Robotics 2024 report shows a world where automation in factories is accelerating faster than at any point in industrial history.

Countries with the Most Skyscrapers (Ranked by 150m+ Buildings)
China has 3,492 buildings standing at 150 metres or taller — more than three times the United States total of 905 — making it the undisputed skyscraper capital of the world. The top ten countries account for roughly 90 percent of the world's tall building stock. This ranking uses Council on Tall Buildings and Urban Habitat (CTBUH) data, cross-referenced with the Skyscraper Center database, and covers the top 15 countries with methodology, historical context, and analysis of what drives vertical construction.

Countries with the Highest Internet Penetration (2025 Ranked)
The Gulf states report about 100% internet use, and Denmark, Luxembourg, and Norway are above 99%. At the other end, several countries are below 20%. Here is the ranking, how it is measured, and what keeps 2.2 billion people offline.

Countries with the Most Internet Users (2026 Ranked)
China has 1.09 billion internet users — the largest national online population on Earth. India is close behind at 920 million, with the fastest growth. The US (315M), Indonesia (220M), and Brazil (190M) round out the top 5. By 2026, 5.5 billion people — 67% of humanity — are online. Here's the full ranking and what it means.

Countries with the Most Data Centers (2025 Ranked)
The United States hosts more data centers than any other country by every count, but the totals vary from about 3,800 to 5,400 depending on the database. Here is the ranking, why facility counts and megawatts tell different stories, and what the IEA says about data centre electricity.

How the Internet Actually Works
Undersea cables, packets, IP addresses, routers, DNS and encryption: the engineering that moves every click from your device to a server and back in a fraction of a second.