Countries With the Most Renewable Energy Capacity (2025)
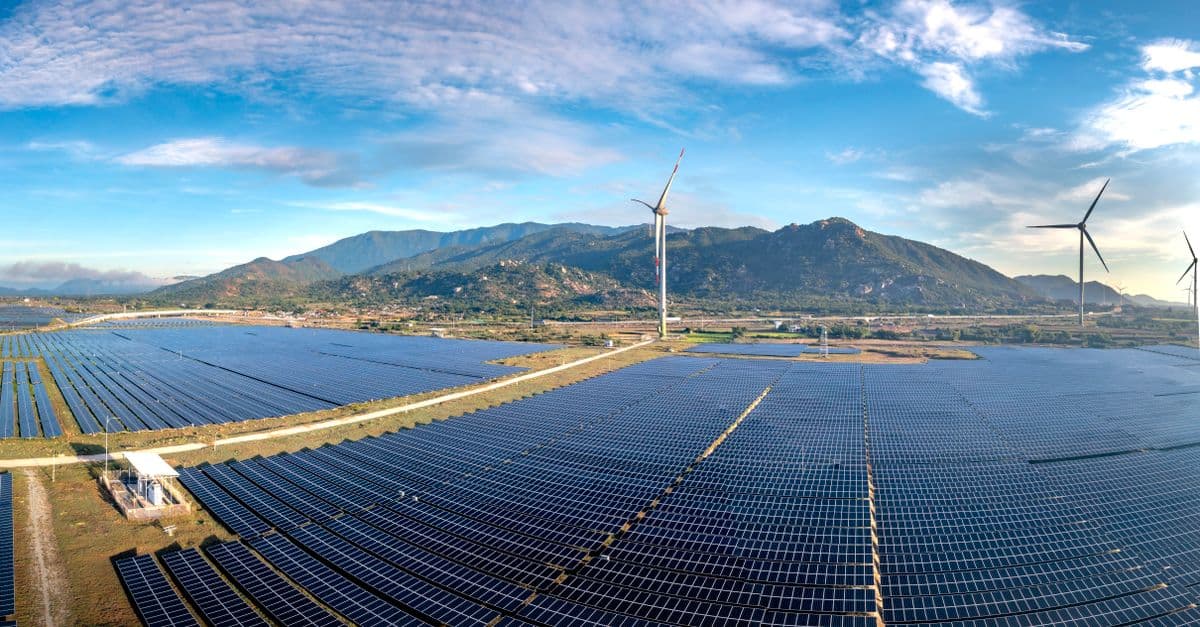
Photo: Quang Nguyen Vinh / Pexels
Renewable power capacity is the total nameplate rating, in gigawatts (GW), of every solar farm, wind turbine, hydroelectric plant, bioenergy station and geothermal well connected in a country. It answers one specific question: how much renewable generating equipment has a country built? It does not answer how much of its electricity comes from renewables. That second question has its own ranking on this site, Countries That Run on the Most Renewable Energy, and the two lists look very different.
This page uses one source for every country row: the International Renewable Energy Agency's Renewable Capacity Statistics 2025 (IRENA, March 2025), which reports installed capacity at the end of 2024. Using a single dataset matters. National agencies, industry associations and news reports use different cut-off dates, count off-grid solar differently, and sometimes include pumped-storage hydro, so mixing sources produces rankings that cannot be compared row to row.
The headline numbers from that report are large. Global renewable capacity reached 4,448 GW at the end of 2024, after a record 585 GW was added during the year, a 15.1% increase. Renewables made up 92.5% of all new power capacity built worldwide in 2024, and accounted for 46% of total installed power capacity on the planet.
Key Takeaways
- China had 1,827 GW of renewable capacity at the end of 2024, about 41% of the world's 4,448 GW (IRENA 2025).
- China added roughly 374 GW in 2024 alone, close to two-thirds of the 585 GW added worldwide.
- The United States (428 GW), Brazil (214 GW), India (204 GW) and Germany (179 GW) complete the top five.
- Solar was the largest renewable technology globally at 1,865 GW, ahead of renewable hydropower (1,283 GW) and wind (1,133 GW).
- Capacity is not generation: renewables were 46% of world capacity but only about 32% of world electricity in 2024, because solar and wind run at lower capacity factors.
The Ranking: Top 20 Countries by Installed Renewable Capacity (End of 2024)
All figures are from IRENA, Renewable Capacity Statistics 2025, and show capacity at the end of calendar year 2024, rounded to the nearest 0.1 GW. "Growth" compares end-2024 with end-2023 in the same dataset.
| Rank | Country | Total renewable capacity (GW, 2024) | End-2023 (GW) | Growth in 2024 | Source |
|---|---|---|---|---|---|
| 1 | China | 1,827.3 | 1,453.7 | +25.7% | IRENA RCS 2025 |
| 2 | United States | 428.4 | 385.2 | +11.2% | IRENA RCS 2025 |
| 3 | Brazil | 213.9 | 194.5 | +10.0% | IRENA RCS 2025 |
| 4 | India | 204.3 | 175.7 | +16.3% | IRENA RCS 2025 |
| 5 | Germany | 178.7 | 159.9 | +11.7% | IRENA RCS 2025 |
| 6 | Japan | 132.3 | 128.8 | +2.7% | IRENA RCS 2025 |
| 7 | Canada | 110.5 | 108.9 | +1.5% | IRENA RCS 2025 |
| 8 | Spain | 88.5 | 80.9 | +9.4% | IRENA RCS 2025 |
| 9 | France | 74.3 | 67.4 | +10.2% | IRENA RCS 2025 |
| 10 | Italy | 72.1 | 64.8 | +11.3% | IRENA RCS 2025 |
| 11 | Türkiye | 69.0 | 58.8 | +17.4% | IRENA RCS 2025 |
| 12 | Australia | 63.5 | 55.5 | +14.4% | IRENA RCS 2025 |
| 13 | United Kingdom | 58.2 | 56.1 | +3.8% | IRENA RCS 2025 |
| 14 | Russia | 54.4 | 56.6 | -3.8% | IRENA RCS 2025 |
| 15 | Viet Nam | 49.0 | 47.8 | +2.5% | IRENA RCS 2025 |
| 16 | Sweden | 42.4 | 40.3 | +5.2% | IRENA RCS 2025 |
| 17 | Norway | 40.7 | 40.1 | +1.6% | IRENA RCS 2025 |
| 18 | Netherlands | 36.6 | 32.9 | +11.3% | IRENA RCS 2025 |
| 19 | Mexico | 34.0 | 33.0 | +3.3% | IRENA RCS 2025 |
| 20 | South Korea | 33.8 | 30.5 | +10.7% | IRENA RCS 2025 |
| — | World | 4,448.1 | 3,862.9 | +15.1% | IRENA RCS 2025 |
Two things stand out. First, the gap between first and second place is enormous: China's renewable fleet is more than four times the size of the United States' fleet. Second, the list is not just a list of the largest economies. Brazil, Canada, Norway and Sweden rank far higher than their GDP alone would predict because they sit on exceptional hydropower resources, built over most of the twentieth century.
Is China larger than the rest of the world combined? Not quite. Earlier versions of this article claimed so, and the IRENA figures do not support it: the world outside China had about 2,621 GW at the end of 2024, against China's 1,827 GW. What is true is that China alone has more renewable capacity than the countries ranked 2 to 15 in this table put together (about 1,797 GW), and that China built close to two-thirds of all new capacity in 2024.
What Each Country Has Built: Capacity by Technology
The total hides very different energy systems. The table below splits each top-13 country's 2024 capacity into the three main technologies. "Hydro" here is IRENA's renewable hydropower, which excludes pure pumped-storage plants (those store electricity rather than generate it from a natural flow). "Other" is the remainder of the total, mostly bioenergy, plus geothermal, marine and small items.
| Country | Solar (GW) | Wind (GW) | Renewable hydro (GW) | Other (GW) | Largest source |
|---|---|---|---|---|---|
| China | 887.9 | 521.7 | 385.0 | 32.7 | Solar |
| United States | 177.5 | 153.2 | 84.2 | 13.5 | Solar |
| Brazil | 53.1 | 33.0 | 110.0 | 17.8 | Hydro |
| India | 97.4 | 48.2 | 47.5 | 11.2 | Solar |
| Germany | 89.9 | 72.8 | 5.8 | 10.2 | Solar |
| Japan | 91.6 | 5.8 | 28.2 | 6.7 | Solar |
| Canada | 6.1 | 18.4 | 83.3 | 2.7 | Hydro |
| Spain | 38.6 | 31.8 | 16.8 | 1.3 | Solar |
| France | 21.5 | 24.6 | 24.6 | 3.6 | Wind / hydro (tie) |
| Italy | 36.0 | 13.0 | 19.0 | 4.1 | Solar |
| Türkiye | 19.9 | 13.0 | 32.4 | 3.7 | Hydro |
| Australia | 38.5 | 15.3 | 8.8 | 0.9 | Solar |
| United Kingdom | 17.6 | 30.9 | 2.2 | 7.5 | Wind |
| World | 1,865.5 | 1,132.8 | 1,283.0 | 166.8 | Solar |
Source: IRENA, Renewable Capacity Statistics 2025 (technology tables, end-2024 values). "Other" is computed as total minus solar, wind and renewable hydro.
A few patterns are worth naming:
- Solar has become the default. In 8 of these 13 countries, solar is now the largest single renewable technology by installed capacity. Globally, solar overtook hydropower, a technology with a century head start, and in 2024 the world added 452 GW of solar compared with 113 GW of wind (IRENA 2025). For how a panel converts sunlight into grid power, see How Solar Panels Actually Work: From Photon to Grid, and for generation rather than capacity, Countries That Produce the Most Solar Power.
- Hydropower countries are a distinct group. Brazil and Canada still get most of their renewable capacity from dams (about 51% and 75%), and Türkiye gets nearly half (about 47%). Their totals grow slowly, because the best river sites were developed decades ago, which is why Canada grew only 1.5% in 2024. The hydropower capacity ranking covers this group in detail.
- Wind is concentrated. China and the United States together hold about 60% of the world's wind capacity (675 of 1,133 GW). The UK is the only top-13 country where wind is the largest renewable source, largely thanks to offshore wind in the North Sea. For the physics of turbines, see How Do Wind Turbines Work.
Capacity vs. Generation: Why the Two Rankings Disagree
A gigawatt of capacity is a promise of what a plant could produce running flat out. A terawatt-hour (TWh) of generation is what it did produce. The bridge between the two is the capacity factor: actual output over a period divided by the output if the plant had run at full rating the entire time.
One gigawatt running at 100% for a full year would produce 8,760 GWh, or 8.76 TWh. No plant does that. The U.S. Energy Information Administration publishes measured capacity factors for the American fleet, which give a useful sense of scale:
| Technology (U.S. fleet) | Capacity factor 2023 | Capacity factor 2024 |
|---|---|---|
| Nuclear | 93.0% | 90.8% |
| Geothermal | 69.4% | 64.6% |
| Hydroelectric | 35.0% | 34.6% |
| Wind | 33.2% | 34.3% |
| Solar photovoltaic | 23.2% | 23.2% |
Source: U.S. EIA, Electric Power Monthly, Table 6.07.B.
So in the United States, a gigawatt of solar produced roughly a quarter of what a gigawatt of nuclear produced. Capacity factors vary by country: a solar farm in a desert does better than one under cloudy skies, and Norwegian or Canadian reservoirs can run hydro plants harder than the U.S. average. But the direction never changes: a solar-heavy fleet produces fewer TWh per GW than a hydro-heavy or geothermal-heavy fleet.
This is why a country can climb the capacity ranking without climbing the generation-share ranking at the same speed. Ember's electricity data (compiled on Wikipedia's list of countries by renewable electricity production) shows the effect when set against IRENA's capacity:
| Country | Renewable capacity, end-2024 (GW, IRENA) | Renewable generation, 2025 (TWh, Ember) | Implied average output per GW |
|---|---|---|---|
| China | 1,827 | 3,913 | ~2.1 TWh per GW |
| United States | 428 | 1,159 | ~2.7 TWh per GW |
| Brazil | 214 | 650 | ~3.0 TWh per GW |
| Canada | 110 | 417 | ~3.8 TWh per GW |
| Germany | 179 | 296 | ~1.7 TWh per GW |
| Norway | 41 | 159 | ~3.9 TWh per GW |
The last column is a rough indicator, not a precise capacity factor: it divides 2025 generation by end-2024 capacity, so fast-growing fleets (China, Germany) look a little better than they really are, and slow-growing hydro fleets look about right. Even so, the pattern is clear. Canada and Norway, which run on reservoir hydro, squeeze more than twice as much electricity from each gigawatt as Germany, whose fleet is dominated by solar panels at northern latitudes and onshore wind.
The same logic works at the global scale. IRENA counts renewables as 46% of the world's installed power capacity at the end of 2024. Ember's Global Electricity Review 2025 reports that low-carbon sources supplied 40.9% of world electricity in 2024, of which nuclear was 9.0%, which leaves renewables at roughly 32% of generation. The difference between 46% of capacity and about 32% of output is mostly the capacity factor gap between solar and wind on one side and fossil and nuclear plants on the other.
Country Profiles
1. China: 1,827 GW
China's renewable capacity grew by about 374 GW in 2024, from 1,454 GW to 1,827 GW, according to IRENA. That single-year increase is close to the entire renewable fleet of the United States. Solar did most of the work: Chinese solar capacity rose from 610 GW to 888 GW in twelve months, an increase of 278 GW. Wind rose from 442 GW to 522 GW.
China's lead also has a long tail. IRENA's ten-year series shows China at 479 GW in 2015, meaning its fleet has nearly quadrupled in a decade. Hydropower provides a large and stable base (385 GW of renewable hydro, the most of any country), while solar and wind have supplied almost all of the recent growth.
The capacity-generation gap is especially visible here. China's renewable generation of roughly 3,900 TWh in 2025 is the largest in the world, but China's total electricity demand is also the world's largest, so renewables still provide a minority of its power. Coal remains the backbone of the Chinese grid. For China's place in emissions rankings, see Countries With the Highest CO₂ Emissions.
2. United States: 428 GW
The U.S. added about 43 GW of renewable capacity in 2024, ending the year at 428 GW. Solar capacity rose from 139 GW to 177 GW, overtaking wind (153 GW) as the country's largest renewable technology by capacity. Hydropower capacity has been essentially flat at around 84 GW of renewable hydro for a decade, since few new large dams are built.
Because U.S. wind farms run at roughly 34% capacity factor and solar at about 23% (EIA), each gigawatt of American wind produces around half as much again as a gigawatt of solar, so solar's lead in installed gigawatts is much smaller, or absent, when measured in electricity produced. This is a good example of why the GW ranking and the TWh ranking should be read side by side.
3. Brazil: 214 GW
Brazil is the largest hydropower country outside China. IRENA lists 110 GW of renewable hydro, which is more than half of the country's renewable fleet. Its newer growth comes from elsewhere: solar rose from 0.05 GW in 2015 to 53 GW in 2024, and wind reached 33 GW. Brazil also has the second-largest bioenergy capacity in the world after China, 17.8 GW (IRENA), much of it from sugarcane bagasse burned at ethanol mills.
4. India: 204 GW
India passed 200 GW of renewable capacity in 2024, growing about 16% in a year. Solar is now its largest renewable technology at 97 GW, having roughly doubled since 2021 (50.0 GW). Wind (48 GW) and hydro (47.5 GW) are roughly equal. India's growth rate places it among the fastest-growing large fleets, though its absolute additions (about 29 GW in 2024) are a fraction of China's.
5. Germany: 179 GW
Germany is the leading European country by renewable capacity and has the largest solar fleet in Europe at 90 GW. It added about 15 GW of solar in 2024 alone. Its hydro resource is small (under 6 GW), so its fleet depends on solar and wind, which is why its output per GW is lower than in hydro countries. Germany's large capacity relative to its electricity demand is what allows wind and solar to cover a large share of consumption on sunny or windy days, while making grid balancing and cross-border trade important.
6 to 10: Japan, Canada, Spain, France, Italy
- Japan (132 GW): One of the most solar-dependent fleets in the world, with 92 GW of solar and under 6 GW of wind. Its growth slowed sharply in 2024 (+2.7%), partly because flat land for utility-scale solar is scarce.
- Canada (110 GW): 83 GW of renewable hydro makes it the hydro-dominant mirror image of Japan. Growth was only 1.5% in 2024.
- Spain (88.5 GW): Europe's second-largest fleet, balanced between solar (39 GW) and wind (32 GW).
- France (74 GW): An unusually even split between hydro, wind and solar. France's electricity system is dominated by nuclear power, which is low-carbon but not renewable and therefore not counted here; see Countries With the Most Nuclear Power.
- Italy (72 GW): Solar-led at 36 GW, with an older hydro base of 19 GW.
How This Ranking Changed Over a Decade
IRENA's time series lets us compare 2015 with 2024 directly.
| Country | 2015 (GW) | 2024 (GW) | Multiple |
|---|---|---|---|
| China | 479.1 | 1,827.3 | 3.8× |
| United States | 196.0 | 428.4 | 2.2× |
| Brazil | 116.7 | 213.9 | 1.8× |
| India | 78.6 | 204.3 | 2.6× |
| Germany | 97.2 | 178.7 | 1.8× |
| Japan | 66.9 | 132.3 | 2.0× |
| Canada | 96.0 | 110.5 | 1.2× |
| Australia | 17.6 | 63.5 | 3.6× |
| World | 1,851.1 | 4,448.1 | 2.4× |
Source: IRENA, Renewable Capacity Statistics 2025, ten-year series.
The world's renewable fleet grew 2.4 times in nine years. Almost all of that growth came from solar, which went from 227 GW in 2015 to 1,865 GW in 2024, an eightfold increase. Australia is a notable riser: its fleet grew 3.6 times, driven by rooftop and utility solar. Canada barely moved, because hydro dominates its fleet and new dams are rare.
Where the Growth Is Concentrated
IRENA's 2025 report highlights how unevenly new capacity is distributed. China, the United States and the European Union together installed 489 GW of the 585 GW added in 2024, or 83.6%. The entire continent of Africa added 4.2 GW, 0.7% of the global total. Small island developing states, taken together, have about 9 GW of renewable capacity, 0.2% of the world's fleet.
That concentration matters because the places adding the least capacity are often those with the best solar resources and the fastest-growing electricity demand. Financing costs are a major factor: a solar farm has almost no fuel cost, so nearly all of its lifetime cost is paid upfront, and a higher interest rate makes that upfront payment much more expensive. Countries with expensive capital therefore find it harder to build renewables even when the resource is excellent. Climate exposure follows a similar map; see Countries Most Vulnerable to Climate Change.
The 2030 Tripling Target
At the COP28 climate summit in Dubai (December 2023), governments agreed a goal to triple global renewable capacity by 2030. IRENA's 2025 report frames this as about 11 TW (11,000 GW) by 2030. Starting from 4,448 GW at the end of 2024, IRENA says the world would need to add more than 1,120 GW per year for the rest of the decade, nearly double the record 585 GW added in 2024. On current growth rates, IRENA concludes, the world is not on track.
Two caveats help put that in context. First, the gap is mostly a financing and grid problem rather than a manufacturing one, because solar module production has expanded rapidly. Second, capacity is the target metric, so a tripling of capacity heavy in solar would produce less than a tripling of renewable electricity, for the capacity-factor reasons described above.
Methodology and Limitations
What counts as renewable. IRENA includes solar (photovoltaic and concentrated solar power), onshore and offshore wind, renewable hydropower, bioenergy (solid biofuels, renewable municipal waste, biogas, liquid biofuels), geothermal and marine energy. Nuclear power is low-carbon but not renewable, so it is excluded. Pumped-storage hydro is shown separately by IRENA and is excluded from renewable hydropower in our technology table.
AC vs DC solar. Solar panels are rated in direct current (DC), but the grid runs on alternating current (AC), and inverters are usually smaller than the panels they serve. Countries report solar in different ways. Small differences between this page and national statistics often come from this issue.
Estimates. IRENA marks some values as estimates or as taken from unofficial sources, especially for recent years and for countries with incomplete reporting. China's and India's hydropower figures for 2024, for example, carry estimate flags in the source tables. Totals for 2024 may be revised in the 2026 edition.
Off-grid capacity. IRENA includes off-grid installations where data exist, but small household solar systems in many low-income countries are likely undercounted.
Generation figures. The generation comparisons on this page come from Ember, a different dataset, and refer to 2025, so they are used only to illustrate the capacity-generation gap, not to rank countries.
Frequently Asked Questions
Q: Which country has the most renewable energy capacity? A: China, with 1,827 GW at the end of 2024 according to IRENA's Renewable Capacity Statistics 2025. That is about 41% of the global total of 4,448 GW, and more than four times the United States' 428 GW.
Q: Does China have more renewable capacity than the rest of the world combined? A: No. At the end of 2024 the rest of the world had about 2,621 GW, compared with China's 1,827 GW. However, China installed close to two-thirds of all new renewable capacity in 2024, so its share is rising quickly.
Q: What is the difference between renewable capacity and renewable generation? A: Capacity (GW) is the maximum output of installed equipment; generation (TWh) is the electricity actually produced. Solar and wind run at lower capacity factors than hydro, geothermal or nuclear, so a GW of solar produces much less electricity per year than a GW of reservoir hydro.
Q: Which renewable technology has the most installed capacity worldwide? A: Solar, with 1,865 GW at the end of 2024, ahead of renewable hydropower (1,283 GW) and wind (1,133 GW). Solar also accounted for 452 GW of the 585 GW added in 2024.
Q: Is nuclear power counted in renewable capacity? A: No. Nuclear power is low-carbon, but it uses a finite fuel (uranium), so IRENA and most statistical agencies exclude it from renewable totals. Countries such as France have very clean grids that this ranking does not fully reflect for that reason.
Q: Is the world on track to triple renewable capacity by 2030? A: Not on current trends, according to IRENA. Reaching about 11 TW by 2030 would require more than 1,120 GW of additions each year, roughly double the 585 GW record set in 2024.
The Bottom Line
Measured by installed gigawatts, renewable power is dominated by a handful of countries, and by China most of all. IRENA's data show a world fleet of 4,448 GW at the end of 2024, growing at a record 15% a year, with solar now the largest technology. But a gigawatt is a measure of equipment, not of electricity. Hydro-rich countries like Canada, Norway and Brazil get far more power per gigawatt than solar-led fleets in Germany or Japan, and China's enormous capacity still covers only part of its enormous demand. To judge how clean a grid really is, read this ranking alongside the generation-share ranking. For the wider picture, see the Complete Sustainability Guide 2026.
Sources
- IRENA (2025), Renewable Capacity Statistics 2025, International Renewable Energy Agency, Abu Dhabi. All country capacity figures, technology splits, 2015 series, 2024 additions and the 2030 tripling analysis.
- Ember (2025), Global Electricity Review 2025. Global low-carbon (40.9%) and nuclear (9.0%) shares of 2024 electricity.
- U.S. Energy Information Administration, Electric Power Monthly, Table 6.07.B, capacity factors for non-fossil fuel plants, 2023–2024.
- Wikipedia, List of countries by renewable electricity production, compiling Ember 2025 generation data by country.
Related Reading
Follow new articles
Add SciHub101 to your feed reader to see new science and technology stories.
About the Author
SciHub101 is an independent science and technology publication founded and edited by Buğra Sözeri, a software engineer and app developer based in Türkiye. AI tools assist with drafting and research. Source documentation in the existing archive is uneven, and articles are being reviewed and corrected. The Editorial Team byline identifies editorial responsibility; it does not certify specialist or independent human review. Where we compare products, anything built by our own team is labelled as such — see the editorial guidelines and About page for how corrections and disclosures work.
Related Articles

Countries With the Most Electric Vehicles Per Capita (2025)
Norway has the highest electric share of any national car fleet, with more than one in three cars electric, and 97% of its 2025 new-car sales were electric or plug-in hybrid. Here is how every major market compares, and why fleet share and sales share tell different stories.

Countries Most Targeted by Cyber Attacks (2025–26 Data)
No single table ranks the countries most targeted by cyber attacks. Microsoft, IBM, the FBI, and Chainalysis each measure something different, and the United States leads most of them. This page lays out what each dataset shows and what it hides.
Largest Solar Farms in the World
The largest solar farms rank by installed capacity, from China's Tengger park to the UAE's Al Dhafra site. Here is how capacity, land, and real output compare.
Countries with the Most Hydropower (Ranked by Installed Capacity)
China leads the world in hydropower with 435.95 GW of installed capacity — more than three times that of second-place Brazil at 110 GW. Hydropower is the world's largest source of renewable electricity, accounting for roughly 40 percent of global renewable generation. This ranking covers the top 15 countries by hydropower installed capacity using IHA and IRENA 2024 data, with methodology, historical context, and caveats about what capacity figures do and do not tell you.

Countries With the Most Electric Buses (2025)
China had more than 680,000 electric buses at the end of 2024, far ahead of any other country. This ranking compares fleets, 2024 sales, and market shares across China, India, Latin America, Europe, and the United States, and explains why the numbers are hard to line up.
Countries That Run on the Most Renewable Electricity (Ember Data)
A handful of countries already generate essentially all of their electricity from hydro, wind, solar, geothermal and bioenergy. This ranking uses Ember's generation data, with the year for every row, and explains why most leaders are hydro countries and what that means for everyone else.