Countries That Run on the Most Renewable Electricity (Ember Data)
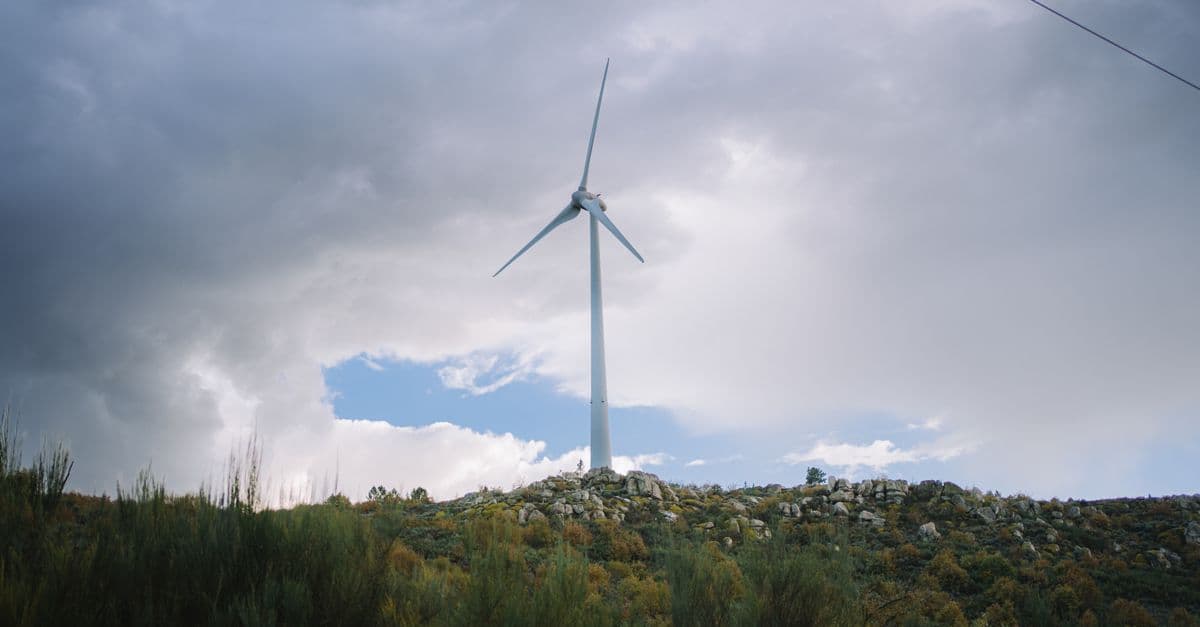
Photo: Diogo Miranda / Pexels
A growing group of countries already run their power grids almost entirely on renewable energy. That is no longer a forecast or a pilot project; it shows up in the annual generation statistics that grid operators report and that analysts such as Ember compile into comparable country series. What the statistics also show, once you read them closely, is that the list of leaders is not what most people expect. It is dominated by mountainous, rainy or volcanic countries with large hydropower or geothermal resources, and by a smaller number of countries that built wind and solar fleets on purpose.
This ranking measures one thing: the share of a country's electricity generation that comes from renewable sources, meaning hydropower, wind, solar, geothermal, bioenergy, and the small contribution of tidal and wave power. Nuclear power is low-carbon but not renewable, so it is excluded. That single definitional choice moves several countries a long way down the table, and it is explained below.
Key Takeaways
- At least eight countries generating 5 TWh or more a year report a renewable share that rounds to 100%: Albania, Bhutan, Costa Rica, the Democratic Republic of the Congo, Ethiopia, Iceland, Nepal and Paraguay.
- Hydropower is the backbone of nearly every top-ranked country. Of the top 12 in the table, only Uruguay gets less than half of its power from hydro.
- Denmark is the clearest example of a leader built on variable renewables: wind (about 58%), solar (13%) and bioenergy (20%) gave it a 91% renewable share in 2025.
- "Fossil-free" and "renewable" are not the same. Sweden is roughly 71% renewable, but most of the rest is nuclear, so its grid is almost carbon-free.
- Globally, renewables supplied about 34% of electricity generation in 2025, and fossil fuels about 57%.
Top 23 Countries by Renewable Share of Electricity Generation
The table covers countries that generated at least 5 TWh of electricity in the latest year available. That threshold removes very small island and micro-state systems, whose percentages swing a lot from year to year and are less informative. Every row shows the year the figure refers to. Where Ember has published 2025 data it is used; otherwise the 2024 value is shown.
| Rank | Country | Renewable share of generation | Data year | Main renewable sources (share of generation) |
|---|---|---|---|---|
| 1= | Paraguay | ~100% | 2025 | Hydro 99.5% |
| 1= | Ethiopia | ~100% | 2025 | Hydro 96.5%, wind 3.3% |
| 1= | Costa Rica | ~100% | 2025 | Hydro 74.8%, wind 12.1%, geothermal and other 11.9% |
| 1= | Iceland | ~100% | 2024 | Hydro 70.7%, geothermal 29.2% |
| 1= | Democratic Republic of the Congo | ~100% | 2024 | Hydro 84.2%, solar 15.8% |
| 1= | Nepal | ~100% | 2024 | Hydro 98.8% |
| 1= | Bhutan | ~100% | 2024 | Hydro 100% |
| 1= | Albania | ~100% | 2024 | Hydro 95.9%, solar 4.1% |
| 9 | Norway | 99.0% | 2025 | Hydro 90.0%, wind 8.4% |
| 10 | Uruguay | 97.8% | 2025 | Wind 40.6%, hydro 27.2%, bioenergy 24.9%, solar 5.1% |
| 11 | Uganda | 97.1% | 2024 | Hydro 86.1%, bioenergy 8.1% |
| 12 | Tajikistan | 94.4% | 2025 | Hydro 94.4% |
| 13 | Denmark | 91.2% | 2025 | Wind 57.7%, bioenergy 20.1%, solar 13.4% |
| 14 | Venezuela | 91.1% | 2024 | Hydro 91.1% |
| 15 | Kenya | 90.0% | 2025 | Geothermal and other 45.9%, hydro 20.9%, wind 16.4% |
| 16 | New Zealand | 88.5% | 2025 | Hydro 54.8%, geothermal and other 21.8%, wind 9.7% |
| 17 | Zambia | 87.5% | 2024 | Hydro 86.2% |
| 18 | Brazil | 86.6% | 2025 | Hydro 51.8%, wind 15.7%, solar 11.8%, bioenergy 7.3% |
| 19 | El Salvador | 86.5% | 2025 | Hydro 30.3%, geothermal and other 20.7%, solar 20.3% |
| 20 | Kyrgyzstan | 84.7% | 2025 | Hydro 84.7% |
| 21 | Austria | 83.6% | 2025 | Hydro 51.8%, solar 14.1%, wind 11.3% |
| 22 | Mozambique | 83.4% | 2024 | Hydro 82.4% |
| 23 | Portugal | 81.0% | 2025 | Hydro 29.7%, wind 26.7%, solar 17.3% |
Source: Ember electricity generation data as republished in the Our World in Data energy dataset (columns
renewables_share_elecand the per-source shares), accessed 2026-10-19. Ember has reported full 2025 data for only a subset of countries (91 in its Global Electricity Review 2026), so rows labelled 2024 reflect the latest underlying country data and may be revised. "~100%" means the reported value rounds to 100.0%; small amounts of diesel or backup generation can still exist. "Geothermal and other" is Ember's "other renewables" category, which in these countries is overwhelmingly geothermal.
Two things stand out. First, the countries tied at the top span every income level, from Iceland and Norway to Ethiopia, Nepal and the DR Congo. A 100% renewable grid is not a marker of wealth. Second, a near-100% share says nothing about how much electricity people actually have. The DR Congo and Ethiopia generate clean power, but large parts of their populations have little or no grid access, so per-person consumption is very low. Electricity share is a measure of how power is made, not of energy access.
How the Metric Works, and Why It Can Mislead
Renewable share of generation is calculated as renewable output divided by total domestic electricity generation in the same year. It is simple and comparable, but it has three blind spots worth knowing before you quote any ranking.
Generation is not consumption. A country that exports a lot of power, like Paraguay, is measured on what it produces, not what its households use. A country that imports a large amount, like several Baltic and Balkan states, can look cleaner or dirtier than its consumption mix really is, depending on what its neighbours burn. Some national statistics, including the European Union's renewable-energy accounting, use gross final consumption instead, and those figures will not match the ones above.
Electricity is only part of energy. Electricity is roughly a fifth of final energy use worldwide. The rest is mostly oil for transport, gas and coal for heat and industry. A country can have a 100% renewable grid and still import large amounts of petrol and diesel. Norway is the classic case: its grid is almost entirely hydro, but it is also one of Europe's biggest oil and gas producers.
Year-to-year weather matters. Hydro output depends on rain and snowmelt; wind output depends on how windy the year was. Brazil, Zambia and Uruguay have all seen their renewable share move by several points between wet and dry years, and Zambia's hydro-dependent system was hit hard by the 2024 southern African drought. A single-year ranking is a snapshot, not a permanent position.
Why Hydropower Dominates the Top of the List
Of the 23 countries in the table, 20 get more electricity from hydropower than from any other renewable source. The reason is physics and timing. A reservoir dam stores energy as water held at height. Operators can release it when demand rises and hold it back when demand falls, which is exactly what a grid needs. That makes large hydro a dispatchable source, the renewable equivalent of a gas plant that can be turned up and down.
Most of the world's large dams were built between the 1950s and the 1990s, long before climate policy. Countries with steep terrain and high rainfall, such as Norway, Nepal, Bhutan, Tajikistan, Kyrgyzstan and Albania, built them because hydro was the cheapest power available. Their high renewable share is a legacy of geography and twentieth-century engineering, not of recent climate commitments. For a country-by-country view of installed dams, see our ranking of the countries with the most hydropower.
Hydropower has real costs. Large reservoirs flood valleys, displace communities and block fish migration, and in the tropics decaying vegetation in shallow reservoirs can release methane. Droughts expose a second weakness: a grid that is 85% hydro has very little to fall back on in a dry year. Several of the countries in the table are now adding solar for exactly that reason, which is why the DR Congo, Albania and Austria show meaningful solar shares.
Geothermal: Iceland, Kenya, Costa Rica, New Zealand and El Salvador
Five countries in the table get a large share of their power from geothermal energy, and all five sit on tectonic plate boundaries or volcanic arcs. Geothermal plants drill into hot rock or reservoirs of hot water and steam, run that steam through turbines, and reinject the cooled fluid. Unlike wind and solar, geothermal output is steady day and night, which is why it pairs well with hydro.
Iceland sits on the Mid-Atlantic Ridge. In 2024, about 71% of its electricity came from hydropower and about 29% from geothermal. Geothermal energy also heats most Icelandic buildings directly through district-heating networks; a 2018 country report by Iceland GeoSurvey, citing 2017 data from Orkustofnun (the National Energy Authority), put geothermal at about 90% of house heating. Iceland's very high electricity use per person is driven largely by energy-intensive industry, especially aluminium smelting, which moved there for cheap, stable power.
Kenya is the less familiar geothermal leader. Its geothermal fields in the Rift Valley, centred on Olkaria, supplied roughly 46% of Kenyan electricity in 2025, with hydro adding about 21% and wind about 16%. That diversity matters: in drought years Kenya relies less on its dams than its neighbours do. Kenya is a useful counterexample to the assumption that only rich countries can run clean grids.
Costa Rica has a mix that is unusually balanced for a small grid: about 75% hydro, 12% wind and 12% geothermal in 2025. The state utility, the Instituto Costarricense de Electricidad (ICE), manages reservoirs so that geothermal and wind cover the dry season, when rivers fall. New Zealand combines a large hydro system on the South Island with geothermal fields on the North Island's volcanic plateau, reaching about 88.5% renewable generation in 2025. El Salvador shows the same volcanic pattern in Central America, with geothermal and other renewables near 21% and a fast-growing solar share of about 20%.
Paraguay: Clean Power at an Export Scale
Paraguay is the most extreme hydro case. Virtually all of its electricity, about 99.5% in 2025, comes from two binational dams on the Paraná River: Itaipú, shared with Brazil, and Yacyretá, shared with Argentina. Under the Itaipú treaty each country is entitled to half of the output, and Paraguay has historically used only part of its share, selling the rest to Brazil. Generation of about 45 TWh in 2025 is far more than a country of under 7 million people consumes, which is why Paraguay is consistently one of the world's largest electricity exporters relative to the size of its economy.
The Paraguayan case also illustrates the generation-versus-consumption issue. On a generation basis it is 100% renewable. On a final energy basis it is not: diesel and petrol still power most of its transport, and firewood and charcoal remain important for heat in rural areas.
Uruguay: A Planned Transition in a Decade
Uruguay is the most instructive country in the table because its high share is recent and deliberate. In 2025, wind supplied about 41% of its electricity, hydro 27%, bioenergy 25% and solar 5%, for a renewable total of about 98%. The bioenergy share is unusually large; most of it comes from burning residues in the pulp and paper industry, which generates electricity as a by-product.
Uruguay built most of its wind capacity in the 2010s through long-term power purchase auctions run by the state utility UTE, under an energy policy agreed across political parties in 2008. The model is worth noting for other mid-sized countries: predictable contracts, a single buyer, and existing hydro reservoirs that act as storage when the wind drops. To understand the machines themselves, see how wind turbines work and whether they can power the world.
Denmark: Leading Without Mountains
Denmark is flat, has no meaningful hydropower and no geothermal power plants, yet generated about 91% of its electricity from renewables in 2025. Wind alone supplied about 58%, solar about 13% and bioenergy about 20%. That makes Denmark the strongest real-world evidence that a grid built mainly on variable renewables can work at national scale.
Three conditions made it possible. Denmark began supporting wind power in the 1970s and 1980s, which gave it an early manufacturing base and decades of operating experience. It converted many coal-fired combined heat and power plants to burn wood pellets and straw, which keeps a dispatchable source on the system, although the climate benefit of imported wood biomass is disputed. And it is tightly connected to its neighbours, especially Norway and Sweden, whose hydro reservoirs can absorb Danish surpluses on windy days and supply power on calm ones. Denmark's grid is clean partly because Scandinavia's is.
Norway and Sweden: Two Kinds of Clean
Norway generated 99% of its electricity from renewables in 2025: about 90% hydro and 8% wind. Its reservoirs make it a flexible exporter, and subsea cables connect it with Denmark, Germany, the Netherlands and the United Kingdom. Cheap, clean power is one reason Norway leads the world in electric car adoption; see our ranking of the countries with the most electric vehicles.
Sweden is a common error in renewable rankings, including an earlier version of this article, which listed it at about 97%. That figure describes fossil-free generation. On Ember's 2025 data Sweden's renewable share was about 71%, with hydro near 40%, wind 23%, bioenergy 6% and solar 3%. Most of the remainder is nuclear. Sweden's grid is therefore close to carbon-free but not close to 100% renewable. France shows a more extreme version of the same pattern. For the nuclear side of the picture, see the countries with the most nuclear power.
Large Economies: Where the Biggest Grids Stand
The countries at the top of the ranking are mostly small or medium electricity systems. The large economies that dominate global demand tell a different story.
| Country | Renewable share of generation | Wind | Solar | Hydro | Fossil share | Data year |
|---|---|---|---|---|---|---|
| Brazil | 86.6% | 15.7% | 11.8% | 51.8% | n/a | 2025 |
| Canada | 63.9% | 7.9% | 1.6% | 52.8% | n/a | 2025 |
| Germany | 59.1% | 27.2% | 17.9% | 3.9% | 40.9% | 2025 |
| Spain | 55.9% | 20.4% | 21.8% | 11.4% | 25.4% | 2025 |
| United Kingdom | 52.0% | 29.4% | 6.6% | 1.9% | 35.6% | 2025 |
| China | 37.0% | 10.7% | 11.1% | 13.2% | 58.3% | 2025 |
| United States | 25.6% | 10.3% | 8.6% | 5.3% | 57.0% | 2025 |
| India | 24.1% | 5.0% | 9.4% | 8.6% | 73.3% | 2025 |
| Japan | 23.6% | 1.2% | 9.8% | 7.2% | 67.3% | 2025 |
| Russia | 17.4% | 0.3% | 0.2% | 16.7% | 64.3% | 2025 |
| South Korea | 10.4% | 0.6% | 6.1% | 0.6% | 60.0% | 2025 |
| Iran | 3.8% | 0.3% | 0.2% | 3.3% | 94.3% | 2025 |
| Saudi Arabia | 2.2% | 0.4% | 1.8% | 0.0% | 97.8% | 2024 |
| World | 33.8% | 8.5% | 8.7% | 14.0% | 57.4% | 2025 |
Source: Ember data via the Our World in Data energy dataset, accessed 2026-10-19. Shares do not add to 100% because bioenergy, geothermal and nuclear are not shown in every column.
Germany is the reference case for a large industrial economy without good hydro. Its renewable share reached about 59% of generation in 2025, built mostly on onshore wind, offshore wind and rooftop and utility solar. Germany closed its last three nuclear reactors in April 2023, so most non-renewable generation is now coal and gas. Spain has become a solar leader, with solar slightly ahead of wind in 2025. The United Kingdom crossed 50% renewable generation, mainly through offshore wind, and closed its last coal power station, Ratcliffe-on-Soar, in September 2024.
China is in an unusual position. It builds more wind and solar capacity each year than any other country, and wind plus solar reached about 22% of its generation in 2025. But demand growth has been so fast that coal still supplies the majority of Chinese power. The global ranking of absolute output is covered in our list of the countries that produce the most solar power. India, Japan and South Korea remain heavily fossil-dependent, and the Gulf producers Saudi Arabia and Iran sit at the bottom despite having some of the world's best solar resources.
The Global Picture
Ember's Global Electricity Review 2025 reported that in 2024 low-carbon sources (renewables plus nuclear) produced 40.9% of the world's electricity, up from 39.4% in 2023. Solar generation grew by 474 TWh, or 29%, to reach 6.9% of global electricity; wind supplied 8.1% and hydro 14.3%. Fossil generation still rose by 1.4%, mainly because heatwaves pushed up demand for cooling, and power-sector emissions reached a record 14.6 billion tonnes of CO₂.
The 2025 data in the tables above continue the trend: solar (8.7%) passed wind (8.5%) as a share of world generation, and total renewables reached about a third of all electricity. The direction is clear, but the pace matters. Electricity demand is rising quickly because of air conditioning, electric vehicles, heat pumps and data centres. How fast new clean supply can outrun that growth decides whether fossil generation actually falls. Our explainer on how AI data centers use electricity covers one of the newest sources of demand.
The Integration Problem: Getting Past 50–60% Wind and Solar
Countries with large hydro or geothermal resources solved the hardest part of the transition by accident: they have clean power that can be controlled. Countries that rely on wind and solar face a different engineering problem. Wind and solar output rises and falls with the weather and the time of day, and a grid must match supply and demand second by second.
At low shares, the existing system absorbs the variability easily. As wind and solar pass roughly half of generation, four kinds of tools become necessary:
- Interconnection. Linking grids over wide areas averages out local weather. Denmark's links to Norway and Sweden are the clearest example. The history of these networks is told in the story of the electric power grid.
- Storage. Pumped hydro still holds most of the world's grid storage, but lithium-ion battery installations have grown very quickly because they are well suited to shifting solar output from midday to evening.
- Flexible demand. Electric vehicle charging, heat pumps and industrial loads can be scheduled to run when power is plentiful. The effect of EVs specifically is covered in our article on electric vehicles and grid impact.
- Firm clean power. Hydro, geothermal, nuclear and bioenergy can run when wind and solar cannot. Longer-term options include hydrogen produced from surplus renewable electricity, explained in how green hydrogen is made.
South Australia, Denmark, Spain and Portugal are the regions pushing furthest into this territory today, and their experience will shape how the large economies plan the next stage.
Common Misconceptions
"100% renewable means no fossil fuels." It means no fossil fuels in electricity generation, and even then usually with small backup exceptions. Transport, industrial heat and cooking can still be fossil-based.
"These countries succeeded through policy alone." Some did, notably Uruguay and Denmark. Most of the countries at the very top succeeded through geography and decades-old dam building. Both kinds of success are real, but they offer different lessons.
"Nuclear countries are lagging." On a renewable metric they rank lower, but on a low-carbon metric France, Sweden and Switzerland are among the cleanest grids in Europe. Which metric you choose depends on the question you are asking.
"Scotland is 100% renewable." Scotland is part of the United Kingdom and is not reported as a separate country in Ember's dataset, so it is not in this table. Scottish government statistics have reported renewable generation equivalent to around 100% or more of Scotland's gross electricity consumption in recent years, but that is a consumption-equivalent measure and Scotland exports a large share of its output to England.
Frequently Asked Questions
Q: Which country has the highest share of renewable electricity? A: Several countries are effectively tied at about 100% on Ember's data, including Paraguay, Ethiopia, Costa Rica, Iceland, Nepal, Bhutan, Albania and the DR Congo. Norway (99%) and Uruguay (98%) follow closely. All except Uruguay rely mainly on hydropower or geothermal energy.
Q: Does a 100% renewable grid mean a country uses no fossil fuels? A: No. The figure covers only electricity generation. Most of these countries still import oil products for vehicles, shipping, aviation and some industry, and some use firewood or charcoal for heating and cooking.
Q: Why is Sweden not near the top if its grid is so clean? A: Because a large part of Swedish electricity comes from nuclear power, which is low-carbon but not renewable. Sweden's renewable share was about 71% in 2025, while its total low-carbon share is far higher.
Q: Which large economy has the highest renewable share? A: Among the largest electricity systems, Brazil leads at about 87% in 2025, mainly hydro with fast-growing wind and solar. Canada (about 64%) is also high because of hydro. Germany (59%) is the leader among large economies without major hydro resources.
Q: Why are Gulf countries so low despite their sunshine? A: Their power systems were built around cheap domestic oil and gas, and fuel subsidies kept fossil generation inexpensive. Saudi Arabia's renewable share was about 2% in 2024. Large solar projects are under construction, but they are starting from a very low base.
Q: How much of the world's electricity is renewable? A: About 34% of global generation in 2025 on Ember's data, with hydro near 14%, solar near 9% and wind near 8.5%. Including nuclear, low-carbon sources supplied 40.9% in 2024 (Ember's 2026 review puts the 2025 figure higher, at about 43%).
The Bottom Line
The countries that run on renewable electricity fall into two groups. The larger group inherited it: mountains, rivers or volcanoes, plus dams and geothermal plants built over decades. The smaller group, led by Uruguay, Denmark and increasingly Portugal and Spain, chose it, and their experience is the more useful guide for the rest of the world, because most large economies cannot build their way to 100% with hydro. The global share is now about a third and rising each year. The open question is not whether wind and solar can supply most of a grid, which Denmark shows they can, but how fast storage, interconnection and flexible demand can be built to let the biggest grids follow.
Sources
- Our World in Data, energy dataset (based on Ember and the Energy Institute): github.com/owid/energy-data
- Ember, Global Electricity Review 2025: ember-energy.org
- Our World in Data, CO₂ and greenhouse gas dataset (used for context on power-sector emissions): github.com/owid/co2-data
Related Reading
Follow new articles
Add SciHub101 to your feed reader to see new science and technology stories.
About the Author
SciHub101 is an independent science and technology publication founded and edited by Buğra Sözeri, a software engineer and app developer based in Türkiye. AI tools assist with drafting and research. Source documentation in the existing archive is uneven, and articles are being reviewed and corrected. The Editorial Team byline identifies editorial responsibility; it does not certify specialist or independent human review. Where we compare products, anything built by our own team is labelled as such — see the editorial guidelines and About page for how corrections and disclosures work.
Related Articles
Countries with the Most National Parks and Protected Land (2025)
Nobody can rank countries by national park count fairly, because 'national park' means different things in different legal systems. Here is what the protected-area data actually shows, from Zambia's 41% to the 63 US parks, and what protection achieves.
Countries Contributing the Most to Ocean Plastic Pollution (2025)
A 2021 model of more than 1,000 rivers put the Philippines first, at about 36 percent of plastic carried to the sea by rivers, followed by India, Malaysia, China, and Indonesia. The ranking says as much about geography and waste systems as about consumption, and the estimates carry large uncertainty.
Renewable Energy Explained — Solar, Wind, and Beyond
How solar panels and wind turbines work, why their costs fell about 90%, how fast they are spreading, and what storage and grids must still solve.
Countries with the Most Wind Power Capacity (2025 Ranked)
China has about 641 GW of installed wind capacity, nearly half of the world's roughly 1,291 GW. The United States, Germany, India, and Brazil follow. Denmark ranks 17th by capacity but gets about 59% of its electricity from wind. Here is the 2025 ranking, what it measures, and what it leaves out.
Countries With the Most Renewable Energy Capacity (2025)
China had 1,827 GW of renewable power capacity at the end of 2024, 41% of the world total, per IRENA. See the top 20 countries by installed gigawatts and why capacity is not the same as generation.
Complete Sustainability Guide 2026 — Climate, Energy, and Conservation
The complete guide to sustainability in 2026: renewable energy, climate science, circular economy, conservation strategies, and actionable steps to reduce your impact.