Renewable Energy Explained — Solar, Wind, and Beyond
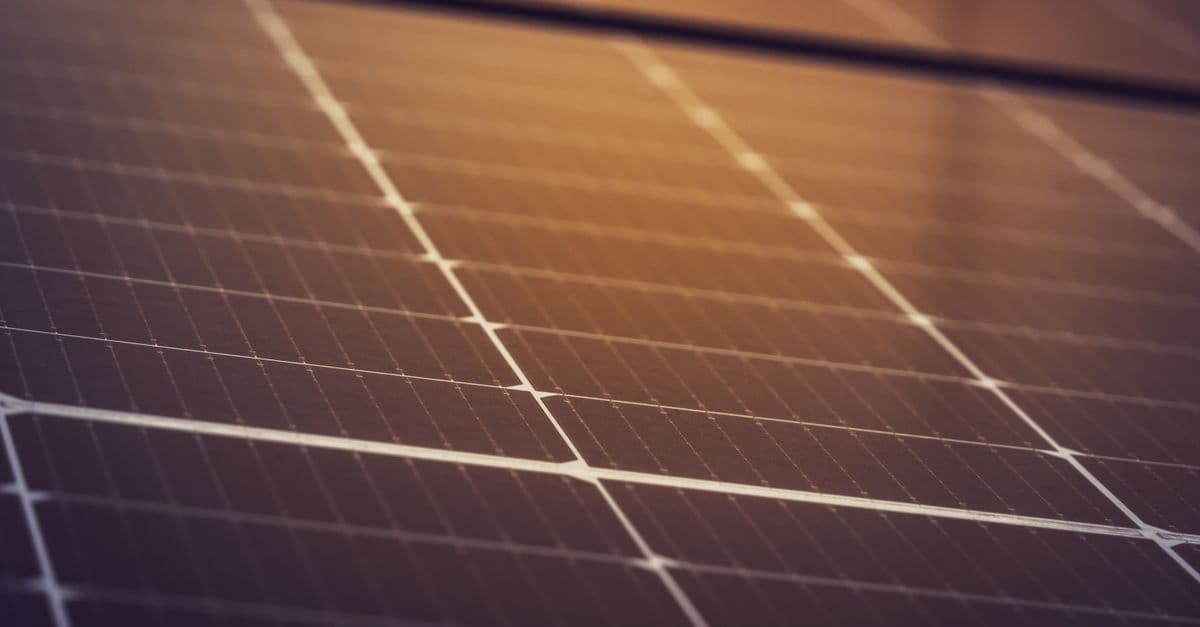
Photo: Michael Pointner / Pexels
The cost of generating electricity from sunlight fell by about 90% between 2010 and 2023, according to the International Renewable Energy Agency (IRENA). Over a longer horizon the numbers are even starker: Our World in Data's series puts the price of a solar module at about $132 per watt in 1975 and about $0.27 per watt in 2024 (both in constant 2025 dollars), a decline of more than 99.7%. Few manufactured goods in history have become that much cheaper, and the effect has reshaped how the world builds power plants.
Yet cheap panels and turbines are only half the story. A grid that runs mostly on weather-dependent generation needs storage, long transmission lines, new stability controls and some firm low-carbon power. This article explains how solar photovoltaics and wind turbines actually work, why their costs collapsed, how fast they are being adopted, and which problems are still genuinely hard.
How Photovoltaics Work
A solar photovoltaic (PV) cell is a semiconductor device that converts photons into electric current. Most commercial cells are made of silicon engineered into a p-n junction: a boundary between positively doped silicon (p-type, with electron "holes") and negatively doped silicon (n-type, with extra electrons). The idea that light delivers energy in discrete packets, which makes all this possible, traces back to Einstein's explanation of the photoelectric effect.
When sunlight strikes the cell, photons with enough energy knock electrons free from silicon atoms. The built-in electric field at the p-n junction sweeps these freed electrons one way and the resulting holes the other, creating a flow of direct current (DC) collected by thin metal contacts on the cell surface. An inverter then converts DC to alternating current (AC) for the grid. The step-by-step path from a single photon to a household socket is covered in more detail in our explainer on how solar panels work and whether they are worth it.
The efficiency ceiling
The Shockley-Queisser limit, published by William Shockley and Hans Queisser in 1961, caps the theoretical efficiency of a single-junction cell at roughly 33–34% under standard sunlight. Two losses dominate. Photons with less energy than silicon's bandgap (about 1.1 electron-volts) pass straight through without freeing an electron. Photons with far more energy than the bandgap free an electron but lose the surplus as heat. No amount of engineering removes those two losses from a single-material cell.
Commercial monocrystalline silicon panels typically convert around 20–24% of incoming sunlight. Multi-junction cells get around the limit by stacking several materials with different bandgaps, each tuned to a slice of the spectrum. Laboratory multi-junction cells under concentrated sunlight have exceeded 47% efficiency, as tracked on NREL's best research-cell efficiency chart, but they are too expensive for rooftops and are used mainly on satellites and in concentrator systems.
From a lab curiosity to a commodity
The first practical silicon solar cell was demonstrated at Bell Labs in 1954, at around 6% efficiency (the history is told in our article on the invention of the photovoltaic solar cell). For decades PV was a niche product for spacecraft and remote equipment. What changed was volume. Price data compiled by Our World in Data show the module price falling from roughly $132/W in 1975 to $0.37/W in 2022, $0.32/W in 2023 and $0.27/W in 2024 in constant 2025 dollars.
Engineers describe this with Wright's Law, an empirical rule that unit costs fall by a roughly constant percentage each time cumulative production doubles. For solar modules that learning rate has historically been around 20%, meaning every doubling of all panels ever made has cut costs by about a fifth (this rate is a widely cited estimate from the learning-curve literature, including Way et al., Joule, 2022). Because global solar manufacturing has doubled many times since the 1970s, the compounding is enormous.
Several forces fed that curve:
- Early demand-pull policy. Germany's feed-in tariffs in the 2000s guaranteed buyers for panels long before they were competitive, giving manufacturers volume.
- Chinese industrial scale-up. The IEA's 2022 Solar PV Global Supply Chains report found China's share of every main manufacturing stage (polysilicon, ingots, wafers, cells and modules) exceeded 80%, and that China had invested over $50 billion in new PV supply capacity since 2011.
- Better cells. Thinner wafers, passivated rear contacts (PERC) and newer cell designs squeezed out more watts per square metre.
- Overcapacity. The IEA's Renewables 2023 report noted that module spot prices fell almost 50% in 2023 alone as manufacturing capacity reached three times its 2021 level.
The result, in IRENA's Renewable Power Generation Costs in 2023, is a global weighted average levelised cost of electricity (LCOE) for new utility-scale solar of $0.044/kWh in 2023, 12% lower than in 2022 and about 90% lower than in 2010. IRENA also calculated that solar's LCOE was 56% below the weighted average of fossil-fuel alternatives in 2023.
How Wind Turbines Work
A wind turbine converts the kinetic energy of moving air into rotation, and rotation into electricity. The blades are airfoils, shaped much like aircraft wings. Air flowing around the blade creates a pressure difference between its two faces, and the resulting aerodynamic lift pulls the blade sideways, turning the rotor. The rotor drives a shaft connected either through a gearbox or directly (in "direct-drive" designs) to a generator in the nacelle at the top of the tower. For a deeper walk through the components, see how wind turbines work and whether they can power the world.
The Betz limit
The Betz limit, derived by Albert Betz in 1919, states that no turbine can extract more than 16/27, or 59.3%, of the kinetic energy in the wind passing through its swept area. This is a fluid-dynamics constraint rather than an engineering one. To take energy from the air, a turbine must slow it down; if it slowed the air to a stop, nothing would flow through the rotor and no further energy could be collected. The optimum occurs when the air leaving the rotor moves at one-third of its incoming speed. Well-designed modern turbines get within striking distance of this limit at their best operating speeds.
Why wind speed matters so much
The power available in wind scales with the cube of wind speed: double the speed and the available power rises eightfold. A site averaging 7 m/s therefore holds about 2.7 times the wind energy of a site averaging 5 m/s, which is why developers spend years measuring wind before choosing a location. Wind also blows faster and more steadily higher above the ground, so towers keep getting taller and blades longer. Because the swept area grows with the square of the blade length, a modest increase in rotor size buys a large increase in output.
Onshore and offshore
Onshore wind is now a mature, low-cost technology. IRENA put the global weighted average LCOE of new onshore wind at $0.033/kWh in 2023, 3% lower than in 2022 and 67% below the weighted average fossil-fuel alternative.
Offshore wind trades higher construction costs for stronger, steadier winds and room for very large machines. Vestas's V236-15.0 MW turbine, for example, has a 236-metre rotor, and Chinese manufacturers are deploying even larger prototypes. Most offshore turbines today sit on foundations fixed to the seabed, which limits them to relatively shallow water. Floating offshore wind, which moors turbines to floating platforms, lets developers reach deep waters off coasts such as Norway's, where Equinor's Hywind demonstration pioneered the approach. Floating wind remains considerably more expensive than fixed-bottom offshore and is still at an early commercial stage.
How Cheap Is Renewable Power Now?
Cost comparisons in energy use the levelised cost of electricity (LCOE): the total lifetime cost of building and running a plant, divided by the electricity it produces, expressed per kilowatt-hour or megawatt-hour. LCOE is useful but incomplete. It does not capture when a plant produces power, how much backup or storage a variable source needs, or the cost of new transmission. Keep that limitation in mind; it is the theme of the second half of this article.
Two independent public datasets tell a consistent story:
- IRENA (global, 2023 data): utility-scale solar averaged $0.044/kWh and onshore wind $0.033/kWh for projects commissioned in 2023.
- Lazard LCOE+ (United States, 2026 report, version 19.0, unsubsidised): utility-scale solar ranges from $40 to $98 per MWh and onshore wind from $37 to $99/MWh, versus $51–129/MWh for new gas combined-cycle plants and $72–177/MWh for coal. Lazard also notes that wind and solar LCOEs rose year over year because of higher capital costs, interest rates and tariffs, a reminder that the long decline is not guaranteed every year.
In the sunniest locations with cheap financing, auction and power-purchase-agreement prices have gone lower still, which is why the IEA described solar PV in its World Energy Outlook 2020 as offering some of the lowest-cost electricity ever seen.
Energy source comparison: cost and carbon
| Energy source | Unsubsidised LCOE, US new-build ($/MWh, Lazard 2026) | Lifecycle emissions, median (gCO₂eq/kWh, IPCC AR5) |
|---|---|---|
| Utility-scale solar PV | 40–98 | 48 |
| Onshore wind | 37–99 | 11 |
| Offshore wind | 105–167 | 12 |
| Utility solar + storage | 61–156 | — |
| Nuclear (US, based on Vogtle 3 and 4) | 175–255 | 12 |
| Gas combined cycle | 51–129 | 490 |
| Gas peaking plant | 144–276 | — |
| Coal | 72–177 | 820 |
Sources: Lazard, "Levelized Cost of Energy+" (2026, LCOE v19.0), unsubsidised US ranges; IPCC Fifth Assessment Report (2014), Working Group III, Annex III lifecycle medians. Lifecycle figures include manufacturing, construction, fuel and decommissioning. Ranges are for the United States and will differ elsewhere.
The table makes two points at once. Wind and solar are now among the cheapest ways to produce a megawatt-hour, and their lifecycle emissions are a few percent of coal's. But the "solar + storage" row also shows that firming a variable source costs extra, which is why the cheapest-megawatt-hour argument alone does not settle how to build a whole grid.
Why cheap solar matters beyond electricity bills
Cheap clean electricity changes the economics of other sectors too:
- Transport: electric vehicles get cleaner to run as the grid decarbonises (see how EVs reshape electricity demand).
- Heating: heat pumps move heat rather than create it, and become more attractive as clean power gets cheaper.
- Industry: low-cost electricity is a precondition for electrolytic hydrogen and electrified industrial heat.
- Energy access: in places without a reliable grid, solar plus batteries can provide power without first building large fossil plants.
Adoption by the Numbers
Technology adoption often follows an S-curve: slow early uptake, rapid acceleration, then saturation. Solar and wind appear to be in the steep part of that curve.
According to Ember's Global Electricity Review 2025, which covers 2024:
- Solar supplied 6.9% of global electricity and generated more than 2,000 TWh. Solar generation grew by 474 TWh (29%), the fastest-growing source of electricity for the 20th year in a row.
- Wind supplied 8.1%. Together, wind and solar overtook hydropower in 2024.
- Hydropower supplied 14.3%, still the largest single renewable source.
- Low-carbon sources (renewables plus nuclear) reached 40.9% of global generation, up from 39.4% in 2023.
- Global installed solar capacity passed 2 terawatts, and installations in 2024 were more than double those in 2022.
Capacity additions tell the same story. The IEA's Renewables 2023 report found that global renewable capacity additions rose almost 50% in 2023 to nearly 510 GW, the fastest growth rate in two decades, with solar PV making up about three-quarters of the total. China alone added as much solar PV in 2023 as the entire world had in 2022, and its wind additions grew 66%. Solar output by country is ranked in our list of the countries that produce the most solar power.
The tripling target
At the COP28 climate summit in Dubai in December 2023, countries agreed to aim to triple global renewable capacity by 2030. The IEA calculates that tripling 2022's capacity means more than 11,000 GW by 2030. Its Renewables 2023 main-case forecast, under existing policies, had global capacity reaching about 7,300 GW by 2028 and around 2.5 times the 2022 level by 2030, short of the target. In that same forecast, renewables would supply over 42% of global electricity in 2028, with wind and solar reaching 25%.
Where the grid is already mostly renewable
Several smaller systems already run mostly on renewables. Eurostat data reported by Invest in Denmark show renewables supplied 88.4% of Denmark's net electricity generation in 2024, mostly from wind, the highest share in the EU. Countries with large hydropower resources, such as Norway and Iceland, have long run almost entirely on renewable electricity; see the countries with the most hydropower. The challenge for larger, more fossil-dependent grids is shifting from adding capacity to operating a system dominated by variable generation.
Energy Storage: Moving Electricity Through Time
Sunlight and wind are variable. A solar farm produces nothing at night and little under heavy cloud; a wind farm goes quiet when the air is still. Storage shifts surplus generation to the hours when it is needed.
Lithium-ion batteries
Lithium-ion is now the dominant technology for new grid storage. The IEA's Batteries and Secure Energy Transitions (2024) found that lithium-ion battery prices fell from about $1,400/kWh in 2010 to under $140/kWh in 2023, a roughly 90% drop. BloombergNEF's December 2024 survey reported a further 20% fall, to a record low average pack price of $115/kWh in 2024 across all uses, with packs in China averaging $94/kWh. (The chemistry itself has a long history, told in our article on the lithium-ion battery.)
Deployment is accelerating with price. The IEA counts 42 GW of battery storage added to power systems worldwide in 2023, more than double the previous year, bringing the total in use to over 85 GW. Lithium iron phosphate (LFP) chemistry, which avoids cobalt and nickel and tolerates many charge cycles, made up about 80% of new battery storage in 2023.
Grid batteries do more than store midday solar for the evening. Because their power electronics respond in milliseconds, they can correct frequency deviations far faster than a spinning power plant can change output. Australia's Hornsdale Power Reserve in South Australia, commissioned in 2017, became the best-known early example of a large battery providing this kind of fast grid service.
Their main limitation is duration. Most grid batteries store a few hours of output at full power. That covers the daily solar cycle well but cannot bridge a windless, overcast week in winter.
Pumped hydro
Pumped storage hydropower uses surplus electricity to pump water uphill into a reservoir and releases it through turbines when power is needed. It remains the largest store of grid energy by far. IEA analysis drawing on International Hydropower Association data put pumped-hydro storage volume at about 9,000 GWh in 2018, against roughly 7 GWh for batteries at the time. The technology is proven and long-lived, but it needs specific geography, and large projects take many years to permit and build. Batteries are now growing much faster: in its net-zero scenario, the IEA expects batteries to supply about 90% of the storage capacity growth needed by 2030.
Longer-duration options
For storage lasting from many hours to weeks, several approaches compete:
- Flow batteries (such as vanadium redox) store energy in liquid electrolytes held in external tanks, so power and energy capacity can be sized separately. They tolerate many cycles but currently cost more than lithium-ion.
- Iron-air and other novel chemistries target 100-hour discharge durations using cheap, abundant materials, and are at an early commercial stage.
- Hydrogen can be stored for months in salt caverns, but turning electricity into hydrogen and back again loses most of the energy, as discussed below.
Storage at a glance
| Technology | Typical discharge duration | Key strength | Key limitation |
|---|---|---|---|
| Lithium-ion battery | 1–4 hours | Fast response, falling cost (~90% cheaper since 2010, IEA) | Short duration; mineral supply chains |
| Pumped hydro | Hours to days | Largest existing storage volume; long life | Needs suitable sites; slow to build |
| Flow battery | Several hours to a day | Independent power and energy sizing | Higher cost today |
| Iron-air | ~100 hours | Cheap materials; multi-day storage | Early commercial stage |
| Hydrogen (power-to-power) | Days to seasons | Very large, long-term storage | Low round-trip efficiency |
Durations are typical design ranges, not hard limits. Cost trend from IEA, Batteries and Secure Energy Transitions (2024).
The IEA's net-zero scenario calls for total global energy storage capacity of about 1,500 GW by 2030, roughly 1,200 GW of it batteries, a fourteenfold increase on 2023 that would require battery deployment to grow about 25% a year.
Grid Integration: The Hard Problem
Grids were designed around large, controllable power plants. Adding a high share of variable, inverter-connected generation creates system-level challenges that cheap panels alone cannot solve.
The duck curve
California's grid operator popularised the "duck curve," named for the shape of net demand (total demand minus solar output) on a spring day. Solar floods the grid around midday, pushing net demand and wholesale prices down, sometimes below zero. Then, as the sun sets just when people come home, net demand climbs steeply, and other resources must ramp up fast to fill the gap. The same pattern now appears in other sunny, high-solar grids. Batteries charged at noon and discharged in the evening are the most direct fix, which is why battery fleets in California and Texas have grown so quickly.
Curtailment and negative prices
When renewable output exceeds what the grid can use, export or store, operators must curtail it: tell wind and solar farms to produce less than they could. Curtailment is a symptom of insufficient transmission or flexibility rather than of too much clean power. Negative wholesale prices, where generators effectively pay to keep producing, are another signal that the system needs more storage, demand flexibility or interconnection.
Inertia and grid stability
Traditional generators have heavy spinning rotors locked to the grid's frequency (50 or 60 Hz). That stored rotational energy, called inertia, resists sudden changes and buys operators a few crucial seconds when a large plant trips offline. Solar panels, batteries and most modern wind turbines connect through inverters and provide no natural inertia. As thermal plants retire, grids need grid-forming inverters that imitate the stabilising behaviour of spinning machines, plus fast frequency response from batteries. The technology exists; what lags is grid codes that require it and investment to deploy it at scale. How we got to today's synchronised grids is covered in our history of the electric power grid.
The toolkit
The engineering solutions to variability are well understood:
- Long-distance transmission to move surpluses from where the wind blows or sun shines to where demand is. Weather systems rarely becalm an entire continent at once.
- Storage to shift supply in time, from minutes to days.
- Demand flexibility, such as scheduling EV charging, water heating and some industrial loads for hours of high renewable output.
- Firm low-carbon capacity, such as hydropower, geothermal, nuclear, and eventually long-duration storage, for prolonged low-wind, low-sun periods.
The bottleneck is usually not technical feasibility but how fast transmission lines can be permitted and built, how quickly grid equipment such as transformers can be supplied, and whether policy is stable enough for investors to commit. New high-voltage lines can take a decade or more from proposal to operation in many countries.
Nuclear as a Low-Carbon Complement
Nuclear power is not renewable, since it consumes finite uranium, but it is low-carbon: the IPCC's AR5 lifecycle median is 12 gCO₂eq/kWh, the same as offshore wind and lower than utility solar's 48. Unlike wind and solar, a reactor runs around the clock regardless of weather.
In a high-renewable grid, nuclear's value is less about traditional "baseload" and more about firm capacity: power that is available during the cloudy, windless spells that storage struggles to cover. Its weakness is cost and build time for new plants. Lazard's 2026 analysis puts new US nuclear, based on the Vogtle 3 and 4 project in Georgia, at $175–255/MWh unsubsidised, well above wind and solar.
That is why the most cost-effective nuclear contribution in many countries is keeping existing reactors running through licence extensions and, in a few US cases, restarting closed plants. Small modular reactors (SMRs), factory-built designs of roughly 300 MW or less, aim to cut costs through standardisation, but none has yet demonstrated commercial-scale cost competitiveness in Western markets. The safety record, often the first question people raise, is examined in our article Is nuclear power safe? The real risks and benefits.
What Is Still Hard
Cheap wind and solar decarbonise electricity, but electricity is only part of total energy use. Several problems remain unsolved or expensive.
Green hydrogen: useful, but not for everything
Hydrogen made by splitting water with renewable electricity ("green hydrogen") is often pitched as a universal clean fuel. Its physics argue for a narrower role. Each conversion step loses energy: electrolysis, compression or liquefaction, storage, and then turning the hydrogen back into electricity in a fuel cell or turbine. Converting electricity to hydrogen and back typically returns well under half of the original energy, while a lithium-ion battery returns most of it. For storing and re-delivering electricity on a daily cycle, batteries win easily.
Where hydrogen makes sense is in uses that are hard to electrify directly: replacing coal in steelmaking through direct reduction of iron, producing ammonia for fertiliser and possibly for shipping fuel, and some high-temperature industrial processes. The production chemistry is explained in how green hydrogen is made.
Hard-to-abate sectors
- Aviation: batteries are far too heavy for long-haul flights; sustainable aviation fuels exist but are expensive and supply-constrained.
- Shipping: long ocean voyages need dense fuels; ammonia and methanol made with green hydrogen are leading candidates, still at an early commercial scale.
- Steel and cement: both release CO₂ from chemistry, not just from fuel. Cement in particular releases CO₂ when limestone is heated, which no fuel switch removes, so carbon capture is likely to be needed.
- Agriculture: methane from livestock and nitrous oxide from fertilisers cannot be solved with electricity at all.
Materials and supply chains
Concentration is itself a risk. The IEA's 2022 supply-chain report warned that China's share of key solar inputs (polysilicon, ingots and wafers) was set to reach almost 95%, leaving the world dependent on one country for most of a critical technology. Batteries face a similar pattern for refining lithium, graphite and other minerals. Diversifying supply raises costs in the short term but reduces the risk of disruption.
Land, permitting and public acceptance
Wind and solar have a low energy density per unit of land compared with fossil plants, so large build-outs need space and local consent. Rooftops, reservoirs and car parks help (one option is described in how floating solar panels work), but transmission corridors and large wind projects still face planning objections and long approval timelines in many countries.
Common Misconceptions
"Renewables can't run a grid because they're intermittent." Variability is real, but it is a system-design problem, not a hard physical barrier. Denmark's mostly renewable electricity system shows high shares are workable when backed by interconnection with neighbours, flexible demand and dispatchable resources.
"Solar panels take more energy to make than they produce." Lifecycle analysis contradicts this. The IPCC's lifecycle median of 48 gCO₂eq/kWh for utility solar, versus 820 for coal, already includes the energy and emissions of manufacturing the panels.
"Wind turbines could get more efficient forever." The Betz limit means no turbine can capture more than 59.3% of the wind's kinetic energy. Gains now come mostly from taller towers, bigger rotors and better sites, not from breaking that ceiling.
"Cheapest per kWh means cheapest system." LCOE ignores timing and firming. A grid planner has to pay for storage, transmission and backup too, which is why Lazard reports separate figures for solar and wind paired with storage.
Frequently Asked Questions
Q: What is the Shockley-Queisser limit and can it be broken? A: The Shockley-Queisser limit, roughly 33–34%, is the theoretical maximum efficiency of a single-junction solar cell in standard sunlight. It cannot be exceeded by single-junction designs, but multi-junction cells stack materials with different bandgaps to capture more of the spectrum. Under concentrated sunlight, laboratory multi-junction cells have exceeded 47%.
Q: Why can't wind turbines capture more than 59.3% of wind energy? A: The Betz limit is a consequence of fluid dynamics. A turbine extracts energy by slowing the air, but if it stopped the air entirely, no new air could pass through the rotor. The best balance comes when the air leaving the rotor moves at one-third of its incoming speed, which yields a maximum of 16/27, or 59.3%.
Q: How much did solar and wind costs fall? A: IRENA reports that the global weighted average cost of electricity from new utility-scale solar fell about 90% between 2010 and 2023, to $0.044/kWh, while new onshore wind averaged $0.033/kWh in 2023. Module prices fell from about $132 per watt in 1975 to about $0.27 per watt in 2024, in constant 2025 dollars (Our World in Data).
Q: How much of the world's electricity comes from wind and solar? A: According to Ember, wind supplied 8.1% and solar 6.9% of global electricity in 2024, about 15% combined, overtaking hydropower's 14.3%. Including nuclear, low-carbon sources supplied 40.9% of global electricity that year.
Q: How do batteries help the grid? A: Grid batteries store surplus power, such as midday solar, and release it during evening peaks. They also respond to frequency disturbances within milliseconds. The IEA says lithium-ion prices fell about 90% between 2010 and 2023, and 42 GW of battery storage was added to power systems in 2023.
Q: Why not use green hydrogen to store solar and wind power? A: Converting electricity to hydrogen and back loses most of the energy, while batteries return most of what they store. Hydrogen's better role is in sectors that are hard to electrify directly, such as steelmaking, fertiliser production and possibly shipping fuel, or for very long-duration seasonal storage.
Q: Is nuclear energy renewable? A: No. Nuclear uses finite uranium fuel, so it is not classified as renewable. It is low-carbon, though: the IPCC's lifecycle median is 12 gCO₂eq/kWh, the same as offshore wind. Many net-zero plans keep existing reactors running as firm power alongside wind and solar.
Related Tools and Reading
- Renewable Energy Calculator
- Climate Change Explained — The Science, Causes, and Consequences
- Complete Science Guide 2026
Sources
- IRENA (2024). Renewable Power Generation Costs in 2023. International Renewable Energy Agency. irena.org
- Ember (2025). Global Electricity Review 2025. ember-energy.org
- IEA (2024). Batteries and Secure Energy Transitions, executive summary. iea.org
- IEA (2024). Renewables 2023, executive summary. iea.org
- IEA (2022). Solar PV Global Supply Chains, executive summary. iea.org
- BloombergNEF (10 December 2024). "Lithium-Ion Battery Pack Prices See Largest Drop Since 2017, Falling to $115 per Kilowatt-Hour." about.bnef.com
- Lazard (2026). Levelized Cost of Energy+ (LCOE v19.0). lazard.com
- Our World in Data. "Solar (photovoltaic) panel prices" (1975–2024). ourworldindata.org
- IEA. "Will pumped storage hydropower expand more quickly than stationary battery storage?" iea.org
- IPCC (2014). Climate Change 2014: Mitigation of Climate Change, Working Group III, Annex III: Technology-specific Cost and Performance Parameters.
- Shockley, W. & Queisser, H.J. (1961). "Detailed Balance Limit of Efficiency of p-n Junction Solar Cells." Journal of Applied Physics, 32(3), 510–519.
- Betz, A. (1920). "Das Maximum der theoretisch möglichen Ausnützung des Windes durch Windmotoren." Zeitschrift für das gesamte Turbinenwesen.
- Way, R. et al. (2022). "Empirically grounded technology forecasts and the energy transition." Joule, 6(9), 2057–2082.
Follow new articles
Add SciHub101 to your feed reader to see new science and technology stories.
About the Author
SciHub101 is an independent science and technology publication founded and edited by Buğra Sözeri, a software engineer and app developer based in Türkiye. AI tools assist with drafting and research. Source documentation in the existing archive is uneven, and articles are being reviewed and corrected. The Editorial Team byline identifies editorial responsibility; it does not certify specialist or independent human review. Where we compare products, anything built by our own team is labelled as such — see the editorial guidelines and About page for how corrections and disclosures work.
Related Articles
AI & Environmental Impact Assessments: Automating Sustainability Reviews
How machine learning speeds up environmental impact assessments for infrastructure projects, from satellite-based biodiversity scans to supply-chain carbon models.
How EV Batteries Work: Lithium-Ion Explained
How EV batteries work: lithium-ion cell chemistry, pack design, battery management, charging, aging, and where solid-state and sodium-ion cells stand.
How AI Optimizes Renewable Energy Grids: What It Really Does
Solar and wind output swings with the weather, but a grid must balance supply and demand every second. Here is what machine learning actually does for grid operators, which claims are documented, and where the limits are.
Countries with the Most Wind Power Capacity (2025 Ranked)
China has about 641 GW of installed wind capacity, nearly half of the world's roughly 1,291 GW. The United States, Germany, India, and Brazil follow. Denmark ranks 17th by capacity but gets about 59% of its electricity from wind. Here is the 2025 ranking, what it measures, and what it leaves out.
Grid-Scale Battery Storage: The Missing Piece of the Energy Transition
Solar and wind are cheap but not dispatchable. Grid-scale battery storage fills the gap for hours, not weeks. This article covers how the systems work, how fast costs fell, what Hornsdale and California showed, and where batteries still fall short.
Countries That Produce the Most Solar Power (Ranked)
China installed 278 GW of new solar capacity in 2024 alone — more than the entire installed base of the United States. With 888 GW of total solar PV capacity, China now hosts nearly half of all solar power on Earth. This article ranks the top solar nations by installed capacity and explains how the global solar revolution became so geographically concentrated.