Countries That Produce the Most Solar Power (Ranked)
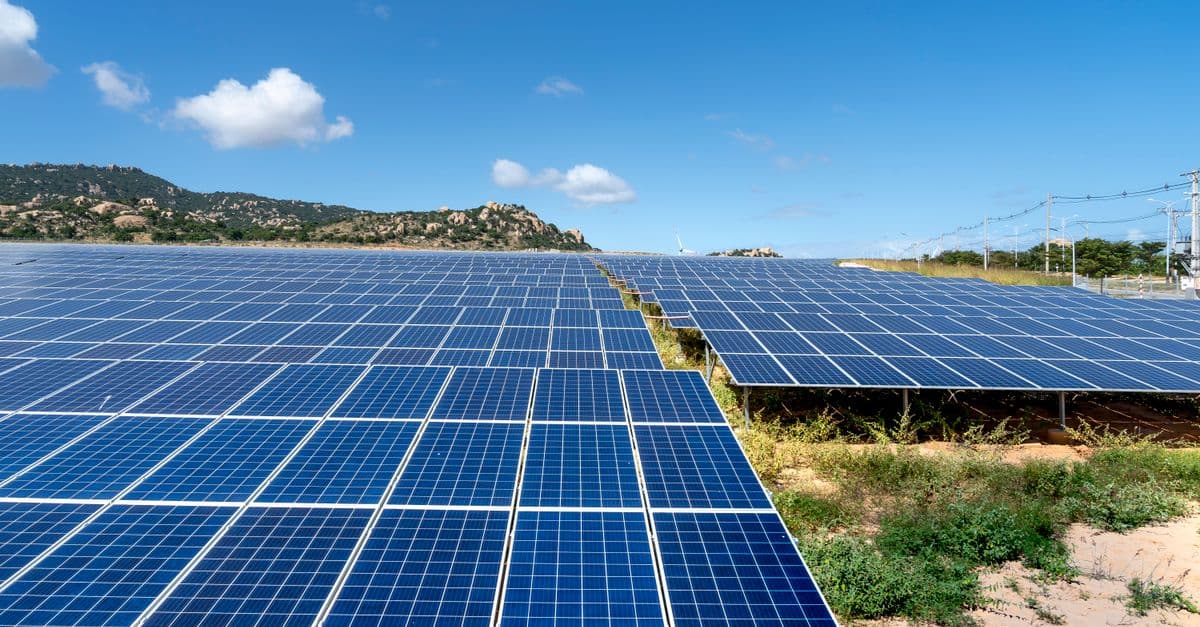
Photo: Quang Nguyen Vinh / Pexels
China installed 278 GW of new solar capacity in a single year — 2024 — adding more generating capacity than the United States has built cumulatively in its entire history of solar development. By the end of 2024, China's total solar photovoltaic capacity reached 888 GW, representing nearly half of all solar power capacity on the planet. Global solar capacity crossed the 2 terawatt threshold in 2024, a milestone that would have seemed implausible as recently as 2015. The story of who builds solar power, where, and at what pace, is one of the defining energy stories of the 21st century.
Methodology
Q: How is solar power capacity measured, and what is the difference between capacity and generation? A: Installed capacity is measured in gigawatts (GW) and represents the maximum output a solar installation can theoretically produce under ideal conditions (full sun, standard temperature). It is distinct from actual electricity generation, measured in terawatt-hours (TWh) per year, which depends on how many hours of sunlight a location receives, cloud cover, panel efficiency, and how often panels are in use. A 100 GW solar park in the Sahara will generate far more electricity annually than the same capacity in Scotland. Rankings by installed capacity favor countries that build a lot regardless of their sunlight resources; rankings by generation add the geographic dimension. IRENA's Renewable Capacity Statistics, published annually, are the standard authoritative source for installed capacity by country. Generation data comes from IEA and national grid operators.
Source: IRENA, Renewable Capacity Statistics 2025 (data as of end-2024) — https://www.irena.org/Publications/2025/Mar/Renewable-capacity-statistics-2025
Top countries by solar PV installed capacity (end of 2024)
| Rank | Country | Installed capacity (GW) | Share of world total | 2024 additions (GW) |
|---|---|---|---|---|
| 1 | China | 887.9 | ~47.6% | 278.0 |
| 2 | United States | 177.5 | ~9.5% | 38.3 |
| 3 | India | 97.4 | ~5.2% | 24.5 |
| 4 | Germany | 90.0 | ~4.8% | 18.8 |
| 5 | Japan | 91.6 | ~4.9% | ~7.5 |
| 6 | Brazil | 53.1 | ~2.8% | ~15.2 |
| 7 | Spain | 38.6 | ~2.1% | ~5.8 |
| 8 | Australia | 38.5 | ~2.1% | ~7.2 |
| 9 | Italy | 36.0 | ~1.9% | ~6.0 |
| 10 | South Korea | 26.7 | ~1.4% | ~3.0 |
| 11 | Netherlands | 24.1 | ~1.3% | ~3.5 |
| 12 | Turkey | 19.9 | ~1.1% | ~5.0 |
| 13 | Vietnam | 18.7 | ~1.0% | ~1.0 |
| 14 | France | 21.5 | ~1.2% | ~4.0 |
| 15 | Mexico | 12.0 | ~0.6% | ~2.0 |
Source: IRENA, Renewable Capacity Statistics 2025 — https://www.irena.org/Publications/2025/Mar/Renewable-capacity-statistics-2025
Cross-reference: IEA, Renewables 2024 — https://www.iea.org/reports/renewables-2024
Historical context: from niche technology to global infrastructure
Solar photovoltaics began as a niche technology for satellites and remote installations. The first practical silicon solar cell was demonstrated at Bell Labs in 1954 with an efficiency of 6 percent. It cost approximately $286 per watt — roughly 4,000 times more than electricity from coal. The technology remained too expensive for mainstream power generation for decades, finding applications in calculators, remote sensors, and spacecraft where cost was secondary to reliability and the absence of fuel requirements.
The economics changed slowly through the 1990s and early 2000s as manufacturing scaled and efficiency improved, then changed catastrophically fast from the mid-2000s onward. German solar policy — the Renewable Energy Sources Act (Erneuerbare-Energien-Gesetz or EEG) of 2000 — created a guaranteed feed-in tariff that paid solar producers well above market rates. Demand surged, manufacturing investment followed, and costs began to fall. Germany became the world's largest solar market through the first decade of the 21st century, and German demand funded the manufacturing learning curve that would make Chinese production economically dominant.
By 2010, China had recognized solar manufacturing as a strategic industry and began deploying state-directed investment in panel production at industrial scale. Chinese manufacturers — led by companies including Jinko Solar, LONGi Green Energy, Trina Solar, and Canadian Solar (despite its name, headquartered in Guelph, Ontario, with manufacturing in China) — drove the cost of solar panels from approximately $2 per watt in 2010 to below $0.20 per watt by 2024. The 90 percent cost reduction in 14 years is one of the fastest declines of any technology in industrial history.
Source: IEA, Tracking Clean Energy Progress 2024 — https://www.iea.org/reports/tracking-clean-energy-progress-2024
China: why one country has half the world's solar
China's dominance in solar is not an accident. It is the result of deliberate industrial policy, massive domestic deployment targets, state financing of manufacturing, and an electricity system that needed enormous new capacity to replace coal and power rapid economic growth.
The scale is difficult to comprehend. China installed 278 GW of solar in 2024 — equivalent to one large nuclear power plant coming online every two days, for the entire year. Chinese solar deployment in 2024 alone exceeded Germany's total cumulative solar installations over the entire history of that country's solar program. The 888 GW total at year-end represents 47.6 percent of all solar capacity on Earth, in a country that is home to 17.5 percent of the global population.
The policy machinery behind this scale includes the 14th Five-Year Plan (2021–2025), which set renewable energy capacity targets well above market expectations; subsidized land for solar parks; local government mandates requiring new buildings to include rooftop solar; state-owned utility procurement programs; and export financing through the China Development Bank that has helped Chinese manufacturers capture global markets. China has also developed the world's most integrated solar supply chain, controlling approximately 80 percent of global solar panel manufacturing at each major stage — polysilicon, wafers, cells, and modules.
China's internal geography also helps. The western provinces — Xinjiang, Gansu, Inner Mongolia, Qinghai — have vast flat land and high solar irradiance. Hundreds of gigawatts of utility-scale solar have been built in these desert regions, connected to coastal industrial centers by ultra-high-voltage transmission lines spanning thousands of kilometers.
Source: IRENA, Renewable Power Generation Costs 2023 — https://www.irena.org/publications/2024/Sep/Renewable-Power-Generation-Costs-in-2023
United States: large but second by a large margin
The United States had 177 GW of solar capacity at the end of 2024, added 38 GW during the year, and trails China by a factor of five. American solar deployment has accelerated significantly under the Inflation Reduction Act (IRA) of 2022, which provides production tax credits, investment tax credits, and domestic content bonuses for solar manufacturers and deployers. The US solar industry added more capacity in 2023 and 2024 combined than in all previous years of deployment, reflecting the IRA's investment signal.
The US solar market is geographically concentrated in sun-rich states: California, Texas, Florida, and Arizona together account for a majority of installed capacity. California pioneered US utility-scale solar and still leads by installed base. Texas, driven by its independent electricity grid (ERCOT) and abundant land, has become the fastest-growing solar market. Florida's "Sunshine State" brand has finally materialized in its energy system.
Despite the IRA boost, the US faces structural challenges the Chinese market does not. Permitting for utility-scale solar projects takes years longer in the US than in China; grid interconnection queues are backed up by hundreds of gigawatts of projects waiting to connect; and the domestic manufacturing supply chain remains thin relative to Chinese dominance of panel production.
Source: US EIA, Electric Power Monthly, February 2025 — https://www.eia.gov/electricity/monthly/
India: world's fastest-growing major solar market
India's 97 GW of solar capacity at end-2024 — third globally — represents extraordinary growth from a near-zero base a decade ago. India added 24.5 GW in 2024 alone, making it the second-largest annual market globally after China. The Indian government's National Solar Mission, launched in 2010, set a series of progressively more ambitious targets that have consistently been met or exceeded. The current target of 500 GW of renewable energy capacity by 2030 — of which solar is the dominant component — keeps India's growth trajectory on track to surpass the US in total installed solar within a few years.
India's solar geography is favorable: large portions of the country receive over 5 kWh per square meter per day of solar irradiance, significantly more than Germany or Japan. The Rajasthan and Gujarat deserts host massive utility-scale solar parks; rooftop solar programs have extended to tier-2 and tier-3 cities. The cost of solar in India, benefiting from Chinese panel supply chains and low labor costs, is among the lowest in the world, making new solar capacity the cheapest source of new electricity in India by a substantial margin.
Source: Ministry of New and Renewable Energy, India — https://mnre.gov.in/
Germany: Europe's solar leader despite clouds
Germany's 90 GW of solar capacity is remarkable given its geography. Germany receives less sunlight than Spain or Italy — the southern German city of Munich receives roughly the same solar irradiance as Alaska. Yet Germany built Europe's largest solar fleet, driven by policy ambition rather than natural advantage. The EEG feed-in tariff system created economic certainty that drove deployment irrespective of the solar resource's mediocrity.
Germany also illustrates solar's role in energy system transformation. In 2023, Germany generated approximately 12 percent of its electricity from solar. On summer days with high sun and low demand, solar frequently covers 50–60 percent of German electricity consumption. Germany shut down its last nuclear power plants in April 2023, a decision controversial in energy and climate circles; the gap is being filled by a combination of wind, solar, gas, and grid imports. Germany's solar fleet is predominantly rooftop installations on residential and commercial buildings, unlike the utility-scale dominated Chinese and US fleets.
Source: Fraunhofer ISE, Energy Charts, Germany — https://www.energy-charts.info/
Australia: solar per capita world leader
Australia does not rank in the top five globally, but by solar capacity per capita it leads the world. With approximately 38.5 GW for 26 million people, Australia has roughly 1.5 kW of solar capacity per person — the highest ratio of any significant economy. This reflects both excellent solar resources (Australia is one of the sunniest inhabited continents on Earth) and a rooftop solar adoption rate that is, by international standards, extraordinary.
Approximately one-third of Australian households have rooftop solar — the highest adoption rate in the world. The payback period for residential solar in Australia is typically 3–6 years, making it one of the most economically rational consumer energy investments available anywhere. Australia's grid, dominated by coal historically, is undergoing a faster transition than almost any other developed country as solar and wind costs undercut old coal plants.
Source: Clean Energy Council, Clean Energy Australia Report 2024 — https://www.cleanenergycouncil.org.au/resources/resources-hub/clean-energy-australia-report
Capacity vs Generation: Why China's Lead Is Bigger Than It Looks
The ranking table above, sorted by installed GW of capacity, actually understates China's dominance in solar. To understand why, it is necessary to distinguish between two fundamentally different measurements: installed capacity (what a system could produce at peak) and actual generation (what it does produce over a year).
Installed capacity is measured in gigawatts (GW) and represents the maximum output under ideal conditions — full sun, optimal temperature, clean panels. A 1 GW solar farm does not produce 1 GW continuously; it produces that only at peak sun on the clearest day. The ratio of actual annual generation to theoretical maximum generation is called the capacity factor.
Capacity factors vary substantially by geography. A solar installation in Xinjiang, China's sunniest northwestern region, receives solar irradiance of approximately 1,400–1,800 kWh per square meter per year, giving it an annual capacity factor of roughly 15–20 percent. The same capacity in Germany — with approximately 1,000–1,100 kWh/m² per year — operates at a capacity factor of 10–12 percent. Desert regions in the US Southwest (Arizona, Nevada, California's Inland Empire) achieve 25–30 percent. The UAE and Saudi Arabia achieve 24–28 percent. This means a gigawatt of US desert solar generates roughly twice the electricity annually as a gigawatt of German solar.
China's actual generation dwarfs all competitors. According to Ember's Global Electricity Review data, China generated 834 TWh of solar electricity in 2024 — representing 39 percent of all solar electricity generated worldwide. The United States generated approximately 280 TWh, India around 120 TWh, and Germany around 65 TWh. China's share of actual generation (39 percent) slightly exceeds its share of installed capacity (47.6 percent) in some cross-comparisons, but the sheer scale makes the installed-capacity advantage even more compelling: China produced more solar electricity in 2024 than the rest of the top five countries combined.
In 2023, China was responsible for half of global solar PV generation growth — a single country driving 50 percent of the world's increase in solar electricity output in a year when global solar generation grew by a record 320 TWh.
Curtailment: the growing constraint. China's extraordinary capacity additions have begun to outpace the transmission infrastructure needed to move electricity from resource-rich northwestern provinces to population-dense coastal demand centers. Curtailment — solar electricity generated but then deliberately dumped because the grid cannot absorb it — has become a material issue. In early 2024, seven provinces and regions exceeded 10 percent curtailment rates, and national curtailment of solar power exceeded 5 percent in March 2024 — an alarm level previously set by the government as a policy threshold. Xinjiang and Gansu, with the largest utility-scale solar parks and the weakest local demand relative to output, have the highest curtailment rates. China's National Energy Administration responded by raising the allowed provincial curtailment threshold from 5 percent to 10 percent in June 2024, a pragmatic accommodation that allows construction to continue while grid upgrades catch up. China has invested approximately $75 billion per year in grid infrastructure since 2010, reducing system-wide curtailment from 16 percent in 2012 to under 3 percent by recent averages — but the rapid 2023–2024 capacity additions have pushed the figure back up in specific regions.
The curtailment issue illustrates a structural challenge for very fast solar deployment: generation capacity can be built faster than the transmission and storage infrastructure needed to deliver its output. This is not unique to China — similar grid interconnection queues constrain deployment in the United States — but it is most acute where the fastest capacity additions are occurring.
2023–2024 additions: a step change. The pace of Chinese solar deployment in 2023–2024 represented a step change even relative to China's own prior record. China commissioned more new solar capacity in 2023 alone than the entire world had commissioned in 2022. In 2024, the 277 GW of new Chinese capacity was more than six times the US additions of 38 GW. At this pace, China's total installed solar capacity will surpass 1 terawatt — 1,000 GW — by the end of 2025 or early 2026, a threshold that would have seemed implausible as recently as 2020 when China's total stood at 253 GW.
Source: Ember, Global Electricity Review 2025 — https://ember-energy.org/latest-insights/global-electricity-review-2025/global-electricity-source-trends/
Source: Ember, China Energy Trends — https://ember-energy.org/countries-and-regions/china/
Source: IEA, Curtailment and Renewable Energy Market Update June 2023 — https://www.iea.org/reports/renewable-energy-market-update-june-2023/will-more-wind-and-solar-pv-capacity-lead-to-more-generation-curtailment
Source: US EIA, China's Solar Capacity Installations Grew Rapidly in 2024 — https://www.eia.gov/todayinenergy/detail.php?id=65064
Solar generation vs. capacity: the sunlight gap
Installed capacity rankings overstate the advantage of cloudy countries. When measured by actual electricity generation, the rankings shift.
France's 21.5 GW of solar generates roughly the same electricity annually as Germany's 90 GW would suggest if it operated at German irradiance levels — but in fact Germany's capacity factors are only slightly below France's because Germany has invested in higher-efficiency panels. The more dramatic gap is between China and desert nations: a gigawatt of solar in the Xinjiang desert operates at a capacity factor of 18–22 percent, while a gigawatt in the US Southwest (Nevada, Arizona) operates at 25–30 percent. The Middle East and North Africa — with some of the world's highest irradiance — would dominate a generation-normalized solar ranking if their installed capacity matched their solar resource.
The UAE's Mohammed bin Rashid Al Maktoum Solar Park — one of the world's largest single solar parks at 5 GW when complete — produces electricity for approximately $0.013–0.015 per kWh, among the lowest prices ever recorded for electricity of any type. The Gulf region, with its abundant flat desert land, cheap financing, and extraordinary irradiance, is poised to become one of the world's major solar power zones in the 2030s.
Source: IRENA, Renewable Power Generation Costs 2023 — https://www.irena.org/publications/2024/Sep/Renewable-Power-Generation-Costs-in-2023
The economics: why solar is now the cheapest electricity in history
The cost of solar electricity has fallen faster than almost any technology ever tracked. The International Renewable Energy Agency (IRENA) reported that the global weighted average cost of utility-scale solar was approximately $0.044 per kWh in 2023 — a 90 percent reduction from 2010. In some markets with optimal conditions (Saudi Arabia, Chile, the UAE), unsubsidized solar has been contracted at prices below $0.02 per kWh — cheaper than any conventional energy source.
This cost trajectory has self-reinforcing dynamics. Lower costs increase deployment; greater deployment increases manufacturing volume; greater volume drives further cost reductions through learning-by-doing. The solar industry has followed Wright's Law — a consistent 20–30 percent cost reduction for every doubling of cumulative production — with remarkable fidelity for four decades.
The consequence is that in most of the world, new solar capacity is now the cheapest source of new electricity, cheaper than new coal, gas, nuclear, or hydro at the point of installation. This economic logic, more than any policy or mandate, is driving the explosive growth in global solar deployment.
Source: IRENA, Renewable Power Generation Costs 2023 — https://www.irena.org/publications/2024/Sep/Renewable-Power-Generation-Costs-in-2023
Frequently asked questions
Q: Which country generates the most solar electricity (not just capacity)? A: China generates more solar electricity in absolute terms than any other country, consistent with its dominant installed base. The US is second. In terms of solar share of total electricity consumption, some smaller European countries — particularly Italy, Spain, and the Netherlands — achieve higher percentages despite smaller absolute generation, because their total electricity consumption is smaller. Germany achieved approximately 12 percent solar share in 2023; Italy approached 15 percent in sunny periods.
Q: How much of the world's electricity comes from solar? A: Approximately 6–7 percent of global electricity generation came from solar PV in 2023–2024, according to IEA data. This share is growing rapidly — it was under 4 percent in 2020. At current growth rates, solar is projected to supply 20 percent of global electricity by the early 2030s.
Q: Why does Germany have so much solar despite having poor sunlight? A: Germany's solar deployment was driven by strong feed-in tariffs under the Renewable Energy Sources Act, which guaranteed above-market prices for solar electricity for 20 years. This economic certainty triggered massive investment from the mid-2000s to early 2010s. Germany's geography is actually not disqualifying — its irradiance is similar to regions of the US Midwest that have deployed significant solar. Sunlight, while helpful, is secondary to economics and policy in determining deployment.
Q: Is solar power enough to replace coal and gas globally? A: Theoretically, yes — the Earth receives approximately 10,000 times more energy from the sun than humanity currently uses. Practically, the challenge is intermittency: solar generates only during daylight hours and varies with weather. Replacing firm baseload generation requires either storage (batteries, pumped hydro), grid balancing across geographies, or complementary generation (wind, hydro, nuclear). All of these are deployable at scale; the transition challenge is one of engineering, economics, and logistics, not of fundamental resource constraint.
The takeaway
The global solar revolution is real, rapid, and massively concentrated in China. The country that pioneered the carbon age is now leading the solar age, adding more generating capacity annually than many countries' entire electricity systems. The United States, India, and Germany are substantial forces but collectively smaller than China's annual additions. The economic case for solar is now essentially closed — it is the cheapest new electricity source in most of the world. The remaining questions are about grid integration, storage, and whether the political will exists to retire fossil fuel assets that cannot compete on cost alone.
Sources
- IRENA, Renewable Capacity Statistics 2025 — https://www.irena.org/Publications/2025/Mar/Renewable-capacity-statistics-2025
- IEA, Renewables 2024 — https://www.iea.org/reports/renewables-2024
- IEA, Tracking Clean Energy Progress 2024 — https://www.iea.org/reports/tracking-clean-energy-progress-2024
- IRENA, Renewable Power Generation Costs 2023 — https://www.irena.org/publications/2024/Sep/Renewable-Power-Generation-Costs-in-2023
- US EIA, Electric Power Monthly, February 2025 — https://www.eia.gov/electricity/monthly/
- Ministry of New and Renewable Energy, India — https://mnre.gov.in/
- Fraunhofer ISE, Energy Charts, Germany — https://www.energy-charts.info/
- Clean Energy Council, Clean Energy Australia Report 2024 — https://www.cleanenergycouncil.org.au/resources/resources-hub/clean-energy-australia-report
- Ember, Global Electricity Review 2025 — https://ember-energy.org/latest-insights/global-electricity-review-2025/global-electricity-source-trends/
- Ember, China Energy Trends — https://ember-energy.org/countries-and-regions/china/
- IEA, Renewable Energy Market Update June 2023 (curtailment) — https://www.iea.org/reports/renewable-energy-market-update-june-2023/will-more-wind-and-solar-pv-capacity-lead-to-more-generation-curtailment
- US EIA, China's Solar Capacity Installations Grew Rapidly in 2024 — https://www.eia.gov/todayinenergy/detail.php?id=65064
Related Reading
Follow new articles
Add SciHub101 to your feed reader to see new science and technology stories.
About the Author
SciHub101 is an independent science and technology publication founded and edited by Buğra Sözeri, a software engineer and app developer based in Türkiye. AI tools assist with drafting and research. Source documentation in the existing archive is uneven, and articles are being reviewed and corrected. The Editorial Team byline identifies editorial responsibility; it does not certify specialist or independent human review. Where we compare products, anything built by our own team is labelled as such — see the editorial guidelines and About page for how corrections and disclosures work.
Related Articles

Countries That Recycle the Most (Municipal Waste Recycling Rates Ranked)
Austria recycles or composts 62.8% of its municipal waste — the highest rate in the European Union, the benchmark organization for standardized recycling statistics. Germany follows at approximately 67% when historical figures are used, with ten EU countries exceeding 50%. Outside Europe, South Korea leads Asia with an overall recycling and recovery rate that exceeds 80% through a deposit-refund system widely studied as a global model.
Countries That Emit the Most CO2 (Ranked)
China emits 12.3 billion tonnes of CO2 per year — 32% of the global total — making it by far the world's largest emitter. The United States is second at 4.9 Gt, India third at roughly 3.4 Gt. Together the top three nations account for more than half of all fossil fuel CO2 emissions on Earth. Here is the full country ranking with methodology, per-capita figures, and historical context.
Countries Leading in Renewable Energy (2026 Ranked)
China has installed more renewable energy capacity than the rest of the world combined — 1,453 GW by 2026, mostly solar and wind. The US (490 GW), Brazil (190 GW), Germany (180 GW), and India (175 GW) follow. Iceland and Norway run on 99-100% renewable electricity. Here's who's actually decarbonizing — and who's pretending.
Countries with the Most Wind Power Capacity (2025 Ranked)
China has 440 GW of installed wind capacity — more than the rest of the world combined. Denmark generates over 50% of its electricity from wind. The US has 145 GW. Offshore wind is expanding rapidly. Global wind capacity has grown 10-fold in 15 years. Here's the full wind power ranking.

Direct Air Capture: How It Works, What It Costs, and Where It Fits
Direct air capture (DAC) machines pull carbon dioxide out of ambient air through chemical reactions, compress it, and either store it underground or use it in industrial processes. The technology works. The problem is energy and cost: today's plants spend between $400 and $1,000 per tonne of CO₂ removed, while nature-based alternatives cost $5–50 per tonne. DAC's role in climate strategy depends on whether those costs can fall by an order of magnitude — and how quickly.
Countries That Consume the Most Electricity (Ranked)
China consumes more electricity than any other country — approximately 9,794 TWh in 2024, nearly 33 percent of global demand and more than the United States, India, Russia, and Japan combined. The United States ranks second at roughly 4,194 TWh. India is third and the fastest-growing major consumer. But total consumption obscures vast per-capita differences: Iceland, Norway, and Canada use far more electricity per person than China or India. This ranking covers total and per-capita electricity consumption with IEA and Ember data, methodology notes, and analysis of what drives the gaps.