Countries with the Most Wind Power Capacity (2025 Ranked)
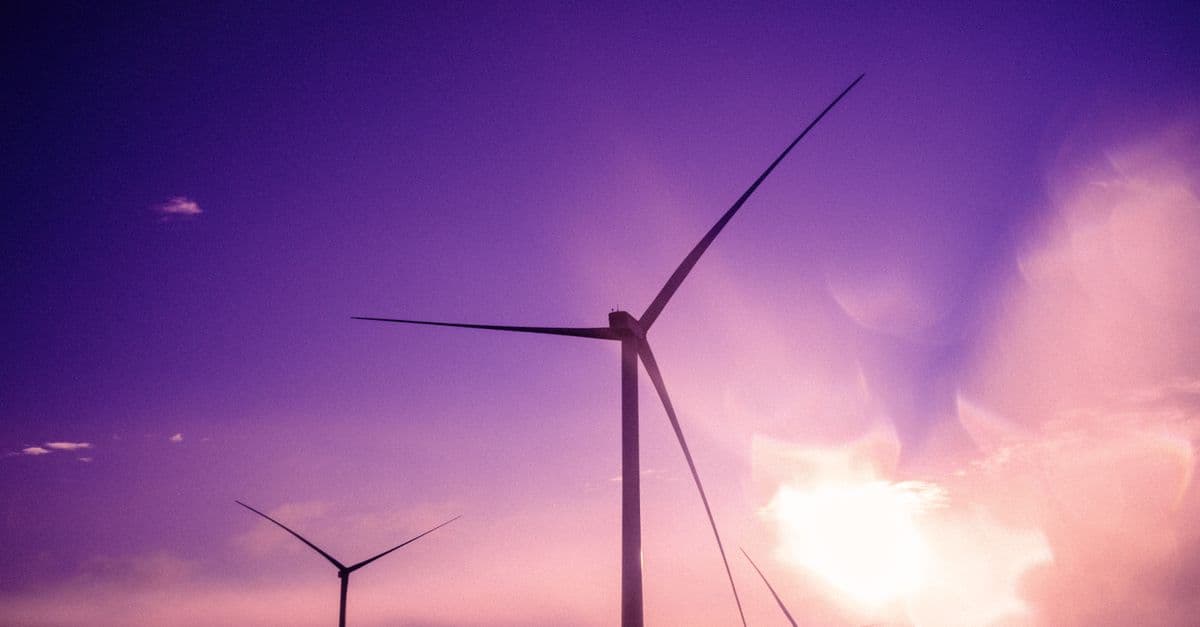
Photo: Khoa Võ / Pexels
China had about 641 gigawatts (GW) of installed wind capacity in 2025, according to Ember's data, which is close to half of the world's total of roughly 1,291 GW. The United States comes second at about 159 GW, Germany third at about 78 GW. But capacity is only one way to rank wind power, and it flatters countries that build fast over countries that use wind well. This article gives the 2025 top 20, explains where the numbers come from, and shows why Denmark, ranked 17th, is the country everyone cites.
Key takeaways
- China has about 641 GW, roughly 49.6% of the 1,291 GW world total by Ember's figures. That is the largest share by far, though it does not exceed the rest of the world combined.
- The top five countries (China, the United States, Germany, India, Brazil) hold about 75% of global capacity. The top 20 hold about 93%.
- Denmark gets about 59% of its electricity from wind from a fleet of 7.55 GW, a small fraction of China's. Capacity rank and share of the grid are different questions.
- Wind produced about 8.55% of world electricity in 2025, but solar overtook wind globally for the first time that year (see countries that produce the most solar power).
- Global wind installations reached a record 117 GW in 2024, according to the Global Wind Energy Council (GWEC), which says annual installations would need to reach 320 GW by 2030 to meet the goals it is pursuing.
Countries with the most installed wind capacity
The table ranks countries by installed capacity in 2025. Generation and share of electricity come from the same Ember dataset, so every row has one source and one year.
| Rank | Country | Capacity (GW) | Generation (TWh) | Share of generation | Capacity growth |
|---|---|---|---|---|---|
| 1 | China | 640.63 | 1,135.43 | 10.73% | 22.9% |
| 2 | United States | 158.83 | 464.39 | 10.27% | 4.1% |
| 3 | Germany | 77.81 | 136.03 | 27.18% | 7.0% |
| 4 | India | 54.51 | 103.98 | 5.00% | 13.2% |
| 5 | Brazil | 34.87 | 117.58 | 15.67% | 5.9% |
| 6 | United Kingdom | 33.40 | 85.84 | 29.37% | 3.9% |
| 7 | Spain | 33.30 | 58.76 | 20.40% | 3.5% |
| 8 | France | 25.65 | 46.46 | 8.15% | 5.8% |
| 9 | Canada | 17.74 | 51.48 | 7.89% | 2.0% |
| 10 | Sweden | 17.38 | 38.90 | 22.84% | 3.3% |
| 11 | Australia | 16.35 | 39.29 | 13.70% | 5.1% |
| 12 | Turkey | 14.78 | 39.42 | 11.14% | 14.8% |
| 13 | Italy | 13.57 | 21.48 | 8.11% | 4.7% |
| 14 | Netherlands | 11.78 | 33.70 | 24.97% | 0.7% |
| 15 | Poland | 10.60 | 23.98 | 13.90% | 4.4% |
| 16 | Finland | 9.38 | 22.58 | 27.44% | 12.2% |
| 17 | Denmark | 7.55 | 20.28 | 58.73% | 0.5% |
| 18 | Mexico | 7.51 | 21.38 | 5.99% | 0.0% |
| 19 (tie) | Japan | 6.24 | 12.85 | 1.25% | 6.5% |
| 19 (tie) | Vietnam | 6.24 | 14.37 | 4.64% | 1.0% |
| World | 1,291.23 | 2,711.90 | 8.55% | 14.0% |
Source: Ember, 2025 data, as compiled in Wikipedia's "Wind power by country" table. Ranking by capacity is a sort of Ember's capacity column; the page does not publish a ranking itself. Shares for the top five and top 20 in the text are my arithmetic from this table.
Three patterns jump out of the numbers. The first is concentration. China and the United States together hold about 62% of the world's wind capacity, and the top 10 hold about 85%. The second is a split in speed. China's fleet grew 22.9% in 2025 and India's 13.2%, while Denmark's, the Netherlands', and Mexico's were nearly flat. The third is that share of electricity bears little relation to rank. Denmark is 17th by capacity and first by share among these 20 countries, while China, with 85 times Denmark's capacity, gets about 11% of its generation from wind.
Where this data comes from
Wind rankings blend several kinds of statistics, and they disagree in small ways. This one uses Ember, an energy data organization that compiles figures from sources such as the U.S. Energy Information Administration, Eurostat, and national statistics bureaus into a yearly electricity dataset released under a Creative Commons license (CC-BY-4.0). Ember's data covers capacity in gigawatts, generation in terawatt-hours, and share of total generation.
Other publishers give slightly different totals. The Global Wind Energy Council (GWEC) publishes an annual report on installations, and the International Renewable Energy Agency (IRENA) publishes its own capacity statistics. Agencies can also differ on definitions, for instance grid-connected capacity versus capacity that has been installed but not yet connected. For the United States, the Energy Information Administration puts wind at 10.48% of 2025 generation, against Ember's 10.27%. Whenever you compare two rankings, check which year, which cutoff, and which source each uses.
One unit is worth defining. A gigawatt is a billion watts, so 1 GW of wind capacity is the output of 1 GW of turbines running at full power. Real turbines almost never do. They produce on average a fraction of their nameplate capacity, called the capacity factor (the ratio of actual output over a period to the maximum possible output). A 100-megawatt wind farm with a 35% capacity factor yields as much electricity over a year as a 35-megawatt plant running flat out.
What capacity rank hides
Rank by capacity tells you how much metal is standing in the field. It does not tell you how much electricity comes out, how much of a country's demand it meets, or how well it fits the grid.
Output per gigawatt differs a lot. Dividing each country's 2025 generation by its year-end capacity and by the 8,760 hours in a year gives a rough utilization figure:
| Country | Implied utilization (2025) |
|---|---|
| Brazil | about 38% |
| United States | about 33% |
| Canada | about 33% |
| United Kingdom | about 29% |
| Sweden | about 26% |
| India | about 22% |
| China | about 20% |
| Germany | about 20% |
Method: my arithmetic from the Ember capacity and generation figures above. Because the calculation uses year-end capacity, it understates utilization in fast-growing markets such as China and India, where much of the fleet was not running all year. It is a rough guide, not a measured capacity factor.
The same rough method puts the whole world at about 24% (2,711.9 TWh of generation from 1,291 GW of year-end capacity), which is again a floor given that the fleet grew 14% in the year. Wikipedia's wind power article gives 35% to 44% as typical estimates for modern installations, which fits the idea that utilization depends heavily on turbine design, siting, and curtailment. Brazil and the United States stand out at the top of the utilization list, which points to strong wind resources, while Germany and China sit near 20%. Reasons could include siting, turbine design, curtailment, and, for China, the fast growth noted above. The data here do not separate those causes.
China: the wind superpower
China's number is hard to appreciate without the history. Its wind capacity was about 442.9 GW at the end of 2023, according to the figure in Wikipedia's "Wind power in China" article. By the end of 2025, Ember puts it at 640.63 GW. Working back from Ember's 22.9% growth rate, that implies China added about 119 GW in a single year, which is more than 75% of the entire United States fleet. Wind and solar combined reached 1,200 GW in 2024, six years ahead of China's own 2030 target, according to the same article.
The scale comes from policy and industry together: government targets, state-backed finance, and a domestic manufacturing base that supplies the turbines. According to Wood Mackenzie, Chinese manufacturers secured 78% of the 176 GW of wind installations worldwide in 2025 (reported on Wikipedia's Vestas page). Goldwind is the largest domestic maker, and by that count Vestas, the Danish pioneer, ranked only seventh globally in 2025.
The curtailment problem
Building turbines is easier than moving their output. China's best wind resources are in the north and northwest, while much of its electricity demand is on the eastern coast. In the early years of the build-out, grids in wind-rich regions could not absorb all the power. The Wikipedia article reports that nearly 34 TWh was curtailed (wasted, because turbines were switched off) in North China alone in 2015, and that 1.75 TWh was lost in the first half of 2015 according to the National Energy Administration. Curtailment has been a recurring theme in how analysts judge wind: capacity that cannot deliver is not counted in the grid's favor.
Offshore at scale
China is also the largest offshore wind market. As of the third quarter of 2024, about 39.1 GW of offshore capacity was connected to its grid, the most of any country and up from under 5 GW in 2018, according to Wikipedia's article on Chinese wind power.
Denmark: wind as national identity
Denmark is the country that makes the capacity ranking look incomplete. Its fleet is 7.55 GW, about 1.2% of China's. It generates 20.28 TWh from that fleet, and Ember puts wind at 58.73% of its 2025 generation. The Wikipedia article on Danish wind power cites 59.3% of total generation in 2024.
A century of tinkering
The roots are old. Poul la Cour experimented with wind power around 1900, and Denmark became a pioneer of commercial wind power in the 1970s. The energy crises of 1973 and 1979 left the country dependent on imported oil and coal, which pushed per-capita carbon dioxide emissions high in the 1980s, and a 1985 law banned new nuclear plants. Wind became the domestic alternative.
Ownership helped. Wind turbine cooperatives became a major part of the sector, and by 2001 more than 100,000 Danish families belonged to them, owning 86% of Denmark's turbines. The share dropped to 75% by 2004 as private investors entered. A famous case is Middelgrunden, a wind farm of 20 turbines about 3.5 kilometers from Copenhagen, which a cooperative of 10,000 investors owns 50% of. That kind of local ownership is a plausible reason Danish wind has met less public resistance than in countries where developers are distant companies, though acceptance depends on many factors beyond ownership.
Two companies that shaped the industry
Vestas traces its roots to 1898, when Hans Smith Hansen bought a blacksmith shop in Lem, in West Jutland. The company moved through household appliances and agricultural equipment, entered the wind turbine business in 1979, and made only wind turbines from 1989. In 2019 it became the first company to install 100 GW of wind turbines, according to a Vestas press release.
Ørsted has a different path. It began as Dansk Naturgas, founded in 1972 to manage Danish North Sea oil and gas, became DONG Energy in 2005, and in 2017 phased out coal, sold its oil and gas business to Ineos for US$1.05 billion, and renamed itself after the Danish scientist Hans Christian Ørsted. As of January 2022 it was the world's largest developer of offshore wind farms by number built, and it developed about 30% of global offshore capacity outside mainland China, according to Wikipedia's company article. Its big projects include Hornsea 1 and 2 in the United Kingdom.
How a small country handles a wind-heavy grid
Denmark's trick is its neighbors. The Wikipedia article reports that its electricity interconnection level was 44% in 2015 and has increased since, with links to Norway, Sweden, and Germany. On windy days, the country can export. In July 2015, wind produced 116% of national consumption in the evening and over 140% of demand at 3 a.m. On calm days it imports, and it keeps about 6 GW of conventional plants as backup. The arrangement works in part because weather in Denmark does not always match weather across its neighbors' territory, and hydropower-rich neighbors can act somewhat like a battery. That logic is the subject of why grid storage is hard, which explains the options for countries without such neighbors.
The United States: strong resource, uneven policy
The United States has the second-largest fleet at 158.83 GW, which generated 464.39 TWh in 2025, or 10.27% of its electricity by Ember's count. The EIA figure is 10.48%. Its implied utilization of about 33% is among the highest in the table above, which says the resource is good.
Texas and the winter of 2021
Texas has had the most installed wind capacity of any state for more than a decade. It has about 39,450 MW of wind, which generated about 25% of the state's electricity in 2024. In February 2021, a severe cold snap caused widespread outages in Texas. Wind output fell too, and wind was blamed in public debate. But the post-crisis record shows that natural gas losses far exceeded wind losses: natural gas output dropped more than five times as much as wind output, and overall gas supply fell by about 85%. The Texas Department of State Health Services put the storm-related death toll at 246, though other estimates are much higher. After a 2011 winter storm, federal regulators had called for more winterization of Texas power infrastructure, but cold-weather practices stayed voluntary. The lesson most analysts draw is about winterization of all generation, not about wind alone.
Offshore wind and policy swings
Offshore wind in the United States has moved more slowly than in Europe. The first offshore farm, Block Island, with five turbines and 30 MW, was completed in December 2016. Vineyard Wind, at 804 MW, began construction in November 2021 and delivered first power on January 2, 2024. Ørsted's Revolution Wind received a federal stop-work order in August 2025, which a federal judge blocked in September and which let work resume, and Wikipedia's article on U.S. wind notes that many wind projects have been delayed by new regulations and slower federal permitting.
On the tax side, the Inflation Reduction Act of 2022 extended and expanded federal credits for wind, but the One Big Beautiful Bill Act, signed on July 4, 2025, phases them out: wind and solar projects must start construction by mid-2026 or enter service by the end of 2027 to keep the credits, according to Wikipedia's summary of the law. The exact deadlines and qualifications are detailed in Treasury guidance, so check the current rules before relying on them. The more general point is that the U.S. fleet's growth rate in 2025, 4.1%, is a fraction of China's, and policy uncertainty is a reason.
Germany, the United Kingdom, and Europe's offshore turn
Germany had 72.75 GW at the end of 2024, with 63.55 GW onshore and 9.2 GW offshore, and 77.88 GW at the end of 2025, with offshore at 9.73 GW, according to Wikipedia's article citing the Umweltbundesamt, Deutsche Windguard, and wind-energie.de. Wind provided about a third of the country's electricity in 2024, 136.9 TWh, and 31.8% of net generation in 2025 per Fraunhofer ISE.
The model for the rise was a fixed feed-in tariff guaranteed for 20 years, which gave investors certainty. In 2017 Germany replaced feed-in tariffs with auctions, and some offshore farms now win auctions at market prices without a subsidy. Onshore permitting became the bottleneck, and in 2023 the cabinet adopted a law to set aside 2% of Germany's land area for wind by 2032. In 2024, approvals for 2,405 new turbines (14.056 GW) set a record.
The United Kingdom, with 33.40 GW, is Europe's offshore leader. Its wind provides 29.37% of its generation, the highest share among the top ten by capacity. Hornsea 1 (1,218 MW) and Hornsea 2 (1,386 MW), off the Yorkshire coast, are among the largest offshore farms built, and Dogger Bank, planned at 4.8 GW, would exceed them. As of 2022, China (49%), the United Kingdom (22%), and Germany (13%) held more than 75% of the world's offshore capacity, which stood at 64.3 GW that year.
Offshore wind: the next frontier
Offshore wind is a smaller piece of the total, but it is the most interesting growth area, for four reasons.
Stronger, steadier wind. Offshore wind speeds are generally higher and more consistent than onshore, which is a main reason offshore farms tend to reach higher capacity factors than onshore ones.
Fewer land conflicts. Large onshore farms need land and face planning opposition. Offshore farms sit out of sight beyond the coastline, though they face conflicts with shipping and fishing.
Bigger projects. Offshore sites can host very large farms. Hornsea 2 is rated at 1,386 MW, the scale of a large conventional power station.
Floating foundations. Fixed-bottom turbines need shallow water. Floating designs open deeper areas. Blue H installed the first floating turbine in 2007, and Hywind off Norway in 2009 was the first full-scale one. Hywind Scotland, commissioned in October 2017, was the first operational floating wind farm, at 30 MW.
Costs have moved quickly. BloombergNEF reported that offshore wind costs fell 30% to $78 per megawatt-hour in 2019, and NREL projected fixed-bottom costs falling from $75 per megawatt-hour in 2021 to $53 by 2035, with floating costs falling from $207 to $64 per megawatt-hour in the same period. Those are projections, not guarantees, and in the United States offshore construction costs were still about $4,000 per kilowatt in 2023, versus $1,363 per kilowatt for onshore, according to figures reported on Wikipedia's offshore wind article.
India, Brazil, and the fast followers
Below the leaders, the fastest growers are not in Europe. India's capacity is 54.51 GW after 13.2% growth, which implies about 6 GW added in 2025 by my arithmetic. Turkey grew 14.8% to 14.78 GW, and Finland grew 12.2% to 9.38 GW, giving it a 27.44% share of generation. Brazil, with 34.87 GW, generated 117.58 TWh, a share of 15.67%.
For the next wave of growth, GWEC points to Uzbekistan, Egypt, and Saudi Arabia as emerging markets and to policy momentum in the United Kingdom, Germany, South Africa, Brazil, and Asia-Pacific. For the broader context of how wind fits alongside other sources, see renewable energy explained and the ranking of countries that run on the most renewable electricity.
Is wind cheap, and compared with what?
Cost is the reason wind keeps winning contracts. The levelized cost of energy (LCOE, the average cost per unit of electricity over a plant's life, including construction and operation) is the standard comparison. In Lazard's 2021 analysis, unsubsidized new onshore wind cost $26 to $50 per megawatt-hour, new gas $45 to $74, and offshore wind about $83, as summarized on Wikipedia's wind power article. Those numbers date from 2021 and should be treated as a snapshot, since turbine prices, interest rates, and supply chains have all moved since.
LCOE has a blind spot, though. It does not include the cost of dealing with variability, such as extra transmission, storage, or backup. That is why countries with the highest wind shares also invest in interconnection and flexible generation, and why grid planners care about more than the cost per megawatt-hour of the turbine itself. The pairing of wind and solar is partly an answer: in many places wind blows more at night and in winter, when solar is weak. See how solar panels work and whether they are worth it for the other half of that pairing, and how wind turbines work for the mechanics behind a capacity factor.
What the ranking does not tell you
A good ranking states its limits. This one has five.
- Capacity is not output. A gigawatt in Brazil produces more electricity per year than a gigawatt in Germany, as the utilization table shows.
- Share depends on the grid, not just the fleet. Denmark's 59% is possible because of interconnection and flexible neighbors. Many countries with similar wind resources could not reach it alone.
- Newer is not the same as better. A country that built early, such as Denmark or Germany, has older turbines and fewer good sites left, while a country that built recently has newer machines.
- Counting differs. Totals vary by source, as the United States' 10.27% versus 10.48% shows.
- Today's numbers move. Capacity grew 14% worldwide in 2025. The 2025 table will look different in 2026.
Frequently asked questions
Q: Which country has the most wind power capacity? A: China, with about 640.63 GW in 2025 according to Ember's data, which is about 49.6% of the world total of 1,291.23 GW. The United States is second with 158.83 GW and Germany third with 77.81 GW.
Q: Does China have more wind capacity than the rest of the world combined? A: No. China's share is close to half, about 49.6% by Ember's 2025 figures, so the rest of the world still has slightly more. The claim that China has more than all other countries combined is not supported by the wind data.
Q: Which country gets the largest share of its electricity from wind? A: Among the 20 largest wind countries, Denmark, where wind produced 58.73% of generation in 2025 by Ember's count and 59.3% of generation in 2024 according to Danish data cited on Wikipedia. Its interconnection with Norway, Sweden, and Germany lets it export surpluses and import during calm periods.
Q: Does wind power kill birds? A: Yes. Wikipedia's review says turbines and their power lines kill hundreds of thousands of birds each year, and estimates each turbine kills 6 to 20 bats per year. It also reports that wind farms cause fewer than 0.4 bird deaths per gigawatt-hour, against more than 5 for fossil-fueled plants. Mitigation includes stopping turbines at low wind speeds during bat season and slowing them when radar detects approaching birds.
Q: What happens when the wind does not blow? A: Grid operators draw on other sources: imports through interconnectors, flexible plants such as gas and hydropower, and increasingly batteries. Denmark keeps about 6 GW of conventional plants available and imports power from neighbors. Higher wind shares generally require more of these tools, and the cost of providing them is not captured in a turbine's cost per megawatt-hour.
Q: How long do wind turbines last? A: Wikipedia's article says the useful life of the equipment may be more than 20 years, and some older blades lasted only 10 to 20 years. When a site gets old, it can be repowered: older turbines are replaced with newer, larger machines, often reusing the grid connection and permits.
Q: Which country leads in offshore wind? A: China. As of the third quarter of 2024, about 39.1 GW of offshore capacity was connected in China, the most of any country, per Wikipedia's article on Chinese wind power. The United Kingdom and Germany are the next largest.
The bottom line
Wind power has become a mainstream source of electricity, producing about 8.55% of the world's electricity in 2025 and growing 14% in capacity in a single year. China dominates in sheer scale, with close to half of the world's capacity and most of its turbine manufacturing. Denmark shows that the share of a grid, and not the size of a fleet, is where wind changes an economy. And the United States shows that a good resource does not guarantee steady deployment when policy swings. The more useful ranking questions are how much electricity a turbine delivers, how much of a country's demand it meets, and how well the grid can carry it.
Sources
- Ember, Yearly electricity data and Global Electricity Review 2026
- Global Wind Energy Council, Global Wind Report 2025
- Wikipedia, which summarizes the national and industry sources named in the text: Wind power by country, Wind power in China, Wind power in Denmark, Wind power in Germany, Wind power in the United States, Offshore wind power, 2021 Texas power crisis, Vestas, and Ørsted
Related Reading
Follow new articles
Add SciHub101 to your feed reader to see new science and technology stories.
About the Author
SciHub101 is an independent science and technology publication founded and edited by Buğra Sözeri, a software engineer and app developer based in Türkiye. AI tools assist with drafting and research. Source documentation in the existing archive is uneven, and articles are being reviewed and corrected. The Editorial Team byline identifies editorial responsibility; it does not certify specialist or independent human review. Where we compare products, anything built by our own team is labelled as such — see the editorial guidelines and About page for how corrections and disclosures work.
Related Articles

Countries with the Most Vegans and Vegetarians: What Surveys Show
India has the highest self-reported vegetarian share, but no clean global ranking of vegans and vegetarians exists. Here is what national surveys actually measured, why they disagree, and what the climate data says about plant-based diets.
Countries with the Most Marine Protected Areas (2025 Ranked)
The United Kingdom protects 8.1 million km² of ocean — the most of any country. Australia's Great Barrier Reef Marine Park is the world's largest single MPA. The global target is 30% of oceans protected by 2030 (30x30). Currently only 8% is protected. Here's the full marine protection ranking.
Countries That Produce the Most Solar Power (Ranked)
China installed 278 GW of new solar capacity in 2024 alone — more than the entire installed base of the United States. With 888 GW of total solar PV capacity, China now hosts nearly half of all solar power on Earth. This article ranks the top solar nations by installed capacity and explains how the global solar revolution became so geographically concentrated.
Renewable Energy Explained — Solar, Wind, and Beyond
How solar panels and wind turbines work, why their costs fell about 90%, how fast they are spreading, and what storage and grids must still solve.
Countries That Consume the Most Electricity (Ranked)
China used about 10,070 TWh of electricity in 2024, roughly a third of the world's total, followed by the United States and India. This ranking uses Ember data for 2024, adds per-person figures, and explains what drives the gaps.
Countries with the Most Hydropower (Ranked by Installed Capacity)
China leads the world in hydropower with 435.95 GW of installed capacity — more than three times that of second-place Brazil at 110 GW. Hydropower is the world's largest source of renewable electricity, accounting for roughly 40 percent of global renewable generation. This ranking covers the top 15 countries by hydropower installed capacity using IHA and IRENA 2024 data, with methodology, historical context, and caveats about what capacity figures do and do not tell you.