Countries with the Most Reliable Electric Grids (Regulator Data)
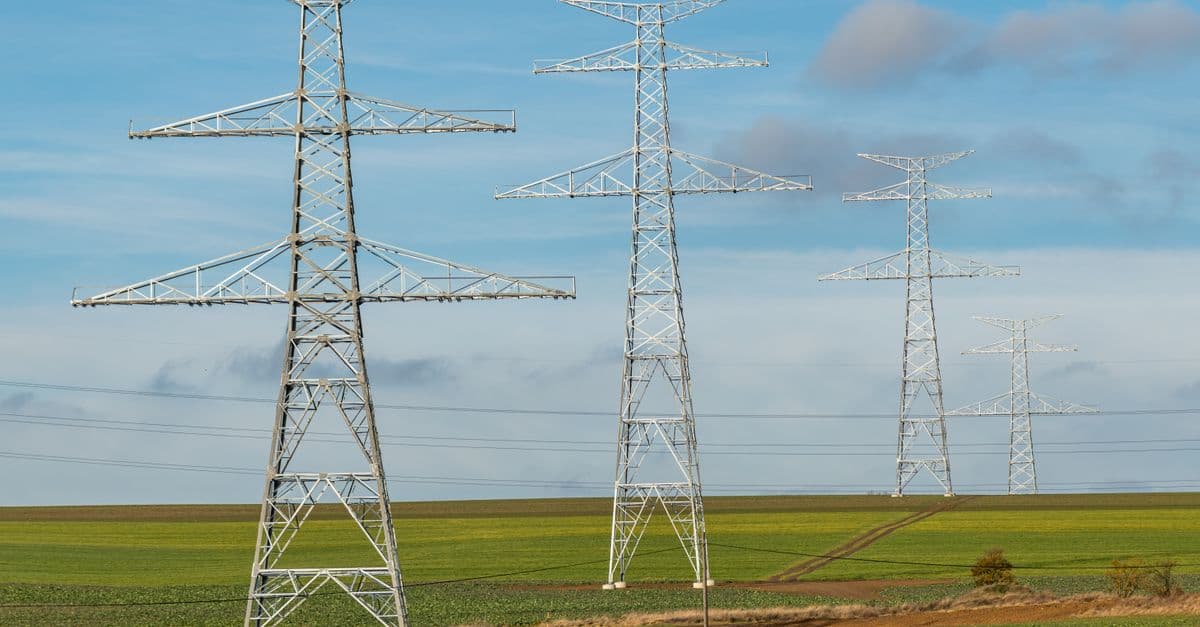
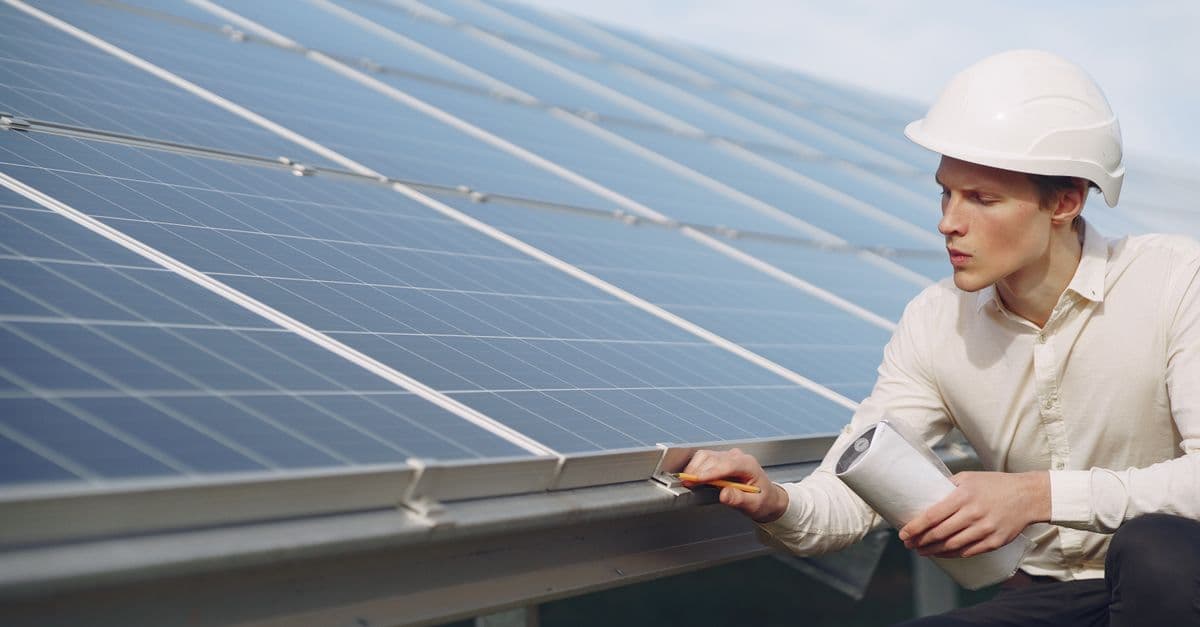
Photo: Petr Ganaj / Pexels
Germany's regulator reported that the average German customer lost power for 12.8 minutes in 2023. The average US customer lost power for roughly 11 hours in 2024, a hurricane year, and for about two hours in a year without major events. Both figures are real, but they are not measured the same way. This article compares the most reliable electric grids using what national regulators and agencies publish, and explains why a single clean global ranking does not exist.
Key takeaways
- Germany reported 12.8 minutes of unplanned interruption per end customer in 2023 and 12.2 minutes in 2022.
- The United States averaged about 11 hours of interruptions in 2024, nearly 9 of them from major events such as hurricanes. Without major events, the figure is routinely about two hours a year.
- Denmark reported supply security above 99.99 percent in 2015 while running a large share of its power from wind.
- South Africa went through more than 200 days of load shedding (rotating, deliberate blackouts) in 2022, then ended it on March 26, 2024, before cuts returned in 2025.
- Counting rules differ. Germany excludes force majeure events and counts only interruptions longer than three minutes. US utilities report with and without "major events."
How grid reliability is measured
Reliability is reported through a handful of standard indices. SAIDI (System Average Interruption Duration Index) is the total time an average customer is without power in a year. SAIFI (System Average Interruption Frequency Index) is the number of interruptions an average customer experiences. CAIDI (Customer Average Interruption Duration Index) is the average length of one interruption, which equals SAIDI divided by SAIFI.
Think of SAIDI like the average number of late minutes per train ride across a rail network. A railway can have one catastrophic day that wrecks the annual average, or a thousand tiny delays that add up to the same total, and the number alone does not say which. That is why serious analysts read SAIDI alongside SAIFI.
The US Energy Information Administration (EIA) defines SAIDI as the total duration of non-momentary power interruptions an average customer experiences in a year. "Non-momentary" excludes blips of a few seconds or minutes, so the threshold changes the answer. Germany's Bundesnetzagentur (the federal network agency) uses a three-minute threshold.
Why countries cannot be ranked directly
Four differences make cross-country tables unreliable:
- Event thresholds. Germany requires operators to report interruptions longer than three minutes. Other systems use different cutoffs.
- Treatment of extreme events. Germany's index counts unplanned interruptions and excludes events treated as force majeure. The Bundesnetzagentur states that extreme events "fließen nicht in die Berechnung mit ein," meaning they do not enter the calculation. US figures are commonly reported both with and without major events, and the difference is large.
- Voltage coverage. Some indices cover only low and medium voltage distribution, and others include the high-voltage grid.
- Who collects the data. National regulators, state commissions, and utilities each use their own protocols.
For that reason, the table below does not assign rank numbers. It lists what each source says, for which year, and how comparable the figure is.
What national sources report
| Country | Metric | Reported figure | Year | Source | Comparability |
|---|---|---|---|---|---|
| Germany | SAIDI, unplanned interruptions over 3 min, force majeure excluded | 12.8 min | 2023 | Bundesnetzagentur | Excludes extreme events |
| Germany | Same | 12.2 min | 2022 | Bundesnetzagentur | Excludes extreme events |
| Denmark | Supply security | Above 99.99% | 2015 | Wikipedia summary of Danish grid data | Percentage, not minutes |
| United States | Average interruption time, with major events | About 11 hours (660 min) | 2024 | EIA | Includes hurricanes Beryl, Helene, Milton |
| United States | Without major events | About 2 hours a year | Routine | EIA | Routine outages only |
| Puerto Rico | Average interruption time | Almost 200 hours | 2022 | EIA | US territory, own grid, Hurricane Fiona year |
| India | Average daily supply | 23.4 hours urban, 22.6 hours rural | 2023-24 or 2025 | Government figures compiled on Wikipedia | Different metric |
| South Africa | Days with load shedding | More than 200 days | 2022 | Wikipedia summary of Eskom data | Generation shortfall, not faults |
| Nigeria | Installed grid capacity | 11,165 MW on 23 plants | Undated | NERC data compiled on Wikipedia | Capacity, not outages |
The first thing to notice is how different these metrics are. A German SAIDI of 12.8 minutes and an American 660 minutes both describe a kind of reliability, but the American figure includes hurricanes and the German one excludes force majeure. The EIA says the average without major events is routinely about two hours a year. Compared with Germany's 12.8 minutes, that is roughly nine or ten times higher, which is a more honest gap than the headline 660-versus-12.8 comparison, and still a large one.
Converting between minutes and "nines"
Reliability is often quoted as a percentage of uptime, and the conversion is worth doing once. A year has 525,600 minutes. Divide any outage time by that figure and subtract the result from 100 percent.
| Outage per customer per year | Uptime | Example from this article |
|---|---|---|
| 5.3 minutes | 99.999% | No national figure here is this low |
| 12.8 minutes | 99.9976% | Germany, 2023 |
| About 53 minutes | 99.99% | Threshold behind Denmark's "above 99.99%" for 2015 |
| About 120 minutes (2 hours) | 99.977% | US routine outages without major events |
| About 660 minutes (11 hours) | 99.874% | US with major events, 2024 |
The percentages look almost identical, which is why "nines" can hide how large the differences are. Going from 99.9976 percent to 99.874 percent sounds trivial. In customer terms it is a jump from under 13 minutes to about eleven hours. A hospital, a data center, or a household on oxygen equipment cares about that difference a great deal, and that is why engineers talk in minutes.
Averages also hide the tail. A single customer at the end of a long rural line may lose power for many hours in a year even when the national SAIDI looks excellent. The EIA's state data illustrate the point: the 2024 US average was about 11 hours, yet South Carolina's was nearly 53 hours and four states stayed under two. Anyone planning for a specific site needs the local utility's figures, not the national mean.
Germany: reliability inside a transition
Germany's reliability record is the best-documented in the data above. The Bundesnetzagentur reported a SAIDI of 12.8 minutes for 2023, up slightly from 12.2 minutes in 2022 and roughly equal to the ten-year average of 12.7 minutes. In 2023, 852 grid operators reported 158,360 interruptions in low- and medium-voltage networks, about 1,115 more than the year before.
The numbers are steady. A decade of data around 12 minutes shows no sign that the country's phase-out of nuclear power and growth in wind and solar damaged the average customer's experience.
Why the average stays low
Most outages begin in the local distribution network, not in power plants. A tree falls on a line, a cable fails, a transformer overheats. The customers affected lose power while the rest of the system continues. Germany's index measures exactly that kind of event, which is why it is mostly a measure of how well the local grid is built and maintained, not how the country generates electricity.
That separation of generation from delivery is the key to understanding every country in this article. A country can have a perfectly reliable local grid and still run short of generation, which is what happened in South Africa. A country can have abundant generation and fragile local lines, which describes much of the US experience.
Can a grid with lots of wind stay reliable?
Denmark is the test case. Wikipedia's compilation of Danish data shows wind supplying 19 percent of electricity consumption in 2005, 30 percent in 2012, 42 percent in 2015, and 45 percent in 2017. Wind was 54 percent of generation in 2022. In 2015 the same source puts supply security above 99.99 percent. A figure of 99.99 percent corresponds to a little under 53 minutes of outage per year, and "above" means the real number was lower.
Denmark manages variable wind through interconnection. The country has cables to Norway (Skagerrak, 1,700 MW), Sweden (Konti-Skan, 740 MW), the Netherlands (COBRAcable, 700 MW), the UK (Viking Link, 1,400 MW), and Germany (including a 1,780 MW AC link in Jutland). When the wind drops, Denmark imports. When it blows hard, Denmark exports. Norway's hydropower acts, in effect, as a giant battery.
A useful analogy is a reservoir system. A town with a single small reservoir is at the mercy of a dry week. A town connected by pipes to several reservoirs in different valleys, each with its own weather, can rarely run out. Grid interconnections work the same way, trading geographic diversity for stability. The connection to related topics, such as countries with the most wind power capacity and renewable energy capacity, explains how much variable generation each country has to balance.
Undergrounding also matters. As of 2014, nearly all Danish low-voltage lines were underground, about 40 percent of medium-voltage lines were buried (around 50 to 60 kV), and about 25 percent of high-voltage lines (132 to 400 kV) were ground cables. Buried cables are immune to wind, ice, and falling trees, the dominant causes of outages in countries with overhead networks.
The United States: rich country, uneven reliability
EIA data show that US customers experienced about 11 hours of interruptions in 2024, nearly twice the annual average of the decade before, and major events accounted for nearly nine hours of that total, compared with nearly four hours a year from 2014 to 2023. Hurricanes Beryl, Helene, and Milton accounted for 80 percent of hours without electricity in 2024.
The underlying reliability, when major events are removed, has been steady. EIA reports that the routine figure is about two hours a year. The difference between about two hours and about 11 hours is almost entirely weather.
The state-by-state spread
The national average hides a wide spread. South Carolina averaged nearly 53 hours of interruption in 2024. Arizona, South Dakota, North Dakota, and Massachusetts each averaged under two hours. The national frequency was 1.5 interruptions per customer, and Hawaii had the most at 4.4.
Puerto Rico shows the extreme. EIA reports that Puerto Rican customers averaged almost 200 hours of interruptions in 2022, the year Hurricane Fiona cut power to all roughly 1.5 million customers.
Why the American grid is vulnerable
The American Society of Civil Engineers gave US energy infrastructure a D+ in its 2025 Report Card. The report finds that 70 percent of transmission lines and 70 percent of power transformers are 25 years or older, and 60 percent of circuit breakers are 30 years or older. It estimates an investment gap of $578 billion by 2033, rising to $702 billion if federal funding lapses.
The ASCE report also finds that about 80 percent of US outages from 2000 to 2023 stemmed from weather, and that weather-related outages in 2014 to 2023 roughly doubled compared with 2000 to 2009. About 92 percent of electric service interruptions come from distribution system failures. This is the root of the American pattern: overhead distribution lines that run through trees and across storm tracks, on a system whose components are aging.
Weather exposure is physical. The science of how hurricanes form explains why the Gulf and Atlantic coasts face repeated landfalls, and the discussion of extreme weather and climate change covers how those risks are shifting.
Two cautionary events
The 2003 Northeast blackout. On August 14, 2003, an estimated 55 million people in the US and Canada lost power, including about 10 million in southern and central Ontario and 45 million in eight US states. Overgrown trees touching high-voltage lines started the cascade, and an alarm system in a utility control room failed because of a software bug (a race condition in the energy management system). Outages lasted from two hours to four days.
The 2021 Texas winter storm. From February 10 to 27, 2021, more than 4.5 million Texas homes and businesses lost power, some for days. The Texas Department of State Health Services counted 246 deaths, and some estimates run as high as 702. The grid came within 4 minutes and 37 seconds of complete failure before partial shutdowns were ordered. Power equipment was not winterized, and recommendations after a 2011 blizzard had not been enforced.
Texas also illustrates a structural issue. Its grid has long been kept separate from the two large US interconnections to avoid federal oversight. It does have ties, but they are limited, and that made importing power during the crisis difficult. The same logic that helps Denmark, interconnection, was missing.
Island grids and isolated systems
Isolation can cut both ways. A small, tightly meshed system with ample spare capacity can be very reliable, but it has nobody to borrow from during a failure.
Singapore. Its power system is a compact island grid whose electricity comes from natural gas for about 95 percent of generation, with capacity of about 12,800 MW in 2022. Solar capacity rose from 26 MW in 2014 to 774 MW in 2023, and Singapore plans to import up to 6 GW of low-carbon electricity by 2035. The country is often cited for reliability, and its regulator, the Energy Market Authority, publishes its own performance statistics. Those figures are not reproduced here because the metric and its definitions differ from the German and American ones. A reminder of the stakes of a single-fuel island system is the 1983 cascading trip at Jurong Power Station, which left Singapore without power for 8 hours and 42 minutes.
Japan. Japan is divided into a 50 Hz east and a 60 Hz west. Four back-to-back high-voltage direct current substations link the two with a combined transfer capacity of 1.2 GW. During the 2011 Tohoku earthquake and tsunami there were blackouts in some areas, attributed in part to the limited capacity of those converter stations. The lesson is that frequency isolation limits how much one half can help the other.
Puerto Rico. An island grid in a hurricane-exposed location has a reliability record far worse than any mainland US state, as the EIA numbers above show.
Grids under strain: when generation falls short
In some countries, the main problem is not local lines but too little generation. The result is deliberate rationing, known as load shedding, or collapse.
South Africa
South Africa's utility, Eskom, imposed more than 200 days of power cuts in 2022, the most in a calendar year up to that point. Stage 6 removes just under 6,000 MW from the grid. Load shedding ended at 5:00 a.m. on March 26, 2024, and April 2024 was the first full month without rotational cuts since January 2022. Capacity reached 35,000 MW by July 2024, the highest in six years. Cuts returned in January 2025, with Stage 6 on February 22, 2025, and no load shedding was reported after May 16, 2025.
Eskom's fleet is old. Fifteen stations commissioned between 1961 and 1996 added 35,804 MW, and many are close to 50 years old. Estimates of the economic cost vary widely, so treat them as a range rather than a fact. Analyst Lungile Mashele estimated that the economy's potential size has been reduced by about 20 percent since 2007. Analysts have also estimated annual GDP reduction of 1 to 1.3 percent since 2007, and daily losses of $85 million to $230 million. A firm called Alexforbes estimated R4 billion a day in lost activity under prolonged Stage 6.
Nigeria
Nigeria's grid has about 11,165 MW of installed capacity from 23 grid-connected plants, about 86 percent gas and the rest hydropower, according to Nigerian Electricity Regulatory Commission data compiled on Wikipedia. The available capacity in the first months of 2018 was only 7,250 to 8,034 MW. The grid collapsed twice in one week in March 2022. Households and businesses rely on generator sets, which provided an estimated 6,000 MW in 2008.
The gap between what is installed and what is available is typical of an under-maintained system. A capacity number tells you what the power stations could produce in ideal conditions. The available number tells you what they actually do, once gas supply, maintenance, and transmission constraints have their say.
Pakistan and India
Pakistan's installed capacity grew from 22,812 MW in June 2013 to 37,261 MW in July 2020 and 49,651 MW in March 2026, according to Wikipedia's summary of national data. Capacity growth alone does not guarantee supply, since a plant that exists on paper may not be running. Load shedding was severe in Pakistan before 2016.
India reports average supply of 23.4 hours a day in urban areas and 22.6 hours in rural areas. That implies roughly 0.6 hours of outage per day in cities and 1.4 hours in rural areas, which is hundreds of hours a year. The sources compiled on Wikipedia date the figure as either 2023-24 or 2025, so read it as recent but not precisely dated. India's installed capacity reached 513.73 GW by December 2025, and household electrification reached 100 percent.
The progress is real, but it is a different problem from the one Germany solved. Where a rich country worries about minutes lost to a tree, a fast-growing one worries about hours lost to demand that outruns the network.
What actually makes a grid reliable
The data above suggest a short list of mechanisms.
Burying the lines. Underground cables are protected from wind, ice, and trees, which are the main causes of distribution outages in overhead networks. The cost is high, which is why Denmark has buried nearly all its low-voltage lines but only a quarter of its high-voltage lines.
Interconnection. Linking neighbors lets each draw on the others when it runs short, as Denmark does with Norway and Germany. The lack of such links magnified the Texas crisis.
Storage and flexibility. Batteries, pumped hydro, and demand response smooth the gap between supply and demand. The article on grid-scale battery storage explains how this works, and why grid storage is hard covers the limits. Countries with large hydropower fleets have a built-in version of this.
Maintenance and replacement. Aging equipment fails more often. ASCE's finding that 70 percent of US transmission lines are 25 years or older illustrates the backlog, and Eskom's fleet of near-50-year-old coal plants shows the same issue in another form.
Weather hardening. Winterizing power plants and gas supply, trimming vegetation, and stronger poles all reduce storm damage. The Texas case shows what happens when winterization is voluntary.
Smarter operation. Forecasting and control software helps match supply to demand, a topic covered in how AI optimizes renewable energy grids. Demand patterns themselves are changing as electric cars arrive, which is the subject of electric vehicles and the power grid.
For a view of how consumption varies, the ranking of countries that consume the most electricity shows what scale the grids have to serve, and the article on how electricity works covers the physics of why supply and demand must balance every second.
Common misconceptions
"Renewables make grids unreliable." The Danish and German records say otherwise. Denmark ran with wind at 42 to 45 percent of consumption in 2015 to 2017 and reported supply security above 99.99 percent in 2015, and Germany's SAIDI has stayed near 12 minutes for a decade. The mechanism is interconnection, flexibility, and good local networks, not the generation type.
"The US has the worst grid among rich countries." The data are more nuanced. The routine figure, about two hours a year without major events, is higher than Germany's, but the headline 11 hours in 2024 was driven by hurricanes. Reliability varies enormously by state.
"A bigger capacity number means a more reliable grid." Nigeria has 11,165 MW installed, but available capacity was a fraction of that. Reliability depends on what is actually delivered.
"Load shedding is the same as a blackout." It is not. Load shedding is a controlled, rotating disconnection of customers to prevent the whole system from collapsing. A blackout is an uncontrolled failure.
"A single number can rank countries." Without common definitions, any ranking mixes measurement choices with real differences. The honest comparison is within a country over time, or between countries that use the same method.
Frequently asked questions
Q: What is SAIDI? A: SAIDI is the System Average Interruption Duration Index, the total time an average customer is without power in a year. The EIA defines it as the total duration of non-momentary interruptions per customer. Germany reported 12.8 minutes for 2023, and the US reported about 11 hours for 2024.
Q: Which country has the most reliable electric grid? A: No source ranks all countries on one common method. Among published regulator data, Germany's 12.8 minutes (2023) and Denmark's supply security above 99.99 percent (2015) are among the strongest. Figures from different countries use different definitions, so direct rankings are unreliable.
Q: Why are US power outages longer than German ones? A: Several factors combine. About 92 percent of US service interruptions come from the distribution system, much of it overhead and aging, and about 80 percent of outages from 2000 to 2023 were weather-related. US figures also include major events like hurricanes, while Germany's figure excludes force majeure events.
Q: What causes power outages? A: Most outages start in local distribution networks, through storms, falling trees, equipment failure, and accidents. Weather accounted for about 80 percent of US outages between 2000 and 2023. Rare transmission failures cause large blackouts, such as the August 2003 event that affected an estimated 55 million people.
Q: What is load shedding? A: Load shedding is the deliberate, rotating disconnection of customers when electricity supply cannot meet demand, used to prevent a full grid collapse. South Africa used it for more than 200 days in 2022. At Stage 6, just under 6,000 MW is removed from the grid.
Q: Does more wind and solar make a grid less reliable? A: Not by itself. Denmark had wind at 42 percent of electricity consumption in 2015 and reported supply security above 99.99 percent that year. It relies on interconnections to Norway, Sweden, Germany, the Netherlands, and the UK to balance variable output.
Q: How much does the US need to invest in its grid? A: The American Society of Civil Engineers estimated in 2025 an investment gap of $578 billion by 2033 for energy infrastructure, rising to $702 billion if federal funding returns to earlier levels. It gave US energy infrastructure a D+ grade.
The takeaway
Electric reliability looks like a simple scoreboard, but each country keeps score differently. The numbers that can be compared tell a consistent story. A well-maintained, interconnected distribution network, as in Germany and Denmark, loses its customers' power for minutes a year. A large, weather-exposed system with aging equipment, as in the United States, loses it for hours, and a bad storm season can double that. Where generation itself is short, as in South Africa and Nigeria, outages stop being random and become a schedule.
The practical lesson is that reliability is built, not inherited. It comes from burying or hardening lines, linking neighbors, maintaining equipment before it fails, and planning for the worst week of weather instead of the average one. Countries that spend on those things, over decades, end up with the boring grids that nobody thinks about, which is the highest compliment an electric system can earn.
Sources
- Bundesnetzagentur, Versorgungsunterbrechungen Strom 2023 (published November 11, 2024)
- US Energy Information Administration, Today in Energy (2025), on 2024 interruption hours
- US Energy Information Administration, Today in Energy, on 2022 interruptions and Puerto Rico
- American Society of Civil Engineers, 2025 Report Card, Energy
- Wikipedia, Load shedding in South Africa
- Wikipedia, 2021 Texas power crisis
- Wikipedia, 2003 Northeast blackout
- Wikipedia, Electricity sector in Denmark, Nigeria, Singapore, Japan, India, and Pakistan
Related Reading
Follow new articles
Add SciHub101 to your feed reader to see new science and technology stories.
About the Author
SciHub101 is an independent science and technology publication founded and edited by Buğra Sözeri, a software engineer and app developer based in Türkiye. AI tools assist with drafting and research. Source documentation in the existing archive is uneven, and articles are being reviewed and corrected. The Editorial Team byline identifies editorial responsibility; it does not certify specialist or independent human review. Where we compare products, anything built by our own team is labelled as such — see the editorial guidelines and About page for how corrections and disclosures work.
Related Articles

Countries with the Best Tap Water Quality (2024 Data Ranked)
Iceland, New Zealand, Singapore, and Hungary report 100 percent of people using safely managed drinking water, and much of Europe is above 99 percent. Yet 2.1 billion people still lack it, and lead pipes and PFAS challenge even high scorers. Here is what the data show and what it cannot.
AI & Supply Chains: Decarbonizing Global Logistics
How machine learning route optimization, demand forecasting, and supplier scoring are cutting carbon out of global logistics, and where those gains still fall short.
Countries That Consume the Most Electricity (Ranked)
China used about 10,070 TWh of electricity in 2024, roughly a third of the world's total, followed by the United States and India. This ranking uses Ember data for 2024, adds per-person figures, and explains what drives the gaps.
Countries with the Most Nuclear Power (Ranked)
The United States operates 94 nuclear reactors producing nearly 97 GW of electricity — more nuclear capacity than any other nation on Earth. But France is the world's most nuclear-dependent country: 70–75% of French electricity comes from its 57 reactors, the highest share of any major economy. This article ranks nuclear nations by capacity, reactor count, and electricity share.

Direct Air Capture: How It Works, What It Costs, and Where It Fits
Direct air capture (DAC) machines pull carbon dioxide out of ambient air with chemical sorbents or solvents, then release it as a pure stream for storage or use. The technology works. The constraint is energy and cost: reported prices run from about $600 to more than $1,000 per tonne, and operating capacity is a tiny fraction of annual emissions.
How to Reduce Your Electricity Bill: 15 Proven Tips Ranked by Real Savings
The average U.S. household spends $1,600–$2,400 annually on electricity, with heating and cooling accounting for 40–50% of consumption. Water heating, appliances, and standby phantom load account for most of the remaining consumption. Reducing electricity consumption requires prioritizing actions by impact: upgrading HVAC efficiency (15–25% savings), improving home insulation (15–20% savings), installing a heat pump water heater (40–50% water heating savings), replacing old refrigerators and washing machines (20–30% appliance savings), eliminating phantom load (5–10% savings), and optimizing lighting. A typical homeowner implementing these 15 actions saves $300–$600 annually (20–25% reduction in bills), with payback periods of 3–8 years through lower energy bills and modest maintenance cost reductions.