AI & Supply Chains: Decarbonizing Global Logistics
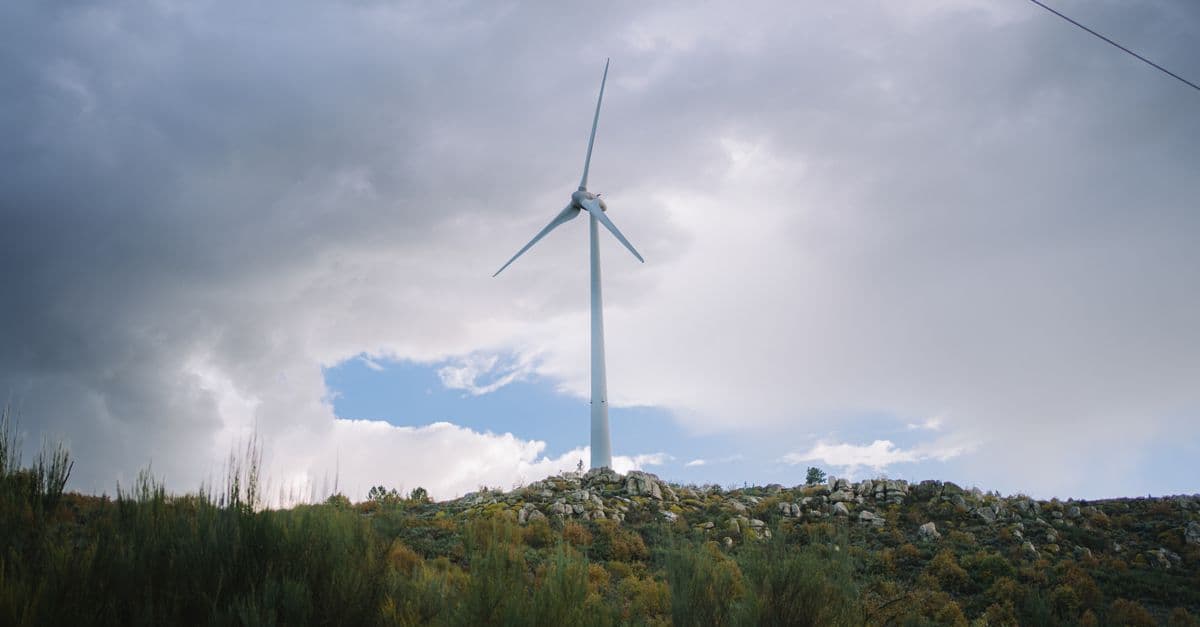
Photo: Diogo Miranda / Pexels
Global logistics, the trucks, ships, planes, and warehouses that move goods from factory to doorstep, accounts for roughly 11% of global greenhouse gas emissions, with transportation responsible for about 8 percentage points of that and warehousing and ports making up the rest, according to World Economic Forum analysis (WEF). For most large companies, these supply chain emissions dwarf what happens inside their own factories: corporate Scope 3 emissions, the ones generated by suppliers, shippers, and logistics partners rather than a company's own operations, run on average 26 times higher than direct Scope 1 and 2 emissions combined, according to CDP's 2024 analysis of corporate disclosures (CDP). Machine learning is now being deployed against that gap, not by replacing trucks and ships with cleaner ones (that takes decades), but by making the existing fleet carry more, travel less, and idle less. This article explains the specific mechanisms, what results look like at real companies, and where the approach runs into hard physical and economic limits.
The problem: supply chains were built to optimize for speed and cost, not carbon
For most of the last century, logistics software had one job: get the product from A to B as fast and cheaply as possible. Route planning, warehouse placement, and carrier selection all ran through that single lens. Carbon was never in the equation because, until recently, nobody was charging for it.
That single-variable optimization created predictable blind spots. A shipment gets routed via air freight because it is fastest, even when rail or ocean freight would arrive within an acceptable window at a fraction of the emissions. A distribution center orders extra inventory "to be safe," because a stockout is expensive and a warehouse of unsold goods is, in accounting terms, just inventory sitting on a balance sheet, not an environmental cost. A company picks the cheapest supplier without ever finding out how many diesel generators or coal-fired kilns that supplier runs.
None of this was irrational. It was rational given the information available and the incentives in place. The problem is that carbon was an externality: something the atmosphere absorbed the cost of, not something on anyone's spreadsheet. That started changing in the 2020s for two reasons. First, mandatory disclosure regimes (the EU's Corporate Sustainability Reporting Directive, the SEC's climate disclosure proposals, and CDP's investor-driven reporting framework) started forcing companies to quantify supply chain emissions they had previously never measured. Second, the EU's Carbon Border Adjustment Mechanism (CBAM) entered its definitive, financially binding period on January 1, 2026, meaning importers of covered goods (currently cement, iron and steel, aluminum, fertilizers, hydrogen, and electricity, with an expansion to downstream goods proposed for 2028) must now purchase certificates matching the embedded carbon in what they import (European Commission). Carbon, in other words, is becoming a line item.
Once carbon has a number attached to it, it becomes something an optimization algorithm can work with. That is the opening machine learning has stepped into.
How the optimization actually works
Route optimization, demand forecasting, and supplier scoring sound like three unrelated tools, but they share a common structure. Each replaces a rule of thumb ("ship the fastest way," "order extra to be safe," "pick the cheapest vendor") with a model trained on historical data that can weigh multiple objectives, including carbon, at once. Below is how each mechanism actually functions, not just what it claims to do.
Multi-modal route optimization: routing shipments the way GPS routes cars, but with a carbon term added
Ride-hailing apps solve a version of this problem constantly: given traffic, distance, and time constraints, find the fastest legal route. Freight optimization is the same kind of problem with one extra dimension: instead of a single mode (driving), a shipment can move by truck, rail, ocean vessel, or air, and each mode has wildly different cost, speed, and carbon profiles.
The physical gap between modes is enormous. According to U.S. Environmental Protection Agency freight emission factors, moving one ton of cargo one mile by rail emits roughly 0.046 pounds of CO₂, by ocean vessel roughly 0.17 pounds, by truck roughly 0.41 pounds, and by air roughly 2.4 pounds (EPA GHG Emission Factors Hub). That means air freight emits over 50 times more carbon per ton-mile than rail, and truck freight emits roughly nine times more than rail. A shipment that "has to" go by air because a scheduler defaulted to the fastest option, when a rail-plus-truck combination would have made the deadline, represents a 10x-or-larger carbon difference for the same physical cargo.
What a route-optimization model actually does is search across combinations of modes and legs (a graph search problem, similar to how a mapping app evaluates thousands of possible driving routes) against a delivery deadline, then rank the results not just by cost but by a weighted cost-plus-carbon score. This is the same class of algorithm long used for vehicle routing problems in operations research, now retrained with an emissions coefficient added to the objective function.
Demand forecasting: reducing the "just in case" buffer that drives overproduction
Retailers have historically padded demand forecasts with safety stock to avoid running out. The problem is that every unit of unnecessary safety stock represents a unit that was manufactured, shipped, warehoused, and, disproportionately often, never sold at full price.
This is not a small effect. The global fashion industry alone produces an estimated 92 million tonnes of textile waste a year, a figure the Ellen MacArthur Foundation projects could rise past 134 million tonnes by 2030 without structural change, and in the United States an estimated 85% of discarded textiles end up in landfill or incineration rather than reuse or recycling (Ellen MacArthur Foundation). Some meaningful share of that waste starts as an overproduction decision made months earlier, based on a forecast that was wrong.
Machine learning demand forecasting (typically gradient-boosted or recurrent neural network models trained on historical sales plus external signals like search trends, weather, and local events) narrows the forecast error compared to traditional statistical or manual methods. McKinsey's operations research finds that AI-driven forecasting can reduce forecast errors by 20 to 50%, cut lost sales from stockouts by up to 65%, and lower warehousing costs by 5–10% (McKinsey). A tighter forecast means less padding, and less padding means fewer units manufactured, shipped, and eventually discarded or discounted, which is the actual mechanism connecting a statistics problem to a carbon outcome.
How does AI reduce supply chain carbon emissions?
AI reduces supply chain emissions primarily through three levers: routing shipments via lower-carbon transport modes (rail and ocean over air and truck) where deadlines allow, tightening demand forecasts so less inventory is overproduced and later discarded, and scoring suppliers on estimated carbon intensity so companies can favor cleaner vendors. None of these eliminate emissions; they reduce waste and inefficiency within an existing physical system.
Supplier emissions scoring: estimating the carbon nobody self-reports
The hardest of the three problems is supplier transparency, because most suppliers, especially smaller ones several tiers removed from the final brand, do not measure or report their own carbon footprint. A large manufacturer might have thousands of suppliers, most of which have never run a carbon audit.
Rather than waiting for self-reported data that may not exist, some supply chain platforms use models trained on proxy signals, energy grid carbon intensity in the supplier's region, facility size and type, shipping distances, and industry-average emission intensities, to estimate a supplier's carbon footprint. This is fundamentally an imputation problem: filling in missing data with a model's best estimate rather than a ground-truth measurement. It is directionally useful for ranking suppliers relative to each other, but it is not an audit, and companies that treat modeled estimates as verified numbers risk greenwashing accusations. Third-party verification bodies like the Science Based Targets initiative (SBTi) and Carbon Trust exist specifically to validate what these models estimate.
What this looks like at real companies
The clearest way to see whether any of this actually moves carbon numbers is to look at organizations that have published real, audited or independently reported figures, rather than vendor marketing claims.
Nike has cut Scope 1 and 2 (direct operational) emissions by 69–73% since its 2015 baseline, already surpassing its original 2030 target, and now sources 96% renewable electricity across its owned and operated facilities (Nike FY24 Sustainability Data). The much larger number, Scope 3 (supply chain) emissions, fell 29% between 2020 and 2024, landing at roughly 8.2 million metric tons of CO₂e, and Nike reports it has cut air freight volume by 80% since 2020 as part of a shift toward ocean freight (Nike Impact Report data via DitchCarbon; About Nike). That air-to-ocean shift is exactly the kind of mode substitution route-optimization tools are built to surface, though Nike's own disclosures attribute the reduction to a broader logistics strategy, not to any single AI system, and Scope 3 still makes up over 90% of Nike's total footprint.
Walmart's Project Gigaton, launched in 2017, asked its roughly 100,000 suppliers to commit to emissions reductions across six areas: energy, nature, waste, packaging, transportation, and product design. In February 2024, Walmart announced it had hit its goal of avoiding or reducing 1 billion metric tons of emissions across its value chain, six years ahead of the original 2030 target, an amount roughly equivalent to Japan's total annual emissions (EDF+Business). It is worth being precise about what that number is: it is a self-reported, supplier-aggregated figure that includes projected as well as already-achieved reductions, not an independently audited real-time carbon ledger. It is directionally credible given the scale of participation, but treat the "1 gigaton" headline as an estimate, not a measured total.
Maersk, the world's second-largest container shipping line, put the Laura Maersk into service in July 2023 as the first large containership running on dual-fuel methanol rather than heavy fuel oil. Running on green methanol, the vessel saves roughly 100 tonnes of CO₂ per day compared to a sister ship burning conventional heavy fuel oil (gCaptain; Marine Log). Maersk has 24 additional methanol-capable vessels on order for delivery through 2027. This is a fuel-switching story more than an AI story, but the demand forecasting and fleet-deployment models Maersk runs alongside it determine which routes get the low-carbon vessels first, since methanol supply is still scarce and expensive relative to fossil bunker fuel.
DHL Express launched GoGreen Plus in February 2023, letting customers pay a premium to have their specific air shipment's fuel represented by Sustainable Aviation Fuel (SAF) purchased and injected into the DHL network under a "book and claim" insetting model, distinct from buying an offset in an unrelated project. DHL states that waste-and-residue-derived SAF can cut lifecycle emissions by up to 80% compared to conventional jet fuel (DHL Group). The service depends on ML-based emissions accounting to calculate, shipment by shipment, exactly how much fuel-equivalent SAF a given package's carbon footprint requires.
Where AI-driven optimization runs into hard limits
None of the case studies above describe emissions falling to zero, and that is not an oversight. Optimization software works within the physical and economic system it is given; it cannot rewrite the system's underlying constraints.
The rebound effect is real. When shipping becomes cheaper and more efficient, historical experience across transportation economics (the same dynamic that shows up in fuel-efficiency studies, sometimes called Jevons' paradox) suggests some of that efficiency gain gets consumed by increased volume rather than banked as a net emissions cut. A company that cuts cost-per-shipment by 20% through better routing may simply ship 20% more, because lower shipping costs make more product categories or smaller order sizes economically viable.
Data quality is a genuine bottleneck, not a rounding error. Supplier emissions data is frequently self-reported, rarely audited at the tier-two or tier-three supplier level, and inconsistent in methodology across regions. A model trained on noisy or incomplete inputs will produce plausible-looking but potentially wrong outputs, and there is no way for the model itself to flag when its confidence should be low, unless that uncertainty estimation is explicitly built in.
Novel disruptions break models trained on historical patterns. A demand-forecasting or routing model learns from the past. It has no inherent way to anticipate a Suez Canal blockage, a dockworker strike, or a sudden geopolitical shift in shipping lanes, the kinds of events that, by definition, are not represented in historical training data. During the 2021 Suez Canal blockage, forecasting models trained on pre-blockage patterns underperformed until enough new data accumulated to retrain them, a known limitation of any historical-pattern-based system.
Last-mile delivery resists optimization the most. Urban delivery, the truck-to-doorstep leg, is a small share of total distance traveled but a disproportionate share of emissions and cost, because it involves stop-and-go driving, low vehicle utilization, and traffic congestion. The World Economic Forum projects that under a business-as-usual trajectory, urban delivery emissions could rise 60% by 2030 as e-commerce volume grows, even as delivery routing gets smarter, because volume growth is outpacing efficiency gains (WEF). Route optimization can shave distance off each trip, but it cannot change the fundamental geometry of delivering individually to millions of doorsteps instead of consolidating deliveries at fewer stops, which is a land-use and behavioral problem, not a modeling problem.
What people get wrong about "AI-optimized" supply chains
The most common misreading of this space is treating "AI" as a synonym for "solved." Vendor marketing language often implies that deploying a machine learning platform is itself the decarbonization, when in reality the model only surfaces a better decision; a human organization still has to act on it, which means budget approval, supplier renegotiation, and operational change management, all of which take time measured in quarters or years, not the milliseconds the model runs in.
A second common confusion is mistaking Scope 3 estimation for Scope 3 measurement. When a company says its AI platform "calculated" supplier emissions, that number is frequently a statistical estimate built from proxy data (grid carbon intensity, facility size, industry averages), not a direct measurement of what that supplier actually emitted that year. Estimates are useful for prioritization and ranking. They are not audit-grade numbers, and treating them as such, particularly in public sustainability marketing, is one of the more common greenwashing patterns regulators and NGOs now flag.
A third misconception is that circular-economy applications (predicting which returned products can be resold versus recycled, or optimizing reverse-logistics collection routes) represent a bigger emissions lever than they usually do in practice. These programs are valuable for waste reduction and brand reputation, but the underlying volumes are typically a small fraction of a company's total product flow, so their carbon impact should be understood as meaningful at the margin rather than transformative at the scale of total Scope 3 emissions.
Finally, people conflate "optimized" with "green." A logistics network can be genuinely more efficient, moving more goods per unit of fuel, per dollar, per hour, without total emissions actually falling, if volume growth outpaces the efficiency gain. Efficiency and absolute emissions reduction are related but distinct metrics, and headline statistics about AI-driven "emissions cuts" sometimes describe emissions intensity (per unit shipped) rather than total emissions, a distinction worth checking whenever a company reports an "X% reduction."
What's next: 2026 and beyond
CBAM's definitive period, now financially binding as of January 1, 2026, is likely to be the biggest near-term driver of supply chain carbon accounting investment, because it converts an abstract sustainability goal into a direct import cost for companies moving covered goods (currently cement, steel, aluminum, fertilizers, hydrogen, and electricity) into the EU, with an expansion to downstream manufactured goods proposed for 2028 (Access2Markets, European Commission). Expect more companies to invest in emissions-tracking infrastructure not because it is good practice, but because it now shows up on an invoice.
Maritime shipping, which the International Council on Clean Transportation estimates accounts for roughly 2.3% of global CO₂ emissions, is also entering a multi-decade fuel transition (methanol, ammonia, and biofuels alongside continued efficiency gains), and AI's role there will increasingly be about deployment optimization: deciding which of a mixed fossil- and alternative-fuel fleet serves which route, given that low-carbon fuel supply remains constrained and expensive relative to demand (ICCT). A related use of AI is covered in AI and environmental impact assessments.
None of this changes the underlying arithmetic, though. Optimization reduces waste inside a system; it does not replace the physical transition to cleaner fuels, denser urban logistics, or fundamentally less energy-intensive consumption patterns that the larger emissions reduction will ultimately require.
Frequently asked questions
Q: How much does supply chain machine learning cost to implement?
A: Costs vary enormously by company size and scope, from off-the-shelf demand forecasting SaaS tools costing a few hundred thousand dollars a year to custom enterprise route-optimization and supplier-scoring platforms running into the low millions for large multinational retailers. There is no single verified industry-wide average cost or payback period; treat any specific dollar figure or "guaranteed ROI" claim from a vendor with skepticism and ask for case studies with audited before-and-after numbers.
Q: Can AI eliminate supply chain emissions entirely?
A: No. AI reduces inefficiency and waste within an existing physical system of trucks, ships, planes, and factories, but it cannot make a diesel engine burn cleaner or a coal-fired factory run on renewables. Reaching near-zero supply chain emissions requires the underlying physical infrastructure, fuels, grids, and manufacturing processes, to actually change, which is a slower and more capital-intensive process than deploying software.
Q: Are nearshored (geographically closer) supply chains actually greener than offshore ones?
A: Often, but not automatically. Shorter transport distances generally cut shipping emissions, but nearshoring can also mean smaller, less efficient production facilities that lose economies of scale, or a shift from low-carbon ocean freight to higher-carbon regional trucking. Whether nearshoring reduces net emissions depends on the specific transport-mode shift and factory efficiency involved, not distance alone.
Q: How reliable are AI-generated supplier carbon footprint estimates?
A: They are estimates built from proxy data (grid carbon intensity, facility size, industry averages), not direct measurements, so accuracy varies by how much real data is available for a given supplier and region. Third-party verification bodies like the Science Based Targets initiative and Carbon Trust exist specifically because self-reported and modeled figures need independent auditing before they can be treated as reliable.
Q: What is the single biggest carbon lever in supply chain AI, route optimization, demand forecasting, or supplier scoring?
A: Transport mode selection (choosing rail or ocean freight over air freight when deadlines allow) tends to produce the largest per-shipment carbon swing, since EPA emission factors show air freight emits over 50 times more CO₂ per ton-mile than rail. Demand forecasting affects a larger volume of total emissions over time by reducing overproduction, but the per-decision impact of a single mode switch is the sharpest single lever available.
Q: Does AI-optimized shipping increase costs for consumers?
A: Not necessarily. Route and mode optimization is frequently cost-saving as well as carbon-saving, since rail and ocean freight are typically cheaper than air, which is part of why companies adopt it. Costs can rise for premium options like DHL's GoGreen Plus SAF program, which explicitly charges a surcharge for lower-carbon fuel allocation, a choice, not a default.
Q: What is CBAM and why does it matter for AI-driven supply chain decisions?
A: The EU's Carbon Border Adjustment Mechanism is a carbon tariff that, as of its definitive period starting January 1, 2026, requires importers of certain carbon-intensive goods to purchase certificates matching the embedded emissions of what they bring into the EU. It matters for supply chain AI because it converts an abstract emissions number into a direct financial cost, giving companies a much stronger incentive to actually measure and reduce supplier emissions rather than estimate them loosely.
Q: Is last-mile delivery the hardest part of supply chain decarbonization to solve with AI?
A: Largely yes. Routing algorithms can shave distance and idling off individual delivery routes, but the fundamental inefficiency, delivering individually to millions of scattered addresses rather than consolidating at fewer stops, is a land-use and consumer-behavior problem that software optimization alone cannot restructure. The World Economic Forum projects urban delivery emissions could still rise 60% by 2030 without structural intervention, despite continued routing improvements.
Q: Do these AI tools measure real-time emissions or only estimate them after the fact?
A: Most current systems estimate emissions from planned routes, historical fuel-consumption data, or proxy signals rather than measuring tailpipe or stack emissions in real time. True real-time carbon accounting (sensor-based, verified per shipment) remains the exception rather than the norm across the industry as of 2026, though regulatory pressure from frameworks like CBAM is pushing toward more granular, auditable measurement.
The takeaway
AI-driven supply chain optimization is a genuine, measurable lever on corporate emissions, not vaporware. Nike's real Scope 3 cuts, Walmart's audited-scale supplier program, and Maersk's fuel-switching fleet all show the pattern working at real scale. But the mechanism is efficiency, not transformation: these tools reduce waste inside an existing system of fossil-fueled trucks, ships, and planes, they do not replace that system. The next real gains will come less from smarter software and more from what that software increasingly forces into the open, like which suppliers, which fuels, and which routes are actually carbon-intensive, once regulations like CBAM put a real price on the answer.
Read next:
Follow new articles
Add SciHub101 to your feed reader to see new science and technology stories.
About the Author
SciHub101 is an independent science and technology publication founded and edited by Buğra Sözeri, a software engineer and app developer based in Türkiye. AI tools assist with drafting and research. Source documentation in the existing archive is uneven, and articles are being reviewed and corrected. The Editorial Team byline identifies editorial responsibility; it does not certify specialist or independent human review. Where we compare products, anything built by our own team is labelled as such — see the editorial guidelines and About page for how corrections and disclosures work.
Related Articles
Countries with the Most Reliable Electric Grids (Regulator Data)
Germany's regulator reported 12.8 minutes of unplanned outage per customer in 2023. US customers averaged about 11 hours in 2024, a hurricane year, and about 2 hours in routine conditions. A clean global ranking does not exist because countries count outages differently, so this article compares what each national source actually reports.

AI & Water Conservation: How Machine Learning Cuts Waste
How machine learning optimizes irrigation, leak detection, and demand forecasting to save water in agriculture, cities, and industry.

Real-Time Emissions Tracking: AI Makes Carbon Visible
How AI, satellites, and grid-data APIs turn a once-a-year carbon estimate into a live number companies and regulators can act on today.

AI & Environmental Impact Assessments: Automating Sustainability Reviews
How machine learning speeds up environmental impact assessments for infrastructure projects, from satellite-based biodiversity scans to supply-chain carbon models.
AI & Carbon Markets: Monetizing Climate Action Through Smart Trading
How machine learning prices carbon credits, flags fraudulent offsets, and reshapes climate finance — and where its limits are.
AI & Ocean Cleanup: Autonomous Robots Battle Plastic Pollution
How machine learning powers ocean cleanup robots to detect, route toward, and remove plastic from rivers and open water, and where the technology still falls short.