Real-Time Emissions Tracking: AI Makes Carbon Visible

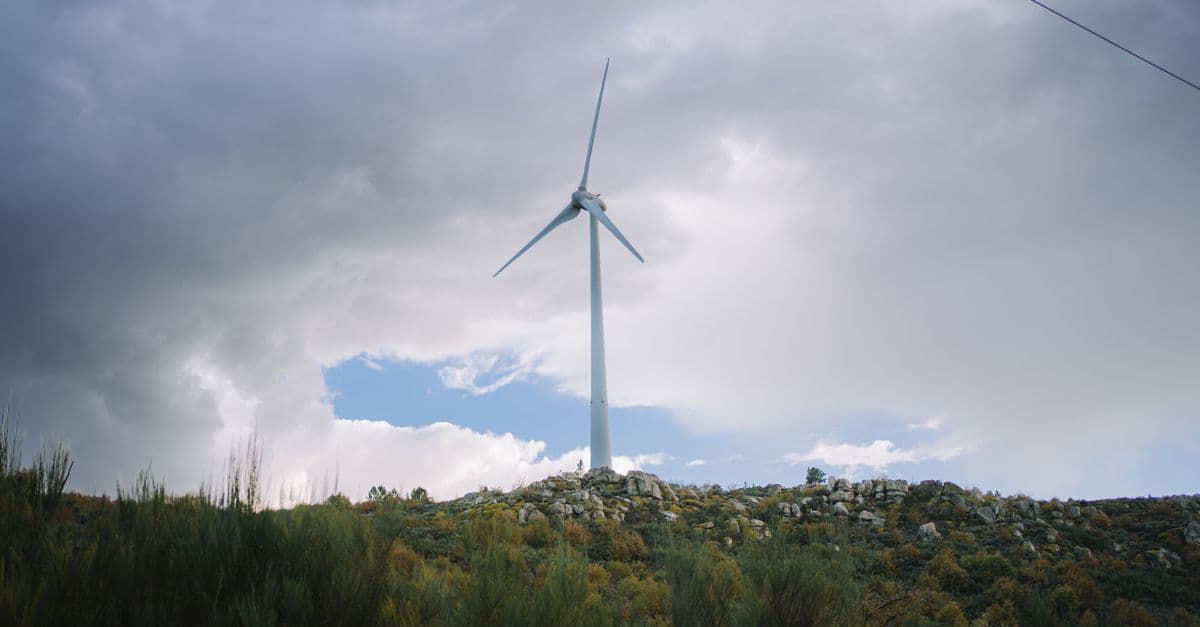
Photo: Robert Tippmann / Pexels
Most companies still report their carbon dioxide emissions once a year, months after the emissions actually happened. A factory that quietly exceeded its permit in March might not show up in a filing until the following June. Machine learning is closing that gap: satellites now flag methane plumes within days, smart-meter data streams into live dashboards, and grid operators publish carbon intensity that updates every five minutes. This piece explains how that pipeline actually works, how accurate it really is, and where it still falls short.
Key Takeaways
- Annual reporting creates a months-long blind spot. For most companies, indirect supply-chain emissions (Scope 3) account for 70 to 90 percent of their total footprint and are the hardest category to measure in real time, according to the GHG Protocol.
- Satellite methane detection has matured fast. GHGSat's constellation can reliably detect and quantify point-source leaks above roughly 100 kilograms per hour, and independent validation found 75 percent of its quantified estimates fell within ±50 percent of a metered reference value.
- Real-time grid carbon data already exists. WattTime publishes marginal emissions rates for electric grids that refresh every five minutes and, as of its October 2024 expansion, cover nearly every country.
- The gap isn't just detection, it's attribution. Knowing a plume exists over a facility is not the same as knowing which piece of equipment, which supplier, or which process caused it.
The problem: carbon accounting lags reality
Corporate emissions reporting was built for annual financial cycles, not physical processes. Companies typically file greenhouse gas disclosures months after their fiscal year closes, using a framework split into three categories under the GHG Protocol: Scope 1 (direct emissions from owned operations), Scope 2 (emissions from purchased electricity), and Scope 3 (everything in the value chain, from supplier manufacturing to product use and disposal).
Scope 1 and Scope 2 are relatively easy to measure because they involve fuel receipts and utility bills a company already has. Scope 3 is different. For most consumer goods and manufacturing companies, it makes up 70 to 90 percent of total emissions, yet it depends on data from hundreds or thousands of suppliers who may not measure their own emissions consistently, or at all.
That combination, a slow reporting cadence layered on top of an incomplete data set, means a company or regulator often doesn't know a facility has drifted over its emissions budget until the year is already over. By then the fuel has been burned, the plume has dispersed, and the only tool left is a penalty rather than a fix.
That single fact captures the paradox at the center of this whole topic: the same AI infrastructure boom that is driving up global electricity demand is also what makes minute-by-minute emissions tracking technically possible for the first time. Training and running large models requires enormous, sustained compute, and that compute footprint is exactly the kind of thing real-time monitoring tools were built to expose. For more on why that compute demand is so large in the first place, see why AI needs so much computing power.
How satellites turn invisible gas into a data feed
Carbon dioxide and methane are invisible to the naked eye, but they absorb specific wavelengths of infrared light in ways that spectrometers on orbiting satellites can detect. That's the physical basis for the entire satellite emissions-monitoring industry, and it has moved from research curiosity to operational infrastructure in under a decade.
The two satellite tiers: wide-area survey vs. targeted point-source
There are effectively two layers of satellite coverage working together. Wide-area instruments like the European Space Agency's Sentinel-5P, carrying the TROPOMI spectrometer, scan the entire globe daily at a coarse resolution, around 7 by 3.5 kilometers per pixel, and are good at spotting that something anomalous is happening over a region. Sentinel-5P has been operating since October 2017 at an altitude of 824 kilometers, according to the European Space Agency.
Targeted, high-resolution satellites then zoom in. GHGSat's constellation measures methane plumes at 25-by-25-meter pixel resolution over 150-square-kilometer domains, fine enough to attribute a leak to a specific piece of equipment at a specific facility rather than a whole industrial zone. In controlled testing against a known, metered release of methane, GHGSat's targeted system quantified a 0.20 metric ton per hour emission to within 13 percent, and in a broader independent validation, three-quarters of its quantified estimates landed within ±50 percent of the true metered value, a level the study's authors called comparable to airplane-based remote sensing, according to a peer-reviewed evaluation published in the Journal of Geophysical Research: Atmospheres.
Think of it like the difference between a weather radar and a home thermometer. The wide-area satellite is the radar: it tells you a storm system exists somewhere over the county. The targeted satellite is the thermometer on your porch: it tells you exactly how hot it is at your specific address. You need both, because the radar can't give you precision and the thermometer can't give you coverage.
Where machine learning enters the pipeline
Raw spectrometer data is not, by itself, an emissions number. A satellite measures a column of atmospheric gas concentration; converting that into "this facility emitted X tons per hour" requires modeling how the gas would have dispersed under the observed wind speed, wind direction, temperature, and atmospheric pressure at the time of the pass. That inversion problem, working backward from a concentration field to a source rate, is where machine learning has made the biggest difference over the past five years.
Models trained on large volumes of known emission events (metered releases used specifically to validate the algorithms) now let researchers automate detection and quantification of plumes at a scale no team of human analysts could match by manually reviewing satellite imagery. This is what makes global-coverage projects like Climate TRACE possible: as of its November 2024 expansion, the coalition tracks roughly 660 million individual emitting assets worldwide, releasing updated global data monthly with only a 60-day lag, a dramatic compression compared to the 12-to-18-month lag typical of national emissions inventories.
Why satellite detection still has real limits
Satellite-based detection is not a perfect, all-seeing sensor, and treating it that way would be a mistake. Independent evaluation of GHGSat's constellation found detection limits vary meaningfully by instrument generation, from around 100 kilograms per hour in the best case to 240 kilograms per hour for older units, meaning smaller leaks below that threshold simply don't register. Weather matters too: cloud cover blocks the optical and infrared measurements these satellites depend on, so a persistently overcast region can go weeks without a usable pass.
There's also a source-attribution problem baked into the physics. A satellite measuring elevated CO2 over an industrial area cannot, on its own, distinguish fossil-fuel combustion from biogenic sources like forest respiration or soil decomposition happening nearby. Methane detection is somewhat cleaner because biogenic methane sources (wetlands, agriculture) tend to have different spatial signatures than a concentrated industrial leak, which is part of why methane point-source detection has advanced faster commercially than CO2 point-source detection.
Regulatory infrastructure is catching up
Detection technology only changes outcomes if it's connected to enforcement, and 2024 marked a turning point on that front in the United States. The Environmental Protection Agency's final methane rule for the oil and gas sector established a formal Super Emitter Program, defining any methane release above 100 kilograms per hour as a reportable "super-emitter event." Under the rule, EPA-approved third parties, using satellite detection, aircraft-based remote sensing, or mobile ground monitoring, can submit evidence of a release directly to an EPA portal.
How the EPA's super-emitter reporting chain works
- Detection: A certified third party (using EPA-approved satellite or aircraft technology) identifies a release above the 100 kg/hour threshold.
- Submission: The finding must be filed with EPA within 15 calendar days of detection.
- Notification: EPA reviews the submission and notifies the facility owner or operator.
- Investigation: The responsible party has 5 days to begin investigating and 15 days to report findings back to EPA.
This is a meaningful structural shift: it converts satellite data from a research tool into evidence with a legal deadline attached. That said, implementation has not been smooth. According to congressional research service reporting and subsequent EPA action, the final rule paused and delayed portions of the program's rollout to January 2027, a reminder that regulatory infrastructure often trails the underlying technology by years even after a rule is finalized.
The European Union has moved on a parallel but distinct track. Its Emissions Trading System already requires mandatory reporting from covered installations, and EU authorities have increasingly cross-referenced self-reported figures against independent satellite and third-party data as a verification check, an approach the bloc has signaled it intends to formalize further as satellite coverage under missions like Copernicus expands, according to the European Commission's climate action program.
H3: What's the CO2M mission and why does it matter?
CO2M is a planned three-satellite Copernicus constellation specifically built to monitor anthropogenic (human-caused) carbon dioxide, methane, and nitrogen dioxide from orbit. Unlike Sentinel-5P, which is optimized for broad atmospheric composition, CO2M is purpose-built for attributing CO2 emissions to specific sources. The first satellite is targeted for delivery to its launch provider by the end of 2027, according to ESA mission documentation, which will give CO2 point-source detection the kind of dedicated infrastructure methane monitoring already has through GHGSat.
Grid-level tracking: the part that's already live today
While satellite methane detection gets most of the attention, the most mature form of real-time emissions tracking is arguably the least visible: live electricity grid carbon intensity data. Every kilowatt-hour pulled from the grid carries a different carbon cost depending on what power plant is currently supplying that marginal unit of demand, coal, gas, wind, or solar, and that mix changes minute to minute.
WattTime's API publishes what's called a Marginal Operating Emissions Rate, a real-time signal (refreshed roughly every five minutes) indicating the carbon intensity of the next unit of electricity a grid will dispatch, not just the average mix. That distinction matters enormously for software that shifts computing load to cleaner hours: an AI training job that pauses during a coal-heavy evening peak and resumes during a windy overnight period can meaningfully cut its effective emissions without changing a single line of model code, only its scheduling. As of WattTime's October 2024 expansion, this kind of marginal-emissions data is now available for nearly every country in the world, according to WattTime's own announcement.
This is also the layer most directly relevant to the AI industry's growing energy footprint. Data centers are large, flexible electricity consumers with predictable load profiles, which makes them one of the more promising candidates for real-time carbon-aware scheduling. Whether that promise is being realized at scale, given how fast AI infrastructure is expanding, is a separate and unresolved question, which is part of why grid storage capacity, not just generation, remains one of the hardest unsolved problems in decarbonization. See why grid storage is hard for the underlying physics constraint.
H3: Can real-time emissions tracking be gamed?
It's harder to game than annual self-reporting, because satellite and grid data are collected independently of the company being measured. A facility can't quietly omit a plume the way it might round down a fuel receipt. But attribution is still contestable: a company can dispute whose emissions a detected plume represents, especially in shared industrial parks or leased facilities, which is why cross-checking satellite findings against facility-level metering remains necessary rather than optional.
H3: How does real-time tracking compare to annual self-reported inventories?
Annual inventories rely on a company's own activity data (fuel purchased, electricity billed) multiplied by standard emission factors, verified after the fact, if at all. Real-time tracking instead measures a physical signal, an atmospheric concentration or a grid dispatch signal, independently of what the company reports. The tradeoff is that real-time tools are strong on physical accuracy for large point sources but currently weaker at capturing diffuse, distributed emissions like transportation networks or agricultural land use.
Where this technology is being deployed today
The following comparison illustrates how different real-time tracking approaches serve different purposes, since no single tool covers the full emissions picture.
| Tool / system | What it measures | Update frequency | Best suited for |
|---|---|---|---|
| GHGSat constellation | Point-source methane plumes at facility level | Days (satellite revisit-dependent) | Oil and gas infrastructure, landfills, targeted facility audits |
| Sentinel-5P / TROPOMI | Broad atmospheric NOx, CO2, methane concentration | Daily, global | Regional trend detection, national inventory cross-checks |
| Climate TRACE | Aggregated emissions across ~660 million tracked assets | Monthly, ~60-day lag | Global and sector-level trend analysis, public accountability |
| WattTime API | Marginal grid carbon intensity | Every 5 minutes | Carbon-aware computing, load scheduling, real-time electricity decisions |
| EPA Super Emitter Program | Certified third-party methane detection reports | 15-day reporting window | Regulatory enforcement on oil and gas facilities |
Table: How major real-time emissions monitoring tools compare, based on publicly documented methodology and update cadence as of 2026.
None of these tools, on their own, replaces comprehensive Scope 3 accounting. What they collectively do is shrink the window between "an emission event happens" and "someone with the authority to act knows about it," from a year down to days, and in the case of grid data, down to minutes. Emissions from suppliers are a large part of that gap, and AI is also being applied there, as in AI and supply chain decarbonization.
Challenges and limitations that remain unsolved
The attribution problem
A facility might show elevated emissions because of its electricity source, its natural gas use, a manufacturing process, or a supplier's raw materials arriving with embedded upstream carbon. Satellite and grid data are good at telling you that an anomaly exists over a location; they are much weaker at telling you which internal process caused it. Disaggregating that typically still requires old-fashioned tools: sub-metering individual circuits, auditing supplier-level data, and cross-referencing production schedules against emissions timing.
Baseline uncertainty
Knowing whether an emissions reading is "high" requires a credible baseline for what's normal at that facility. A 10 percent increase in production doesn't map cleanly to a 10 percent increase in emissions, because efficiency gains, equipment age, and seasonal heating or cooling load all shift the relationship. Building baseline models robust enough to flag genuine anomalies without false-alarming on ordinary operational variation is an active area of methodological development, not a solved problem.
Regulatory inconsistency across jurisdictions
The EU's ETS, the US EPA's Super Emitter Program, and various national inventory systems don't define emissions boundaries identically. A methane release that triggers reporting obligations under one framework might fall below another's threshold entirely. Any system trying to aggregate real-time data across borders has to reconcile these differing definitions, which is itself a data-harmonization challenge layered on top of the physical measurement one.
Data privacy and competitive sensitivity
Granular, real-time emissions data can double as a proxy for production volume, essentially revealing how much a competitor is manufacturing in near-real time by watching their facility's energy draw and emissions signature. That commercial sensitivity is a genuine obstacle to voluntary data sharing, and it's part of why much of the most detailed facility-level data currently flows through regulatory or contractual channels rather than open dashboards.
What people get wrong about AI emissions tracking
A common misconception is that "AI tracks emissions" means some single unified model watches the entire planet and outputs a clean number. In reality, it's a patchwork: different satellites, different machine learning models trained for different gas types and source categories, different grid operators publishing data on different schedules, stitched together by researchers and companies for specific use cases. There is no single dashboard that gives a complete, real-time, planet-wide emissions picture today, even though the pieces for one increasingly exist.
Another frequent misunderstanding is treating satellite detection as equivalent to legal proof of a violation. A detected methane plume is evidence that triggers an investigation, not an automatic penalty. The EPA's own Super Emitter Program builds in a formal investigation period specifically because attribution and quantification still require ground-truthing before enforcement action follows.
Finally, people sometimes assume that better emissions visibility automatically translates into lower emissions. It doesn't, on its own. Microsoft's rising operational emissions despite having some of the most sophisticated internal carbon accounting in the corporate world is a useful corrective here: visibility is a precondition for reduction, not a substitute for it. Knowing exactly how much carbon a new data center emits doesn't stop that data center from being built if the underlying demand, in this case for AI compute, keeps growing faster than clean generation capacity can be added.
The takeaway
Real-time emissions tracking has moved from research prototype to operational infrastructure faster than most climate technology does, largely because the underlying physics (gas absorbs specific infrared wavelengths, grids dispatch power on a five-minute cycle) is well understood and satellite and sensor hardware has caught up to it. What machine learning adds isn't the ability to see carbon; it's the ability to process that raw physical signal fast enough, and at global scale, to turn it into something a regulator, an investor, or an engineer scheduling a training run can actually act on. The technology has clearly outpaced the regulatory and organizational systems built to use it, from a delayed EPA enforcement timeline to Scope 3 supply chains that remain largely invisible even to satellites. Visibility is necessary. It just isn't sufficient on its own. AI is being applied to other environmental problems too, such as autonomous robots battling ocean plastic pollution.
FAQ
Q: How accurate is satellite emissions detection?
A: It depends on the instrument and the source size. Independent validation of GHGSat's targeted constellation found three-quarters of quantified methane estimates fell within ±50 percent of a metered reference value, with detection limits ranging from roughly 100 to 240 kilograms per hour depending on the satellite generation, according to research published in the Journal of Geophysical Research: Atmospheres.
Q: Can AI emissions tracking be gamed by companies?
A: It's significantly harder to manipulate than self-reported annual inventories, because satellite and grid data are collected independently of the entity being monitored. Attribution disputes (whose emissions a detected plume belongs to) remain possible, especially at shared industrial sites, which is why cross-checking against facility metering is still standard practice.
Q: What's the actual value of real-time tracking versus annual reporting?
A: The core value is shrinking the response window. Under the EPA's Super Emitter Program, a certified detection must be reported within 15 days and investigated within 5 days of notification, compared to the 12-to-18-month lag typical of annual self-reported inventories, according to EPA program documentation.
Q: Does real-time tracking cover Scope 3 (supply chain) emissions?
A: Only partially, and imperfectly. Scope 3 makes up 70 to 90 percent of most companies' total footprint according to the GHG Protocol, but it's spread across thousands of suppliers who may not have their own facility-level satellite coverage or metering. Satellites can catch large point sources within a supply chain (a specific supplier's factory, for instance) but can't currently reconstruct a full Scope 3 inventory on their own.
Q: What is the difference between Sentinel-5P and GHGSat?
A: Sentinel-5P is a wide-area, daily-global-coverage instrument good at spotting regional atmospheric anomalies at roughly 7-by-3.5-kilometer resolution. GHGSat is a targeted, high-resolution constellation that zooms into specific facilities at 25-by-25-meter resolution to attribute and quantify a leak to a specific source, according to ESA and GHGSat mission documentation.
Q: What is WattTime and how is it different from satellite tracking?
A: WattTime tracks electricity grids rather than atmospheric gas. Its API reports the Marginal Operating Emissions Rate, essentially the carbon cost of the next unit of electricity a grid will dispatch, updated roughly every five minutes and covering nearly every country as of its October 2024 expansion, according to WattTime. It's used for carbon-aware computing rather than industrial leak detection.
Q: Why did Microsoft's emissions rise even with advanced carbon tracking in place?
A: Microsoft's operational emissions rose 25 percent between fiscal 2024 and fiscal 2025, driven by AI data center construction and the electricity needed to power it, despite having detailed internal emissions monitoring. Tracking measures emissions accurately; it doesn't automatically reduce the underlying demand driving them, according to Microsoft's own sustainability reporting and subsequent FY2025 coverage.
Q: Is a CO2-specific satellite mission coming?
A: Yes. The Copernicus CO2M mission is a planned three-satellite constellation purpose-built to monitor anthropogenic carbon dioxide, methane, and nitrogen dioxide, with the first satellite targeted for delivery to its launch provider by the end of 2027, according to ESA mission planning documents.
Q: Does better emissions tracking actually reduce emissions?
A: Not by itself. Tracking creates the data needed to identify violations, target interventions, and hold reporting accountable, but reduction still requires action, cleaner generation, efficiency upgrades, or demand reduction, layered on top of that visibility. The gap between measuring AI's growing energy footprint and actually curbing it is explored further in why AI needs so much computing power.
Q: How does methane tracking connect to the broader climate impact of methane?
A: Methane is prioritized for real-time satellite tracking partly because of its outsized short-term warming effect, it traps substantially more heat than CO2 over a 20-year window despite breaking down in roughly a decade, which makes rapid detection and mitigation especially high-leverage. See why methane matters for climate change for the underlying atmospheric chemistry.
Read next:
Follow new articles
Add SciHub101 to your feed reader to see new science and technology stories.
About the Author
SciHub101 is an independent science and technology publication founded and edited by Buğra Sözeri, a software engineer and app developer based in Türkiye. AI tools assist with drafting and research. Source documentation in the existing archive is uneven, and articles are being reviewed and corrected. The Editorial Team byline identifies editorial responsibility; it does not certify specialist or independent human review. Where we compare products, anything built by our own team is labelled as such — see the editorial guidelines and About page for how corrections and disclosures work.
Related Articles

Smart Buildings & AI: How Machine Learning Cuts HVAC Energy Use
How machine learning forecasts occupancy, tunes HVAC setpoints, and flags failing equipment early, and why measured savings in offices are smaller and harder to prove than the headline numbers suggest.

AI & Biodiversity: Satellite Monitoring Protects Endangered Species
How neural networks detect endangered animals, track population decline, predict extinction.
AI & Disaster Prediction: Early Warning Systems Save Lives
How machine learning models forecast floods, hurricanes, and earthquake aftershocks days to weeks ahead, and why some disasters remain fundamentally unpredictable.
AI & Supply Chains: Decarbonizing Global Logistics
How machine learning route optimization, demand forecasting, and supplier scoring are cutting carbon out of global logistics, and where those gains still fall short.
How to Reduce Your Carbon Footprint: 20 High-Impact Actions (Ranked by Real Data)
The average person in a high-income country produces 16 metric tons of CO2-equivalent emissions annually. Half of this comes from four categories: transportation (27 percent), energy (home heating/cooling and electricity, 25 percent), food (14 percent), and consumption (goods and packaging, 14 percent). Reducing your carbon footprint requires action in these four areas. However, the impact varies dramatically. Flying four times per year generates 2 metric tons (12 percent of your footprint); driving 10,000 miles generates 2 metric tons; eating meat 5 times weekly for a year generates 0.5 metric tons. A household reducing driving 50 percent saves 1.5 metric tons per year; switching to a renewable-energy grid saves 2–4 metric tons annually; adopting a plant-dominant diet saves 0.3–1 metric ton per year. This guide ranks reduction actions by real-world impact (based on life-cycle assessment studies and carbon accounting data), separates high-impact actions from feel-good gestures, and addresses the systemic limitations of individual action. The highest-impact step is also the most difficult: reduce air travel. The second-highest is home energy efficiency. The third is dietary shift. Together, these three actions can reduce emissions by 40–60 percent; the remaining 20 actions add incremental improvements.

AI & Environmental Impact Assessments: Automating Sustainability Reviews
How machine learning speeds up environmental impact assessments for infrastructure projects, from satellite-based biodiversity scans to supply-chain carbon models.