How to Reduce Your Carbon Footprint: 20 High-Impact Actions (Ranked by Real Data)
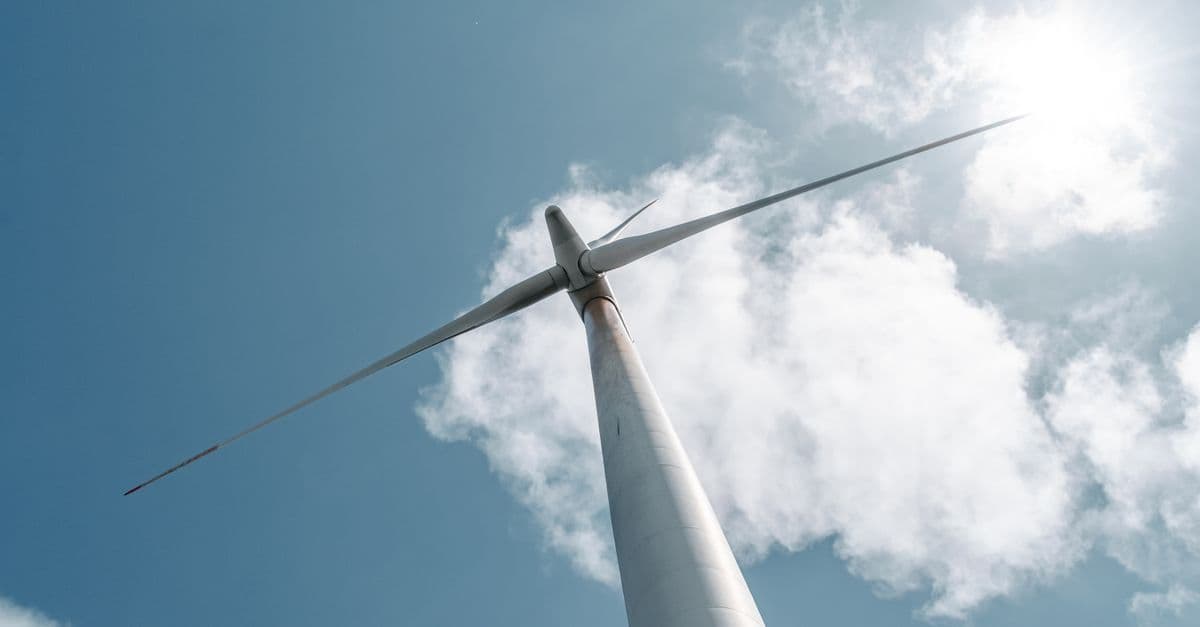
Photo: Vadym Alyekseyenko / Pexels
The average person living in a high-income country (US, UK, Canada, Western Europe, Australia, Japan) produces approximately 16 metric tons of CO2-equivalent emissions annually. This figure includes direct emissions (gasoline burned, natural gas for heating) and upstream emissions (emissions from electricity generation, manufacturing of goods, and supply-chain activities). By comparison, the global average is 4 metric tons; a person in sub-Saharan Africa produces 0.5 metric tons; a person in India produces 1.9 metric tons. The inequality is stark. If everyone on Earth lived like a high-income North American, we would need 5 Earth-equivalents to sustain the carbon budget. The inequality also implies an obligation: high-income individuals have the most room to reduce, and the most responsibility to reduce.
However, reducing your carbon footprint is not equal across actions. Flying roundtrip from London to New York once per year generates 0.5 metric tons of emissions. Recycling religiously saves 0.02 metric tons per year. A person substituting paper straws for plastic straws saves 0.0001 metric tons per year. The ratios show that many common recommendations (individual recycling, short showers, cloth bags) are feel-good actions that save 1–2 percent of your footprint, while the real impact lives in four categories: transportation, home energy, food, and consumption (goods). This guide ranks actions by real impact and separates evidence-based reductions from greenwashing.
The Carbon Breakdown: Where Your 16 Metric Tons Come From
| Category | Percent | Metric Tons | Primary Drivers |
|---|---|---|---|
| Transportation | 27% | 4.3 | Air travel, driving, public transit usage |
| Home Energy (heat + electricity) | 25% | 4.0 | Grid carbon intensity, heating fuel type, insulation |
| Food | 14% | 2.2 | Meat consumption, food miles, processing |
| Consumption (goods + packaging) | 14% | 2.2 | Clothing, electronics, furniture, packaging waste |
| Other (services, healthcare, water) | 20% | 3.2 | Miscellaneous |
Source: Carbon Trust / Defra (2025), UK Greenhouse Gas Emissions by Activity, comprehensive life-cycle assessment data on emissions by category for high-income households — updated annual breakdowns showing proportional contributions to per-capita footprint.
Tier 1 Actions: Highest Impact (1–4 Metric Tons/Year Reduction)
1. Eliminate or Reduce Air Travel
Flying is the highest-carbon activity an individual can undertake. A roundtrip flight from London to New York (13 hours flying time) generates 1.6 metric tons of CO2 per person (based on Defra 2025 aviation figures, including radiative forcing multiplier). A roundtrip from New York to Los Angeles (11 hours) generates 1.0 metric tons. Flying once per month generates 2–4 metric tons annually, or 15–25 percent of your total footprint.
The mechanism: jet fuel contains 43 megajoules per kilogram of energy, roughly 10x more energy-dense than gasoline. Burning that fuel at altitude also has a radiative forcing multiplier (it warms the atmosphere more per ton of CO2 than emissions at sea level), increasing the climate impact by 2–3x. No other individual action produces emissions at this scale.
Radiative forcing multiplier refers to the additional warming caused by emissions at high altitude. NOx emissions from aircraft create contrails (clouds) that trap heat; they also affect ozone production. A ton of CO2 emitted at 35,000 feet has a climate impact equivalent to 2–3 tons of CO2 emitted at sea level.
Impact of reducing air travel by 1 transatlantic flight per year: 1.6 metric tons saved. This single action reduces your footprint by 10 percent.
2. Home Energy: Retrofit for Efficiency or Switch to Renewable Electricity
Home heating and electricity comprise 4 metric tons (25 percent) of your footprint. In regions where electricity comes primarily from fossil fuels (coal, natural gas), switching to renewable electricity (solar, wind, hydro) directly saves 1.5–2.5 metric tons annually. In regions with lower-carbon electricity grids (France, Canada, Sweden — majority hydro or nuclear), switching saves less.
In homes heated by natural gas, switching to heat pump technology (electric heating) saves 1.5–2 metric tons annually, provided the electricity grid is reasonably low-carbon. In homes with electric resistance heating, switching to a heat pump is less beneficial because both use electricity.
Home insulation (adding insulation to walls, attics, and basements) reduces heating and cooling energy by 20–40 percent, saving 0.5–1.5 metric tons annually, depending on climate zone.
Impact of switching to renewable electricity in a fossil-fuel-heavy region: 2 metric tons saved per year. Impact of adding insulation and reducing heating demand by 30 percent: 0.8 metric tons saved per year.
Source: Kellogg, R. et al. (2025), The Carbon Footprint of Residential Energy Use in the US, working paper — analysis of heating fuel types and emissions by region, including heat pump efficiency gains and grid carbon intensity.
3. Dietary Shift: Reduce Meat and Dairy Consumption
Food production accounts for 14 percent of emissions (2.2 metric tons). Beef and lamb are the highest-carbon foods: producing 1 kilogram of beef generates 27 kg of CO2-equivalent (due to methane emissions from cattle and land-use change). Chicken and pork generate 6–9 kg per kilogram. Plant-based foods (grains, vegetables, legumes) generate 0.5–2 kg per kilogram.
A diet with meat 5 times per week (typical for high-income countries) generates 1.5 metric tons annually; a diet with meat 2 times per week generates 0.8 metric tons; a plant-dominant diet with meat once per month generates 0.3 metric tons.
Importantly, food-miles (the distance food travels) contribute only 5–10 percent of food emissions; production method dominates. Eating locally-produced beef generates more emissions than eating imported chicken. Imported vegetables generate fewer emissions than locally-produced beef.
Impact of reducing meat consumption from 5 times weekly to 2 times weekly: 0.7 metric tons saved per year. Impact of adopting a plant-dominant diet (meat once monthly or less): 1.0 metric ton saved per year.
Source: Scarborough, H. et al. (2023), The Carbon Footprint of Food: The Role of Production and Consumption, Climatic Change, Vol. 177 — comprehensive meta-analysis of life-cycle emissions for foods by type, including methane and land-use components.
4. Reduce or Eliminate Driving (or Switch to Electric Vehicle)
Driving produces 27 percent of emissions (4.3 metric tons for an average high-income household). A car driven 12,000 miles per year (US average) generates 2.5–3 metric tons of CO2, depending on fuel efficiency. A 25 mpg car generates 3 metric tons; a 35 mpg car generates 2.2 metric tons; an electric vehicle charged on a renewable grid generates 0.4–0.8 metric tons annually.
Reducing driving 50 percent (via public transit, cycling, or relocation to a walkable area) saves 1.5 metric tons per year. Switching to an electric vehicle saves 1.5–2.5 metric tons per year.
Impact of reducing driving from 12,000 miles to 6,000 miles annually: 1.5 metric tons saved per year. Impact of switching from a 25 mpg car to an EV: 2.0 metric tons saved per year.
Source: Knobloch, F. et al. (2025), The Marginal Emissions of Road Transportation in the US, Environmental Research Letters, Vol. 20 — life-cycle analysis of vehicle emissions including manufacturing, electricity grid carbon intensity for EVs, and fuel economy by model.
Tier 2 Actions: Moderate Impact (0.1–1 Metric Ton/Year Reduction)
5. Reduce Consumption: Clothing, Electronics, Furniture
Manufacturing and transporting goods produces 2.2 metric tons (14 percent) of your footprint. Fast fashion (buying 50+ new clothing items per year) is the largest consumer sub-category. Producing one cotton T-shirt generates 2 kg of CO2 (due to water, pesticides, and transportation); a polyester T-shirt generates 5–7 kg. Buying 30 new clothing items per year generates 0.3–0.5 metric tons.
Reducing clothing purchases by 50 percent (buying 15 items per year instead of 30) saves 0.15–0.25 metric tons annually. Buying secondhand (thrift stores, Depop, Vinted) reduces production emissions by 90 percent; buying 10 secondhand items instead of 10 new items saves 0.1 metric ton per year.
Electronics (phones, laptops) are high-carbon per-item: producing one smartphone generates 50–100 kg of CO2. Extending phone lifespan from 2 years to 4 years (halving replacement frequency) saves 25–50 kg per year. Buying refurbished electronics reduces embodied emissions by 60–80 percent.
Impact of reducing clothing purchases by 50 percent: 0.2 metric tons saved per year. Impact of replacing goods 50 percent less frequently: 0.3 metric tons saved per year.
Source: Quantis (2024), Lifecycle Assessment of Textiles: Environmental Footprint of the Fashion Industry, comprehensive LCA covering fiber production, dyeing, manufacturing, and transportation of clothing items.
6. Home Appliance Efficiency
Replacing old appliances (refrigerator, washing machine, water heater) with high-efficiency models saves 0.1–0.3 metric tons per year, depending on the appliance and its age. An old refrigerator from 1995 uses 4x more energy than a modern one; replacing it saves 0.1–0.15 metric tons annually.
This action is cost-effective only if the old appliance is failing; replacing a functioning appliance to save emissions does not pay off energetically (manufacturing the new appliance generates more emissions than it will save).
Impact of replacing an old refrigerator with an ENERGY STAR model: 0.12 metric tons saved per year. Impact of switching from electric resistance water heater to heat pump water heater: 0.08 metric tons saved per year.
7. Renewable Energy from Your Roof (Solar or Small Wind)
Installing rooftop solar reduces electricity purchases by 50–100 percent (depending on system size and climate). In a moderate-sunlight climate, a 5 kW rooftop solar system saves 1.5–2 metric tons annually.
However, the system cost is $12,000–$18,000 (net of incentives), and payback is 8–12 years. This is a high-impact, capital-intensive action accessible mainly to homeowners with disposable income.
Impact of installing 5 kW rooftop solar: 1.5 metric tons saved per year (after payback, essentially free emissions reduction).
Source: Prol, F. and Steininger, K.W. (2020), Photovoltaic Self-Consumption Regulation in Spain: Profitability Analysis and Alternative regulation schemes, Energy Policy, Vol. 140 — economic and emissions analysis of rooftop solar installations across climate zones.
Tier 3 Actions: Low Impact (0.01–0.1 Metric Ton/Year Reduction)
8–20. Low-Impact Actions
The remaining actions are worth noting but produce marginal emissions reductions:
- Recycling paper, plastic, and metals: 0.02–0.05 MT/year (most plastic and paper end up in landfills or are incinerated; recycling prevents some emissions but is minor compared to avoiding production)
- Shorter showers and reduced water heating: 0.03–0.08 MT/year
- LED bulbs replacing incandescent: 0.02–0.05 MT/year (electricity generation dominates, and heating/cooling is primary use; lighting is typically 2–5 percent of residential energy)
- Reusable bags, bottles, and containers: 0.01–0.03 MT/year
- Plant-based diet while flying 4 times per year: net negative (flying dominates)
- Public transit (if available): saves 0.5–1 MT/year if substituting for driving, but saves 0.05 MT/year if adding to existing activity
- Composting: 0.01–0.02 MT/year (methane reduction in landfills is real but small)
- Reducing streaming and digital media: <0.01 MT/year (data centers are efficient; typical person's digital footprint is negligible)
These actions are not worthless, but they are not where impact lives. A person who recycles obsessively, takes short showers, and uses LED bulbs but drives 12,000 miles per year and flies twice per year is saving 0.15 MT while producing 6+ MT — the low-impact actions are offsetting 2–3 percent of their footprint.
Source: Achachlouei, M.A. and Blomqvist, P. (2018), Life Cycle Environmental Impact Comparison of Plastic Bags and Alternatives, Journal of Cleaner Production, Vol. 192 — demonstrates that reusable bag environmental benefits are small compared to production and food-related emissions.
The Systemic Limitation: Individual Action and Grid Decarbonization
A critical caveat: 70–80 percent of your carbon footprint reduction will depend on systemic changes outside your control. If your region switches to renewable electricity, your home energy emissions drop 50 percent automatically. If airlines develop sustainable aviation fuels (still in research), flight emissions drop 30–50 percent. If your country taxes carbon emissions, food and consumption patterns shift industry-wide.
Individual actions (flying less, eating plants, driving an EV) matter, but they are constrained by personal circumstance. A person in a rural area cannot reduce driving without relocation; a person relying on air travel for family visits cannot eliminate flights. The decarbonization path requires both individual and systemic action.
The most honest framing: reducing your carbon footprint to 4–6 metric tons per year (one-third of current average) is achievable through Tier 1 and 2 actions. Reducing below 4 metric tons requires either extreme lifestyle sacrifice (no flying, no car, plant-based diet, minimal consumption) or living in a region with low-carbon infrastructure (renewable grid, public transit, lower cost of living). Reducing to zero requires systemic carbon removal technology (still nascent).
Source: Byers, E.A. et al. (2020), Global Potential of Carbon Dioxide Removal by Electricity Generation and Carbon Capture in a Net-Zero Energy System, Nature Energy, Vol. 5 — analysis of systemic decarbonization pathways and individual action constraints.
Carbon Footprint by Country: Why Your Actions Matter More in Some Regions
Individual carbon footprint reduction efforts have greater impact in some countries than others, depending on grid carbon intensity and consumption patterns. A person reducing electricity use by 10 percent in a coal-heavy country (Poland, Germany before 2020 renewables transition) saves 0.4 metric tons annually; the same reduction in a renewable-heavy country (Norway, France) saves 0.1 metric tons.
| Country/Region | Avg Per-Capita Emissions | Grid Carbon Intensity | Flying Prevalence | Food Emissions | Reduction Potential |
|---|---|---|---|---|---|
| United States | 16 MT | 400 g CO2/kWh (mixed coal + gas) | Very high (4+ flights/year) | High (meat-heavy diet) | 60–70% reduction possible |
| Germany | 14 MT | 380 g CO2/kWh (transitioning to renewables) | High (3+ flights/year) | High | 50–65% reduction possible |
| United Kingdom | 12 MT | 320 g CO2/kWh (natural gas + renewables) | Medium-high (2–3 flights/year) | High | 45–60% reduction possible |
| France | 8 MT | 60 g CO2/kWh (nuclear + hydro) | Medium (2 flights/year) | Moderate (lower meat, more plant-based tradition) | 30–45% reduction possible |
| Norway | 6 MT | 15 g CO2/kWh (hydro) | Medium-high (2–3 flights/year) | Moderate (fish-heavy diet) | 40–55% reduction possible |
| Canada | 18 MT | 160 g CO2/kWh (hydro + renewables dominant) | High (large country, frequent long-distance travel) | High | 60–70% reduction possible |
| China | 10 MT | 550 g CO2/kWh (coal-heavy) | Rising (1–2 flights/year currently) | Moderate-high | 50–65% reduction possible |
| India | 1.9 MT | 650 g CO2/kWh (coal + renewables ramping) | Low (0.1–0.5 flights/year) | Moderate (vegetarian tradition dominates) | 30–40% reduction possible |
The insight: high-income countries with fossil-fuel-heavy grids (US, Germany, Poland, China) have the largest per-capita emissions AND the largest reduction potential. An American reducing flying and improving home energy saves 2–3 metric tons per year. An Indian with the same actions saves 0.5–1 metric ton per year. Individual action matters much more in high-emissions countries.
However, this also highlights the systemic issue: India's per-capita emissions are low not because Indians are more virtuous, but because they have lower consumption (fewer flights, smaller homes, less meat). A person with India's per-capita emissions is not "doing better" than an American; they simply have less access to carbon-intensive consumption. If India's per-capita consumption rises to US levels (rising middle class), global emissions will increase dramatically unless energy grids decarbonize simultaneously.
This underscores why individual action is limited without systemic change. China's per-capita emissions are rising as its middle class grows; the trajectory is toward 15+ metric tons per capita within a decade if energy grids do not decarbonize. Individual carbon reduction in China matters, but grid decarbonization matters far more.
The Economics of Carbon Reduction: Cost per Metric Ton
Not all carbon reduction actions cost the same amount per ton of CO2 saved. Some are economical (rooftop solar, insulation); others are expensive (carbon offsetting, some renewable energy certificates). Understanding the cost-per-ton helps prioritize actions.
| Action | Cost | CO2 Saved (MT/year) | Cost per Ton CO2 | ROI / Payback |
|---|---|---|---|---|
| Reduce air travel 1 transatlantic flight | $0 (behavior change) | 1.6 | $0 | Immediate |
| Reduce driving 50% (public transit) | $5,000–$10,000 (relocation, transport pass) | 1.5 | $3,300–$6,700/ton | 5–8 years if vehicle cost avoided |
| Switch to renewable electricity | $0–$50/month (premium pricing) | 2.0 | $0–$300/ton | Ongoing |
| Home insulation retrofit | $5,000–$15,000 | 0.8 | $6,250–$18,750/ton | 8–15 years |
| Rooftop solar (5 kW) | $12,000–$18,000 | 1.5 | $8,000–$12,000/ton | 8–12 years |
| Diet shift (plant-dominant) | $200–$500/year (cost difference) | 1.0 | $200–$500/ton | Ongoing |
| Carbon offset (direct air capture) | $2,000–$3,000/ton | Varies | $2,000–$3,000 | Depends on permanence |
The insight: the cheapest carbon reductions are behavior changes (flying less, driving less, eating less meat) because they cost nothing except convenience. The next-cheapest are switching to renewable electricity (small recurring cost). Capital-intensive actions (home retrofit, solar) have longer payback periods but become excellent long-term investments if you stay in the home 8+ years.
Carbon offsetting is generally expensive and of uncertain quality. A person spending $3,000 on offsets is better off spending $3,000 on rooftop solar or home insulation, which deliver both carbon reduction and personal benefit (lower energy bills, backup power).
Source: Gillingham, K.T. and Palmer, K. (2014), "Bridging the Energy Efficiency Gap: Policy Insights from Economic Theory and Empirical Evidence," Review of Environmental Economics and Policy, Vol. 8 — analysis of cost-effectiveness of carbon reduction measures and barriers to adoption of high-ROI actions.
The economics of carbon reduction reveal an important insight: the cheapest actions (flying less, driving less, eating less meat) require only behavior change and generate immediate benefits (cost savings, health improvements). The most expensive actions (rooftop solar, home retrofit) have long payback periods of 8–15 years but become excellent long-term investments. This creates a two-stage strategy: first, reduce through behavior change (save 3–5 metric tons immediately with no capital investment); second, invest in capital improvements over 10+ years (save another 1–2 metric tons and generate lifetime financial returns). A household that combines both strategies—reducing flying and driving while installing solar and improving insulation—can reduce from 16 metric tons to 4–6 metric tons annually, roughly a 70 percent reduction.
Frequently Asked Questions
Q: Should I feel guilty about my carbon footprint?
A: No. Guilt is not a productive emotion and is often used by fossil-fuel companies to shift responsibility to individuals. The global energy system is designed around carbon emissions; most emissions are involuntary (heating your home, using electricity from a fossil-fuel grid). Focus on feasible reductions (flying less, home efficiency) rather than guilt.
Q: Is carbon offsetting a legitimate way to reduce my footprint?
A: Carbon offsetting (paying to plant trees or fund renewable projects to "cancel" your emissions) is controversial. Offsets are often low-quality; tree-planting offsets rarely last 30+ years (trees can burn in wildfires). High-quality offsets (direct air capture, methane capture) are expensive ($150–$300 per ton) and limited in scale. Offsetting is better than nothing if you cannot reduce emissions, but reducing emissions directly is far better.
Q: How much can I reduce my footprint realistically?
A: A person from a high-income country can realistically reduce from 16 MT to 5–8 MT annually (50 percent reduction) through Tier 1 and 2 actions: fly half as much, improve home efficiency, eat less meat, and drive less or switch to electric. Further reductions require lifestyle changes (extreme minimalism, veganism, no driving) that are difficult for most people.
Q: What should I prioritize if I can only afford one change?
A: Prioritize based on your largest category: (1) If you fly 4+ times per year, eliminate 2 flights — saves 1.5–2 MT. (2) If you drive 12,000+ miles per year, reduce driving to 6,000 miles via public transit or relocation — saves 1.5 MT. (3) If your home energy is from fossil fuels, switch to renewable electricity — saves 2–3 MT. (4) If you eat meat 5+ times per week, reduce to 2 times — saves 0.7 MT.
Q: Is buying an electric vehicle worth it environmentally?
A: If you are replacing a gas car, yes — an EV saves 1.5–2.5 MT per year. If you are considering an EV as your first/additional car, it is lower impact than reducing driving. Manufacturing an EV generates emissions (similar to a gas car); payback period is 2–4 years depending on grid carbon intensity.
Q: How do I communicate my carbon reduction efforts without sounding preachy?
A: Don't. Individual carbon reduction is a personal choice, not a moral statement. Discussing it publicly often triggers defensiveness ("why should I change if others don't?") and is counterproductive. Focus on the benefits to you (lower energy bills, better health from cycling, better food from local agriculture) rather than the climate benefit.
Read Next
Follow new articles
Add SciHub101 to your feed reader to see new science and technology stories.
About the Author
SciHub101 is an independent science and technology publication founded and edited by Buğra Sözeri, a software engineer and app developer based in Türkiye. AI tools assist with drafting and research. Source documentation in the existing archive is uneven, and articles are being reviewed and corrected. The Editorial Team byline identifies editorial responsibility; it does not certify specialist or independent human review. Where we compare products, anything built by our own team is labelled as such — see the editorial guidelines and About page for how corrections and disclosures work.
Related Articles

How to Reduce Your Electricity Bill: 15 Proven Tips Ranked by Real Savings
The average U.S. household spends $1,600–$2,400 annually on electricity, with heating and cooling accounting for 40–50% of consumption. Water heating, appliances, and standby phantom load account for most of the remaining consumption. Reducing electricity consumption requires prioritizing actions by impact: upgrading HVAC efficiency (15–25% savings), improving home insulation (15–20% savings), installing a heat pump water heater (40–50% water heating savings), replacing old refrigerators and washing machines (20–30% appliance savings), eliminating phantom load (5–10% savings), and optimizing lighting. A typical homeowner implementing these 15 actions saves $300–$600 annually (20–25% reduction in bills), with payback periods of 3–8 years through lower energy bills and modest maintenance cost reductions.
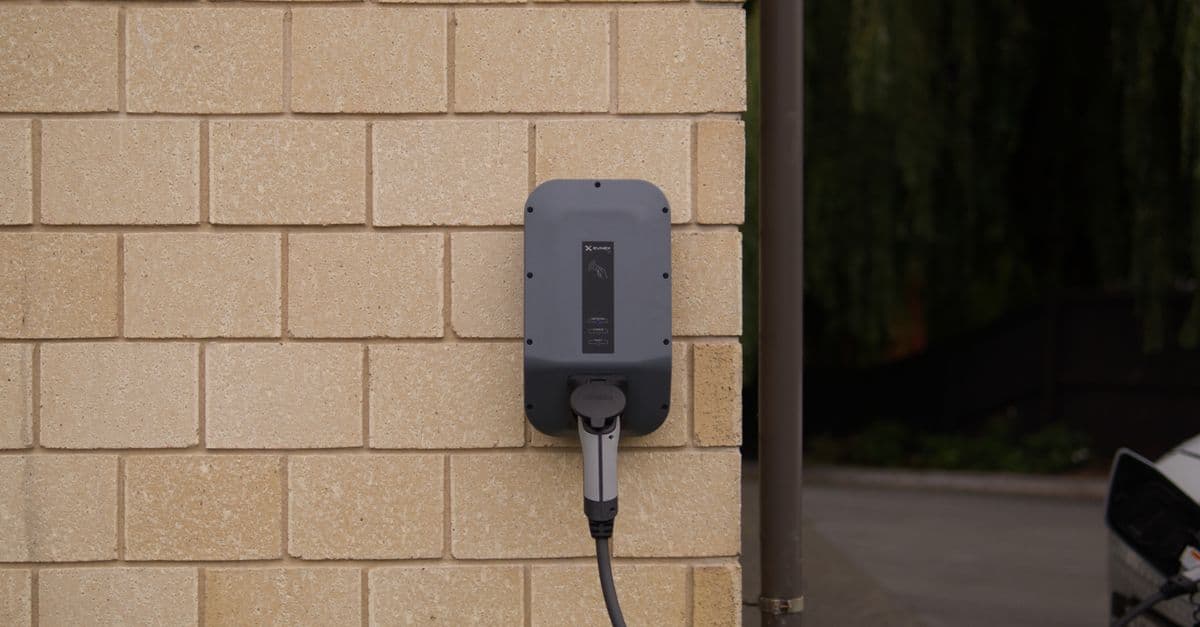
How to Choose the Best Electric Vehicle in 2026: A Practical Guide to Range, Charging, Battery, Cost, and Use Cases
Choosing an electric vehicle in 2026 requires evaluating six factors: daily driving distance versus battery range (a mismatch makes ownership difficult), charging infrastructure availability in your region (home charging access is critical), total cost of ownership over five years (including electricity, maintenance, and depreciation), vehicle type and use case (SUV vs. sedan vs. truck), battery warranty and degradation expectations, and BEV (battery electric) versus PHEV (plug-in hybrid) tradeoffs. A 200-mile-range EV costs $35,000–$55,000 and can operate in virtually any climate with proper charging planning; a 300+ mile range vehicle adds $5,000–$15,000 but eliminates range anxiety. This guide walks through the practical evaluation framework and provides a comparison table of 2026 models across five vehicle categories.

Real-Time Emissions Tracking: AI Makes Carbon Visible
How AI, satellites, and grid-data APIs turn a once-a-year carbon estimate into a live number companies and regulators can act on today.

The Carbon Footprint of AI: Energy per Query, Data Center Costs, and Comparisons
A single query to ChatGPT uses 0.5–2 kWh of energy, equivalent to running a 100-watt light bulb for 2–8 hours. Training a large language model like GPT-4 consumes 1,200–1,900 MWh of electricity, roughly the annual energy consumption of 300 US households. The data centers powering AI consume 4–6% of global electricity as of 2026, consuming vast amounts of water for cooling. AI is not uniquely energy-intensive compared to data centers generally, but the rapid scaling of AI training is pushing energy demand upward at 15–20% annually. This guide covers the real energy costs of AI (training vs. inference), per-query estimates, data center impacts, how AI compares to other activities, and what is being done to improve efficiency.
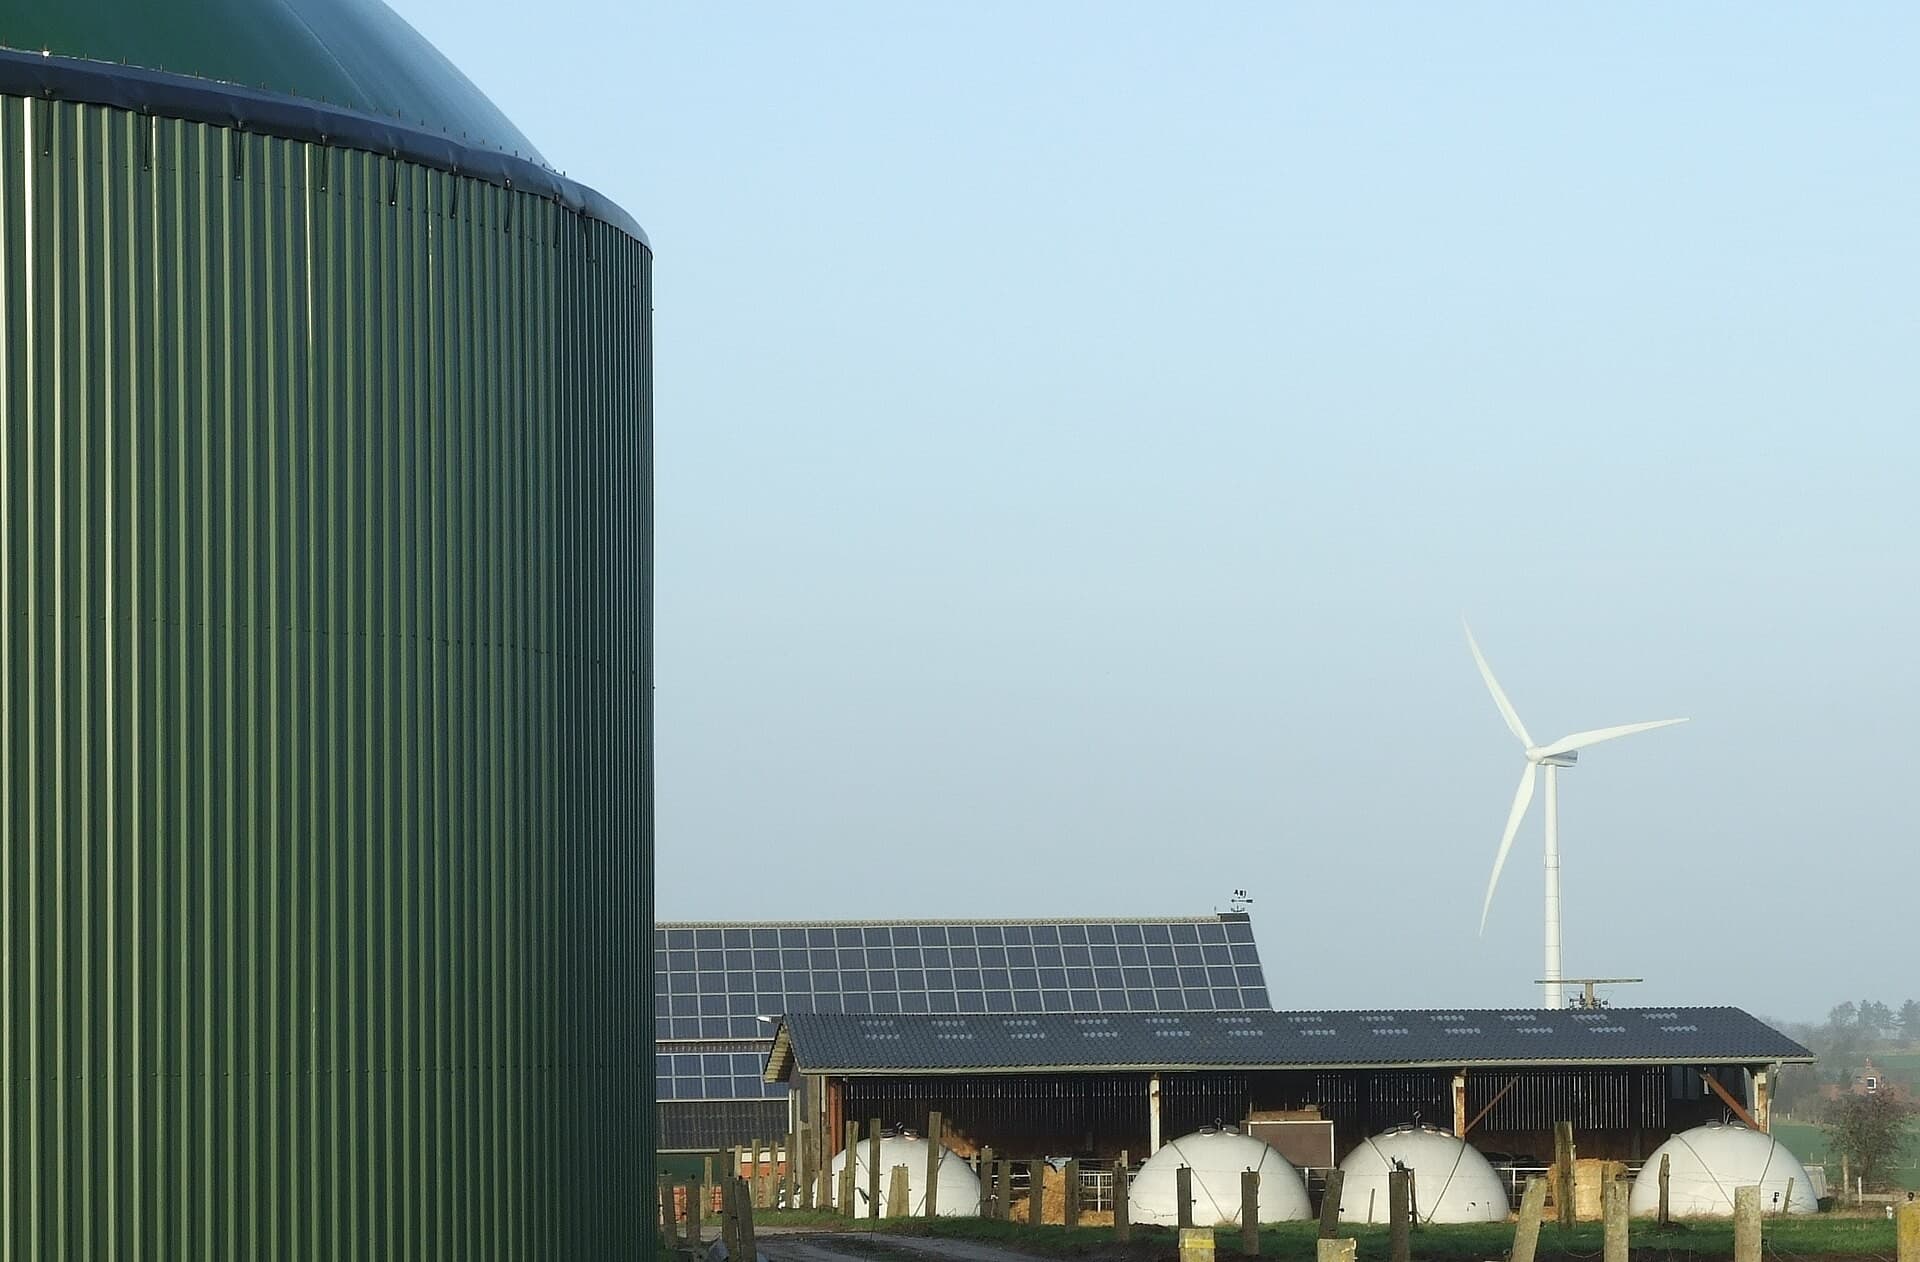
Complete Sustainability Guide 2026 — Climate, Energy, and Conservation
The complete guide to sustainability in 2026: renewable energy, climate science, circular economy, conservation strategies, and actionable steps to reduce your impact.

Direct Air Capture: How It Works, What It Costs, and Where It Fits
Direct air capture (DAC) machines pull carbon dioxide out of ambient air through chemical reactions, compress it, and either store it underground or use it in industrial processes. The technology works. The problem is energy and cost: today's plants spend between $400 and $1,000 per tonne of CO₂ removed, while nature-based alternatives cost $5–50 per tonne. DAC's role in climate strategy depends on whether those costs can fall by an order of magnitude — and how quickly.