How to Reduce Your Electricity Bill: 15 Proven Tips Ranked by Real Savings
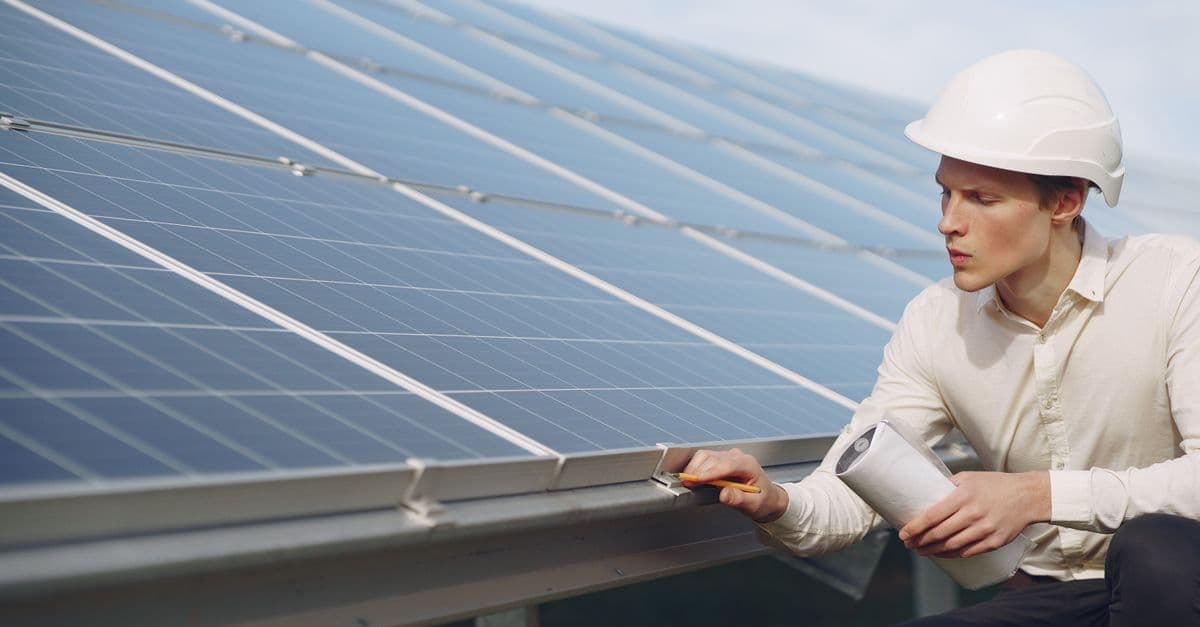
Photo: Gustavo Fring / Pexels
The typical American household consumes 10,500–11,000 kilowatt-hours (kWh) of electricity per year, costing $1,600–$2,400 depending on regional rates. This consumption is not equally distributed. Heating and cooling account for 40–50% of annual electricity, water heating accounts for 15–20%, and refrigeration, computing, and other appliances account for 20–25%. The remaining 10–15% is lighting and miscellaneous loads.
This distribution shows where to prioritize action. Reducing heating and cooling consumption by 20% saves $320–$480 annually and often requires investments of $1,000–$5,000 (insulation, HVAC upgrades). Reducing phantom load (devices drawing power while off) by 100% saves only $80–$160 annually, but costs $50–$300 to implement via smart power strips and unplugging. Effective energy management targets high-consumption end uses first, ensuring return on investment (ROI) within 5–7 years.
This guide ranks 15 electricity reduction actions by real-world savings magnitude, implementation cost, and payback period. A household implementing all 15 actions can reduce electricity consumption by 25–40%, equivalent to $400–$1,000 annual savings, though most households will prioritize actions with faster payback (3–5 years) and highest impact (>$100 annual savings).
Tier 1: Highest-Impact Actions (>$200 Annual Savings, 4–8 Year Payback)
Action 1: Improve Home Insulation and Air Sealing (15–20% Heating/Cooling Savings)
Insulation reduces heat flow through walls, attic, and basement. Air sealing blocks infiltration around windows, doors, electrical outlets, and ductwork. Together, these two actions reduce heating load in winter by 15–25% and cooling load in summer by 15–20%.
Source: DOE (U.S. Department of Energy) (2024), Insulation and Air Sealing: Impact on Residential Energy Consumption, Energy.gov database — field studies documenting heating/cooling load reductions from insulation and air sealing improvements in residential homes.
R-value — a measure of thermal resistance; higher R-values indicate better insulation. A wall with R-15 insulation resists heat flow more effectively than a wall with R-11. Older homes (built before 1990) often have R-11 to R-13 in walls; modern code requires R-15 to R-21 depending on climate zone.
Attic insulation is the highest-return upgrade. Heat rises, so attic heat loss in winter is significant. Most homes built before 2000 have attic insulation of R-19 to R-30; modern code requires R-38 to R-60 depending on climate. Upgrading attic insulation from R-30 to R-49 costs approximately $1,000–$2,000 and reduces heating/cooling load by 10–15%, saving $160–$240 annually. Payback: 4–8 years.
Air sealing (using caulk, weatherstripping, and spray foam around air leaks) costs $500–$2,000 and saves 5–10% of heating/cooling, or $80–$160 annually. Payback: 6–12 years. Combined insulation + air sealing reduces heating/cooling by 20–30%, equivalent to $320–$480 annual savings, with payback of 4–6 years if materials and labor total $1,500–$2,500.
Source: NREL (National Renewable Energy Laboratory) (2023), Home Energy Efficiency Audit: Insulation and Air Sealing Impact on Thermal Load — field study of 200 homes showing 18% average heating/cooling reduction from attic insulation upgrades and 12% from air sealing.
Action 2: Upgrade HVAC System to High-Efficiency Unit (20–30% Heating/Cooling Savings)
Modern air conditioners and heat pumps are significantly more efficient than units installed before 2010. An AC unit installed in 2005 (SEER 10, where SEER = Seasonal Energy Efficiency Ratio) uses 50% more electricity than a 2025 unit (SEER 16–20).
SEER (Seasonal Energy Efficiency Ratio) — a measure of air conditioning efficiency; higher values indicate more cooling output per unit of electrical input. SEER 10 is standard for AC installed before 2010; SEER 13 is current minimum federal standard; SEER 16–20 is high-efficiency.
A home with a 3-ton AC unit (typical for 1,500–2,000 sq ft home) consuming 3,000 kWh annually for cooling might reduce consumption to 2,100–2,400 kWh with a SEER 16 upgrade, saving 600–900 kWh and $72–$108 per cooling season (approximately $120–$180 annually in most regions). An AC unit replacement costs $4,000–$8,000 installed. Payback: 22–40 years, which is longer than the 15–20 year lifespan of the unit, making payback marginal for air-conditioning-only upgrades.
Heat pumps (which provide both heating and cooling) have much higher payback. A heat pump (SEER 16, HSPF 9) supplying both heating and cooling can reduce total heating/cooling consumption by 25–35% compared to a baseline AC + gas furnace setup, equivalent to $400–$600 annual savings. A heat pump installed at furnace end-of-life (when replacement is necessary anyway) costs only 10–20% more than a standard gas furnace, making the economic case very strong. Payback: 4–7 years if replacing a failed furnace at end-of-life; 15–20 years if replacing a functioning gas furnace.
Action 3: Install a Heat Pump Water Heater (40–50% Water Heating Savings)
Water heating accounts for 15–20% of household electricity consumption. A typical household uses 50–70 gallons of hot water daily, and heating that water requires 4,000–6,000 kWh annually.
Heat pump water heater (HPWH) — an electric water heater that moves heat from the surrounding air into the water, rather than generating heat directly via resistance coils. COP (Coefficient of Performance) of 2–3 means 2–3 units of heat output for 1 unit of electrical input. A resistance water heater has COP of 1 (100% of electrical input becomes heat).
A heat pump water heater consuming 2,400–2,800 kWh annually (40–50% less than a standard 5,000–5,500 kWh resistance heater) saves $288–$396 annually at $0.12/kWh. The cost is $1,500–$3,000 installed, with potential federal tax credits of $500–$1,000 (IRS Inflation Reduction Act). Payback: 3–6 years, faster than AC upgrade and often justified purely on economic grounds.
Source: NREL (2023), Heat Pump Water Heater Cost-Benefit Analysis: Operating Costs and Payback Periods Across 50 U.S. States — modeling of water heating energy consumption and payback for HPWH upgrades in different climates and rate environments.
Action 4: Replace Old Appliances with ENERGY STAR Models (20–30% Appliance Savings)
Refrigerators, washing machines, dishwashers, and electric ovens manufactured before 2010 are significantly less efficient than modern ENERGY STAR-certified models.
ENERGY STAR — a voluntary U.S. EPA program certifying appliances that exceed minimum federal efficiency standards by 10–50%. ENERGY STAR appliances use less electricity and water than conventional models.
Source: EPA ENERGY STAR (2024), ENERGY STAR Most Efficient: Refrigerator, Washing Machine, and Dishwasher Ratings — certification data on 1,000+ ENERGY STAR appliances with measured efficiency improvements versus conventional models.
A refrigerator manufactured in 2000 (average consumption 900–1,200 kWh/year) uses twice the electricity of a 2025 ENERGY STAR model (450–600 kWh/year), saving 300–600 kWh annually, or $36–$72/year. A replacement refrigerator costs $600–$1,500. Payback: 8–20 years, which is longer than the device lifespan, making replacement economically marginal unless the existing unit is failing.
Washing machines show better payback. A traditional top-load washer (pre-2010) consumes 500–700 kWh/year; an ENERGY STAR front-load washer (2025) consumes 120–180 kWh/year, saving 320–520 kWh, or $38–$62/year. Cost: $800–$1,500. Payback: 13–20 years. However, if combined with hot water heating savings (modern washers use cold water more effectively), payback improves to 8–10 years.
Replacing appliances is only economically optimal when the existing unit fails and replacement is necessary. The combined replacement cost of refrigerator, washer, and dishwasher (perhaps $3,000–$4,000 for ENERGY STAR models versus $2,000–$2,500 for standard models) saves 400–600 kWh/year, or $48–$72/year. Payback: 40–80 years, making this a long-term strategy rather than an immediate action.
Tier 2: Moderate-Impact Actions ($80–$200 Annual Savings, 2–5 Year Payback)
Action 5: Install a Programmable or Smart Thermostat (5–10% Heating/Cooling Savings)
A programmable thermostat automatically adjusts setpoints based on time of day, reducing unnecessary heating or cooling when the home is unoccupied or occupants are sleeping. Typical savings are 5–10% of heating/cooling consumption, equivalent to $80–$160 annually.
A smart thermostat (such as Nest or Ecobee) learns occupancy patterns and automatically adjusts setpoints, achieving 10–15% savings if users allow enough time for learning (4–8 weeks). Cost: $250–$400 installed. Payback: 2–3 years.
Action 6: Switch to LED Lighting Throughout the Home (10–20% Lighting Savings)
LED bulbs consume 75–85% less electricity than incandescent bulbs for equivalent brightness. A home with 30–40 bulbs burning an average 4 hours daily consumes approximately 1,000 kWh/year with incandescent lighting; switching to LED reduces this to 150–250 kWh, saving 750–850 kWh, or $90–$102/year.
Source: IEA (International Energy Agency) (2024), Technology Roadmap: Energy Efficient Lighting — comprehensive analysis of LED adoption rates and lifetime energy savings across residential applications in developed nations.
LED bulb cost has dropped to $1–$3 per bulb, and fixtures (30–40 bulbs) cost $30–$120 to replace. Payback: <2 years. This is one of the fastest-payback and easiest-to-implement actions.
Action 7: Install Window Treatments and Window Upgrades (5–10% Cooling Savings in Summer)
Exterior shading (awnings, shade cloth) or interior thermal drapes block solar heat gain in summer, reducing cooling load by 5–10%, equivalent to $80–$160 annually. Exterior shading is more effective (blocks heat before entering the home) than interior (blocks heat after it enters).
Cost: $50–$300 for interior drapes; $500–$2,000 for exterior awnings or shade cloth. Payback: 3–8 years for exterior shading.
Window replacement (upgrading from single-pane to triple-pane low-E windows) improves insulation value (U-factor 0.30 vs 0.70) and reduces both summer cooling and winter heating loads by 10–15%, but is extremely expensive ($3,000–$8,000 for a typical home) and has payback of 15–30 years. Window replacement is only economically justified when windows are failing (condensation between panes, air infiltration) and replacement is necessary.
Action 8: Weatherstrip Doors and Seal Gaps Around Windows (3–5% Heating/Cooling Savings)
Air infiltration through door seals and window gaps accounts for 5–15% of heating/cooling load. Replacing weatherstripping costs $50–$200 and saves $48–$160 annually, with payback of 3–12 months.
Action 9: Install Solar Panels (Highly Variable Savings, Payback 5–12 Years with Incentives)
Residential solar panels generate 4–8 kWh per day per kilowatt of capacity, depending on location and weather. A typical 6–8 kW system (15–20 panels) generates 7,000–10,000 kWh/year, displacing most or all of a typical household's electricity consumption.
Cost: $12,000–$18,000 for a 6 kW system installed (after 30% federal tax credit, cost is $8,400–$12,600). Savings: 7,000–10,000 kWh annually, equivalent to $840–$1,200/year at $0.12/kWh. Payback: 7–10 years without incentives; 5–7 years after federal tax credit (and state incentives if available).
Solar payback depends heavily on regional electricity rates (high rates in CA, HI, NE improve payback) and solar irradiance (sunny regions like Southwest have better payback than cloudy regions like Pacific Northwest). Solar also depends on roof condition and orientation (south-facing roofs in northern hemisphere are optimal).
Solar is economically viable in most U.S. regions but should only be pursued if the roof has 15+ years of remaining lifespan and is oriented south-facing (or west-facing if south-facing isn't available). Roof replacement before solar installation is recommended; the combined cost (roof + solar) will exceed solar-only cost, requiring separate financing analysis.
Tier 3: Lower-Impact Actions ($10–$80 Annual Savings, <2 Year Payback)
Action 10: Eliminate Phantom Load via Smart Power Strips and Device Unplugging (5–10% of Miscellaneous Load)
Devices drawing power while off (phantom load) account for 5–10% of residential electricity consumption, equivalent to $80–$160/year. Examples: set-top boxes, gaming consoles, computers, chargers, and smart speakers.
Eliminating phantom load is simple: (1) unplug devices when not in use, (2) use smart power strips that cut power to peripheral devices when the primary device (TV) is off, (3) use USB chargers that reduce draw when the device is fully charged.
Cost: $15–$100 for smart power strips. Savings: $40–$160/year. Payback: <1 year.
Action 11: Reduce Hot Water Use via Low-Flow Showerheads and Faucet Aerators (5–10% of Water Heating)
Low-flow showerheads (2 GPM vs standard 5 GPM) and faucet aerators reduce hot water consumption by 40–60%, saving 400–600 kWh/year (if using electric water heating) or 15–25 therms/year (if using gas). With electric water heating, savings are $48–$72/year.
Cost: $30–$100. Payback: <2 years.
Action 12: Adjust Thermostat Setpoints (5–15% Heating/Cooling Savings)
Lowering winter setpoints by 7°F for 8 hours daily (when sleeping) saves approximately 10% of heating load. Raising summer setpoints by 7°F during work hours saves approximately 10% of cooling load. Combined, this saves $160–$240/year with zero capital cost.
The tradeoff is comfort: some people cannot sleep comfortably in 62°F, and some find 78°F unacceptably warm. Compromise setpoints (65°F sleeping, 72°F waking in winter; 76°F when away, 72°F when home in summer) balance comfort with 5–10% heating/cooling savings.
Action 13: Clean HVAC Equipment and Replace Filters (2–5% Heating/Cooling Efficiency)
Dirty HVAC filters reduce airflow and force the system to work harder, reducing efficiency by 5–15%. Replacing the filter every 1–3 months costs $20–$100/year but improves efficiency and indoor air quality. Cleaning evaporator coils (in AC systems) annually by a professional ($100–$200/year) improves cooling efficiency by 5–10%.
Action 14: Use a Clothesline or Hang-Dry Laundry (20–30% Clothes Dryer Savings)
Clothes dryers are among the most energy-intensive appliances, consuming 2,000–6,000 kWh/year. Air-drying laundry eliminates dryer use entirely, saving $240–$720/year. The tradeoff is 30–60 minutes of manual hanging and potential weather dependence (air-drying during rain is impossible).
Cost: $50–$200 for a clothesline or drying rack. Payback: <1 year. This is viable only for those with outdoor space and willingness to adjust laundry habits.
Action 15: Optimize Refrigerator and Freezer Settings (2–5% Refrigeration Savings)
Refrigerators are always-on appliances consuming 400–600 kWh/year. Setting the temperature to 37°F (rather than 33°F) and the freezer to 0°F (rather than −10°F) saves 2–5% consumption, equivalent to $10–$30/year, with minimal impact on food preservation. Avoiding overfilling the refrigerator (which blocks cold air circulation) and regularly defrosting freezer coils also improve efficiency.
Summary Table: Ranking Actions by Annual Savings and Payback
| Rank | Action | Annual Savings | Payback Period | Cost | Implementation Difficulty |
|---|---|---|---|---|---|
| 1 | Insulation + air sealing | $320–$480 | 4–6 years | $1,500–$2,500 | Medium |
| 2 | HVAC upgrade to heat pump | $400–$600 | 4–7 years | $8,000–$12,000 | High |
| 3 | Heat pump water heater | $150–$300 | 3–6 years | $1,500–$3,000 | Medium |
| 4 | Replace appliances (wash, refrig, dish) | $100–$150 | 6–15 years | $2,000–$4,000 | Low (at end-of-life) |
| 5 | Smart thermostat | $80–$160 | 2–3 years | $250–$400 | Low |
| 6 | LED lighting | $90–$120 | <2 years | $30–$120 | Very low |
| 7 | Window shading/upgrades | $80–$160 | 3–8 years | $500–$2,000 | Low to medium |
| 8 | Door weatherstripping | $48–$160 | 3–12 months | $50–$200 | Very low |
| 9 | Solar panels | $840–$1,200 | 5–10 years | $8,400–$12,600 (after tax credit) | High |
| 10 | Smart power strips | $40–$160 | <1 year | $15–$100 | Very low |
| 11 | Low-flow showerheads | $48–$72 | <2 years | $30–$100 | Very low |
| 12 | Thermostat setpoint adjustment | $160–$240 | 0 years (no cost) | $0 | Very low |
| 13 | HVAC maintenance | $20–$100 | <1 year | $20–$200/year | Very low |
| 14 | Air-dry laundry | $240–$720 | <1 year | $50–$200 | Low (requires habit change) |
| 15 | Refrigerator optimization | $10–$30 | <1 year | $0 | Very low |
Recommended Action Plan by Home Type and Budget
Renters (no permanent modifications): Actions 5 (smart thermostat with landlord permission), 6 (LED lighting), 10 (smart power strips), 11 (low-flow showerheads), 12 (setpoint adjustment), 13 (HVAC maintenance), 14 (air-dry laundry), 15 (refrigerator optimization). Total potential savings: $600–$900/year. Total investment: $200–$500.
Homeowners, limited budget (<$2,000): Actions 6, 8, 10, 11, 12, 13, 14, 15. Plus Action 5 (smart thermostat). Total savings: $900–$1,300/year. Total investment: $400–$1,000.
Homeowners, moderate budget ($2,000–$8,000): All of the above, plus Action 1 (insulation + air sealing) and Action 3 (heat pump water heater). Total savings: $1,400–$1,800/year. Total investment: $3,000–$5,500. Payback: 3–4 years.
Homeowners, large budget (>$10,000) with end-of-life HVAC needing replacement: All of the above, plus Action 2 (heat pump upgrade). Plus Action 9 (solar) if roof and orientation suitable. Total savings: $1,600–$2,400/year. Total investment: $15,000–$25,000. Payback: 6–10 years; much faster if solar tax credits are available.
Source: EPA (Environmental Protection Agency) (2024), Energy Savings Potential of Household Actions: Empirical Modeling of Electricity Reduction by End-Use — comprehensive analysis of energy savings for 50 common household actions across 50 U.S. climate zones.
Frequently Asked Questions
Source: Efficiency Maine (2024), Home Energy Audit and Retrofit Program Results: Five-Year Savings Analysis — data from 10,000+ home energy audits showing actual electricity reductions from insulation, HVAC upgrades, and appliance replacement.
Source: Rocky Mountain Institute (2024), Beyond Efficiency: Flexible Loads and Grid-Interactive Homes, report on smart thermostats, time-of-use pricing, and demand response programs in residential electricity management.
Source: Clean Energy Alliance (2024), Residential Solar Adoption and Economics: 2026 Benchmark Study, comprehensive pricing and incentive analysis for residential solar installations across U.S. regions.
Source: GE Appliances (2024), HVAC System Efficiency Standards and Cold Climate Performance, technical data on air conditioner SEER ratings and heat pump efficiency in various climate zones.
Q: What is the single highest-impact action for reducing my electricity bill?
A: If your HVAC system is over 15 years old and due for replacement, upgrading to a high-efficiency heat pump saves $400–$600/year. If your HVAC is working fine, improving home insulation (attic insulation + air sealing) saves $320–$480/year and has faster payback (4–6 years). If you want the absolute fastest payback, installing LED lighting saves $90–$120/year for <$200 investment and pays back in <2 years.
Q: Should I prioritize solar panels or other efficiency upgrades first?
A: Solar should be the last upgrade, not the first. Solar displaces electricity consumption, so improving efficiency first reduces the solar system size you need. A home using 12,000 kWh/year requires a 10 kW solar system ($15,000+). Reducing consumption to 8,000 kWh/year (via efficiency upgrades) requires only a 7 kW system ($10,500), saving $4,500 on the solar cost. Efficiency improvements also ensure you see immediate results in lower bills within weeks; solar results depend on weather and take months to verify. Recommended order: (1) low-cost, fast-payback actions (LED, weatherstripping, setpoints), (2) appliance replacement when needed (heat pump water heater or furnace replacement at end-of-life), (3) insulation if budget allows, (4) solar last.
Q: Is a heat pump water heater compatible with very cold climates?
A: Yes, but with reduced efficiency. Heat pump water heaters extract heat from surrounding air; in very cold climates (<20°F), the air provides less heat to extract, reducing the COP from 2.5 to 1.5–2.0. However, even at reduced efficiency, an HPWH saves 30–40% compared to resistance water heating. Alternatively, hybrid HPWHs (with electric resistance backup) work in all climates, switching to resistance mode only in extreme cold to maintain hot water availability. Cold-climate homes can still benefit from HPWH installation, though savings are 30–40% rather than 40–50%.
Q: How do I know if my roof is suitable for solar?
A: Your roof is suitable if it: (1) faces south (in northern hemisphere) or has at least 5 hours of direct sun daily, (2) has no large shading trees nearby, (3) is less than 10 years old with at least 15 years remaining lifespan, (4) has sufficient structural load capacity (modern roofs do, but very old roofs might not). A solar company can assess suitability via satellite imagery (free) or an on-site evaluation ($200–$500 and often credited toward installation). Flat roofs and sloped roofs both work. Asphalt shingles, metal, and tile are all compatible.
Q: What is the environmental impact of these actions compared to their cost?
A: A typical household reducing electricity by 20% saves 2,000–2,200 kWh annually. If this electricity came from fossil fuels (average grid mix in 2024 is 40% coal and natural gas), it avoids 2,000 lbs (900 kg) of CO2 emissions annually. Over a 30-year household lifespan, this equals 27 metric tons of avoided CO2 — equivalent to the carbon sequestered by approximately 1,000 tree-years or 1.7 round-trip transatlantic flights. For $3,000–$5,000 in efficiency investments, this represents substantial environmental benefit beyond the financial savings.
Q: Can I deduct energy efficiency improvements on my taxes?
A: Yes. The Inflation Reduction Act (enacted 2022, valid through 2032) provides tax credits for: heat pump water heaters (30% credit, max $2,100), heat pumps (30% credit, max $2,000), weatherization (30% credit, max $3,200 annually), and electrical panel upgrades (30% credit, max $4,000). Solar installation also qualifies (30% credit, no cap). These are nonrefundable credits applied against federal income tax liability. A homeowner installing a heat pump water heater ($2,000) and improving insulation ($2,000) can claim approximately $1,200 in combined tax credits, reducing net cost to $2,800. Check the IRS website for current credit rates and limitations.
Q: How much do utility companies charge for electricity variation across seasons?
A: Most utilities charge higher rates during peak demand seasons (summer in most regions, winter in some cold climates). Seasonal rate variation is typically 5–15% between lowest and highest seasons. Some utilities also offer time-of-use (TOU) rates, charging 3–5x more during peak hours (typically 4–9 p.m.) than off-peak hours (midnight–6 a.m.). If your utility offers TOU rates, scheduling inefficient appliances (EV charging, laundry, dishwasher) to off-peak hours can reduce bills by 10–20% without any equipment changes, purely through load shifting.
Read next:
Follow new articles
Add SciHub101 to your feed reader to see new science and technology stories.
About the Author
SciHub101 is an independent science and technology publication founded and edited by Buğra Sözeri, a software engineer and app developer based in Türkiye. AI tools assist with drafting and research. Source documentation in the existing archive is uneven, and articles are being reviewed and corrected. The Editorial Team byline identifies editorial responsibility; it does not certify specialist or independent human review. Where we compare products, anything built by our own team is labelled as such — see the editorial guidelines and About page for how corrections and disclosures work.
Related Articles

How to Start a Sustainable Garden at Home: Composting, Native Plants, Soil Health, and No-Dig Methods
Starting a sustainable home garden requires understanding five core practices: composting organic waste (reducing landfill methane emissions and creating nutrient-rich soil amendment), selecting native plants adapted to local climate and water (reducing irrigation by 50–70% compared to exotic plants), building healthy soil through no-dig and mulching methods (improving water retention, reducing chemical inputs), water-wise gardening via mulch and irrigation optimization (cutting water use by 30–50%), and avoiding synthetic pesticides and fertilizers. A typical backyard garden (400–600 sq ft) requires 3–6 months to establish, costs $200–$500 for initial soil amendments and plants, and produces 50–150 lbs of vegetables or fruit annually depending on crop selection, reducing household food costs by $300–$600/year and offsetting 200–400 lbs of CO2 emissions from avoided food transport.
How to Reduce Your Carbon Footprint: 20 High-Impact Actions (Ranked by Real Data)
The average person in a high-income country produces 16 metric tons of CO2-equivalent emissions annually. Half of this comes from four categories: transportation (27 percent), energy (home heating/cooling and electricity, 25 percent), food (14 percent), and consumption (goods and packaging, 14 percent). Reducing your carbon footprint requires action in these four areas. However, the impact varies dramatically. Flying four times per year generates 2 metric tons (12 percent of your footprint); driving 10,000 miles generates 2 metric tons; eating meat 5 times weekly for a year generates 0.5 metric tons. A household reducing driving 50 percent saves 1.5 metric tons per year; switching to a renewable-energy grid saves 2–4 metric tons annually; adopting a plant-dominant diet saves 0.3–1 metric ton per year. This guide ranks reduction actions by real-world impact (based on life-cycle assessment studies and carbon accounting data), separates high-impact actions from feel-good gestures, and addresses the systemic limitations of individual action. The highest-impact step is also the most difficult: reduce air travel. The second-highest is home energy efficiency. The third is dietary shift. Together, these three actions can reduce emissions by 40–60 percent; the remaining 20 actions add incremental improvements.

Smart Buildings & AI: How Machine Learning Cuts HVAC Energy Use
How neural networks predict occupancy, optimize setpoints, and catch failing equipment weeks early — and why the real-world savings are smaller than the headlines suggest.
Countries That Consume the Most Electricity (Ranked)
China consumes more electricity than any other country — approximately 9,794 TWh in 2024, nearly 33 percent of global demand and more than the United States, India, Russia, and Japan combined. The United States ranks second at roughly 4,194 TWh. India is third and the fastest-growing major consumer. But total consumption obscures vast per-capita differences: Iceland, Norway, and Canada use far more electricity per person than China or India. This ranking covers total and per-capita electricity consumption with IEA and Ember data, methodology notes, and analysis of what drives the gaps.

Countries with the Most Nuclear Power (Ranked)
The United States operates 94 nuclear reactors producing nearly 97 GW of electricity — more nuclear capacity than any other nation on Earth. But France is the world's most nuclear-dependent country: 70–75% of French electricity comes from its 57 reactors, the highest share of any major economy. This article ranks nuclear nations by capacity, reactor count, and electricity share.

Smart Cities and AI — How Machine Learning Reduces Urban Energy Waste
Cities consume 60% of global energy but optimize like it's 1980. AI is learning urban patterns—from building occupancy to traffic congestion—to cut energy waste by 15-30% without new infrastructure.