Smart Cities and AI — How Machine Learning Reduces Urban Energy Waste
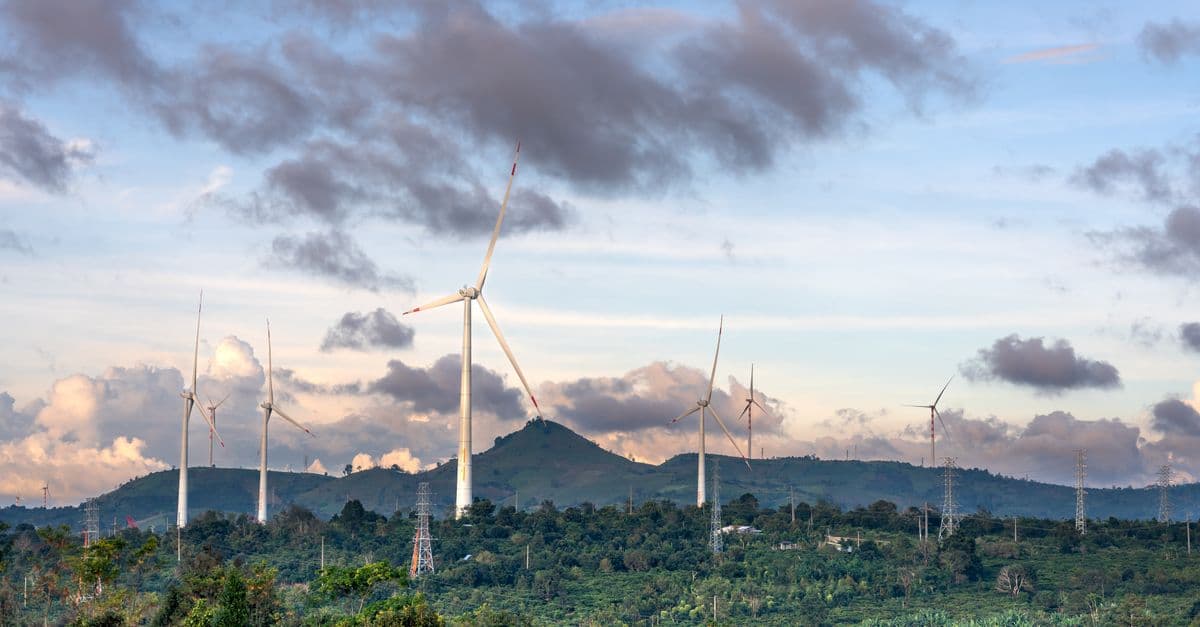
Photo: Quang Nguyen Vinh / Pexels
Cities hold about half of the world's people but account for almost two-thirds of global energy demand, according to the International Energy Agency (IEA). A large share of that energy is spent by systems that follow fixed schedules: heating that runs whether or not a floor is occupied, street lights that stay at full brightness at 3 a.m., traffic signals on timing plans drawn up years ago. Machine learning offers a way to replace the schedule with a forecast. This article explains how that works, which results have actually been measured, and where the claims run ahead of the evidence.
Where does a city actually waste energy?
The waste is rarely a broken machine. It is a machine doing exactly what it was told, at a moment when nobody needs it. Think of an orchestra where every section plays from its own sheet music and nobody watches the conductor. Each part is competent, and the whole is out of step.
Four urban systems account for most of the opportunity:
| System | Why it wastes energy | What a learning system changes |
|---|---|---|
| Commercial buildings (heating, cooling, ventilation, lighting) | Fixed schedules run equipment in empty zones and at the wrong time of day | Forecast occupancy and weather, then pre-cool, pre-heat, or switch off by zone |
| Street lighting | Lamps sit at full output all night, including when streets are empty | Dim on predicted activity; LED conversion supplies most of the savings |
| Traffic signals | Fixed timing plans cannot react to real queues, so cars stop and idle | Adjust green times to measured traffic, coordinate neighboring intersections |
| Water networks | Pumps run on schedules, and leaks go unseen underground | Detect anomalies in flow and pressure, schedule pumping around energy prices |
How big is the building share?
Buildings used about 30 percent of global final energy consumption in 2021, based on figures that summarize the IEA's tracking report (Global ABC). The U.S. Environmental Protection Agency has long estimated that on average about 30 percent of the energy used in commercial buildings is wasted (EPA, 2010). That is an old estimate, and it describes an average across many buildings, but it explains why building controls get so much attention.
The reasoning behind it is straightforward. A building's heating and cooling plant is sized for the hottest and coldest day of the year, and the controls are set conservatively so nobody complains. A conservative schedule means long hours of running in the background. The gap between what the schedule delivers and what people need is where a forecasting system earns its keep.
What does machine learning actually do in a smart city?
A smart city system is a pipeline with four layers. Each one uses a different kind of model, and the weakest layer sets the ceiling for the whole thing.
Layer one: sensing
Everything starts with data. Typical sources include occupancy sensors and door counters, smart electricity meters, weather stations, inductive loops and cameras at intersections, and flow and pressure meters on water mains. Most of this is not new. What is new is that the readings are collected in one place, in a consistent format, at a useful frequency.
This layer is where many projects fail quietly. Older buildings often have analog thermostats and no digital interface to the equipment, so the first job is plumbing, not intelligence. The wider hardware picture is described in the Internet of Things explained.
Layer two: forecasting
The next step is to predict what will happen over the next few hours. Forecasting energy demand is a time-series problem, the same family of problem as predicting sales or river levels. Models such as long short-term memory networks (LSTMs, a type of neural network that keeps a running memory of recent inputs) learn daily and weekly rhythms and combine them with weather and calendar data. The basics of the approach are covered in how time series forecasting works.
A graph neural network takes a different view. It treats the city as a network of nodes, such as buildings, intersections, and substations, and learns how the state of one node affects its neighbors. If traffic is building at one intersection, the network can anticipate that the next one will be affected a few minutes later, the way a traffic reporter might warn that a jam is spreading.
Layer three: optimization
A forecast alone does not save energy. Something has to act on it. In simple systems that is a rule: if the building will be empty after 6 p.m., set back the temperature at 5:30. In more ambitious systems, a reinforcement learning agent chooses the actions. Reinforcement learning is a training method in which a program tries actions, receives a reward when the result is good, and gradually learns which choices work. It is the same idea behind game-playing systems, described in from AlphaGo to StarCraft.
For buildings, the reward might be low energy use subject to a comfort constraint. The constraint is what keeps the agent from "saving" energy by letting the offices freeze. One open-source research environment, CityLearn, was built so that researchers can compare such controllers on shared data. In the dissertation work behind it, a multi-agent algorithm beat both single-agent versions and a rule-based baseline by more than 15 percent on average across five metrics, including peak demand and load factor (CityLearn paper on arXiv; dissertation record). Note the setting: that was a simulation with pre-computed building data, not a live city.
Layer four: control and oversight
The final layer pushes the decision into the real world, through a building management system or a traffic signal controller, and checks the result. Many operators run this layer in "advisory mode," meaning the software recommends and a human approves. That is slower, and for good reason: an automated mistake in a traffic signal or a boiler room is costly.
A system that works well in month one can degrade by month twelve. Occupancy patterns shift after a company changes its office policy, and a model trained on the old pattern keeps acting on it. This failure mode, known as drift, is explained in what model drift means in production.
What have real deployments measured?
Here is where it pays to separate three kinds of evidence: independent measurement, results reported by the vendor or the project owner, and projections. The table lists what could be traced to a source, and what kind of source it is.
| Deployment | Reported result | Evidence type | Caveat |
|---|---|---|---|
| Los Angeles LED street lights (141,089 fixtures) | 63.1% less energy used; baseline 168 GWh per year | City announcement | LED conversion, not machine learning |
| Copenhagen networked LED street lights | 65% to 76% savings, depending on the case study | Vendor case studies (Silver Spring/Itron) | Reports differ on fixture counts and savings |
| Pittsburgh Surtrac adaptive signals | Over 25% improvement in travel time, speed, stops, and wait on 12 routes | Carnegie Mellon project, summarized by U.S. DOT | Pilot on a small network |
| Google Project Green Light | Up to 30% fewer stops and about 10% lower intersection emissions | Google's early, preliminary figures | About 70 intersections in 12 cities |
| DeepMind cooling at Google data centers | Up to 40% less cooling energy | Google announcement (2016) | A data center, not a city; about 15% of PUE overhead |
Street lighting: the proven win is the lamp, not the algorithm
Los Angeles replaced 141,089 street lights with LEDs, which cut the lighting energy by 63.1 percent from a baseline of 168 gigawatt-hours per year, according to the mayor's announcement (Clinton Foundation). Copenhagen's vendor case studies report 65 to 76 percent savings for its networked LED lights, with differing details about the number of fixtures (Itron case study).
Notice what these numbers are. They mostly measure the jump from older high-pressure sodium lamps to LEDs. Adding networked dimming, where lights fade when nobody is around, can save more, but the publicly traceable evidence for that increment is thinner. Any claim that "AI cut street lighting energy by X percent" should be checked for how much of X came from the bulb.
Traffic signals: the best-documented use of adaptive control
The Surtrac system, developed at Carnegie Mellon University, runs on a decentralized design: each intersection builds its own schedule from the cars it sees approaching, and neighbors share their plans. In a pilot on a nine-intersection network in East Liberty, Pittsburgh, the project reported major reductions in travel times and emissions. A U.S. Department of Transportation summary describes improvements of more than 25 percent in average travel time, speed, number of stops, and wait time across twelve routes (USDOT summary). Press coverage of the project attributed a 40 percent reduction in idling and a 21 percent emissions reduction to it, but those figures came from the researcher's statements rather than the paper's abstract (Fortune, 2015).
Google's Project Green Light takes a different route. It builds a model of each intersection from Google Maps driving data and sends timing recommendations to city engineers, who decide whether to apply them. Google's early figures suggest up to 30 percent fewer stops and about a 10 percent cut in emissions at intersections, across roughly 70 intersections in 12 cities, and these are preliminary and not independently verified (GeekWire). In Seattle, a corridor change of 10 seconds at two intersections smoothed traffic, and a city spokesperson described the tool as a supplement to traditional methods.
The honest summary is that adaptive signals work, that gains of tens of percent in stops and delay have been seen on well-chosen corridors, and that those numbers do not translate directly into citywide energy savings. Fewer stops matter most on congested arterials, and less on lightly used roads.
Buildings and data centers: where the control problem is cleanest
The cleanest example of machine learning cutting a facility's energy comes from data centers, not cities. In 2016, DeepMind and Google reported that a neural network trained on historical sensor data cut the energy used for cooling one Google data center by up to 40 percent, which translated to about a 15 percent reduction in the overhead measured by power usage effectiveness (PUE) (Google blog). A data center is an easy target: one owner, thousands of sensors, a clear objective, and a physical plant that responds quickly.
Offices and apartment blocks are harder because there are many owners, patchy data, and people who open windows. The IEA's 2017 digitalization analysis put the potential for smart building controls at about 10 percent of building energy use to 2040, though summaries differ on whether that figure refers to electricity or to total energy. The reading that fits best with the other evidence is a modest, widely spread saving, not a dramatic one.
How can a city train models without spying on residents?
Real-time occupancy data about individual apartments is sensitive. One answer that comes up often is federated learning: instead of sending raw data to a central server, each building trains a model locally and sends only the model's learned parameters, which a coordinator averages into a shared model. The idea was formalized by Google researchers in 2017, who showed that their averaging method reduced the number of communication rounds needed by 10 to 100 times compared with a standard distributed training baseline (McMahan et al., AISTATS 2017).
The privacy benefit is real but easy to overstate. Federated learning keeps raw records on site, yet the updates sent to the coordinator can still leak information. A 2019 study from MIT, "Deep Leakage from Gradients," showed that shared gradients can be used to reconstruct training inputs and labels, in the paper's tests with pixel-level accuracy for images and token-level matches for text (Zhu, Liu, and Han, NeurIPS 2019). Defenses exist, including pruning the gradients, adding calibrated noise (differential privacy), and encrypting the aggregation step. Each one costs some accuracy or computing power.
So the accurate statement is that federated learning reduces exposure, and that a privacy guarantee depends on the extra safeguards layered on top. It also does not decide who may collect the data in the first place, which is a governance question, not a technical one. The same on-site idea underlies edge AI on your phone, where the computation moves to the device instead of the data moving to the cloud.
Why do savings shrink when a pilot scales up?
A pilot is run by enthusiasts, on a convenient corridor or building, with attention from engineers. A citywide rollout is run by whoever is on shift. Several things erode the numbers.
- Baselines move. A pilot compared with last year's schedule looks good if the schedule was poor. Compared with a competently tuned building, the gain is smaller.
- Sensors drift and fail. A badly calibrated occupancy sensor feeds wrong inputs to a good model.
- Interfaces are missing. Many older buildings have no way for software to command the equipment, so the model has nothing to act on.
- Models go stale. Behavior changes, equipment is replaced, and a model that is not retrained slowly stops matching the building.
- Comfort complaints win. When occupants complain, operators override the system, and the savings go with it.
- Rebound effects. Cheaper, smoother traffic can attract more traffic. Lower energy cost per unit of service can raise the amount of service consumed.
None of this means the technology fails. It means that a figure quoted from a flagship project is a ceiling, not a forecast, and a procurement team should ask how savings were measured and against what.
What are the security and governance risks?
A system that can change heating setpoints, signal timings, and pump schedules is also a target. A compromised controller could disable equipment or cause congestion, so the usual cybersecurity practices apply: network separation, authentication, logging, and a human override that does not depend on the AI. The broader landscape of threats is covered in cybersecurity threats in 2026.
Governance is harder. Who is responsible when an automated timing plan is followed by an accident? Who owns the data produced by a building, the owner or the tenant? Toronto's Quayside project, run by Alphabet's Sidewalk Labs, is the cautionary example. The company announced on May 7, 2020, that it was ending the project, citing economic uncertainty, after years of criticism over data collection and ownership, including a proposal to place the data under an independent civic data trust (IPOsgoode). Observers disagree about how much privacy concerns, as opposed to money, drove the decision, but the project shows how fast public trust can become the limiting factor.
Fairness is a related concern. A model trained on historical traffic or usage patterns may under-serve neighborhoods where activity is low for reasons that have nothing to do with need. Optimization targets need explicit service minimums, and outcomes need auditing by neighborhood, not only in citywide averages.
Does smart optimization help with heat, water, and the grid?
The same logic applies to other urban systems, with different payoffs.
Heat. Pre-cooling buildings before a heat wave, and shifting load away from the evening peak, reduces strain on the grid. The built environment amplifies temperature extremes, as explained in why cities create heat islands, and cooling demand is where urban energy and climate risk meet.
Water. Leak detection is one of the better-defined problems, because a leak shows up as an anomaly in pressure and flow. A Xylem case study says Singapore reduced non-revenue water to about 5 percent of production using sensor networks, though that figure comes from a vendor case study, not from audited utility reports (Xylem). The broader topic is explored in AI and water conservation.
The grid. Coordinating heat pumps, electric vehicle charging, and batteries with renewable supply is a natural fit for forecasting. The physical limits of storage and charging are discussed in why grid storage is hard and electric vehicles and the grid, and the supply-side tools are covered in how AI optimizes renewable energy grids.
The AI footprint itself. Running these models costs energy too. For a city-scale forecasting job the cost is small compared with the savings, but the accounting should include it, a point that links to how AI data centers use electricity.
What do people get wrong about smart cities?
"AI will cut city energy use by a third." No independent source supports a single citywide number like that. What has been documented are large savings in particular systems, such as LED lighting and cooling plants, and moderate gains in others.
"The algorithm did it." Often the saving came from replacing old equipment, fixing a control schedule, or measuring for the first time. Machine learning contributes, but the retrofit or the data usually comes first.
"Smart means automatic." The most credible deployments keep people in the loop, with the software recommending and engineers approving.
"Privacy is solved by federated learning." It reduces the amount of raw data moved around but does not eliminate leakage, as the gradient-inversion research showed.
"More sensors always means better results." Past a point, extra data adds cost and attack surface without improving decisions. A smaller set of well-maintained sensors usually beats a larger set that nobody checks.
What this means
The strongest case for machine learning in cities is not a futuristic autonomous metropolis. It is the unglamorous gap between a fixed schedule and the real demand on a given Tuesday. Where that gap is wide and measurable, as with traffic on busy corridors or cooling in a single large facility, learned control has produced documented gains. Where it depends on millions of small decisions by owners, tenants, and drivers, the savings are smaller and slower to arrive.
For readers evaluating a claim, the useful questions are: what was the baseline, who measured the result, how large was the test, and what happens after the pilot team leaves? For related work on how AI helps the energy system and the climate, see AI-powered carbon capture and machine learning for climate prediction. For household-scale savings that need no software at all, see how to reduce your electricity bill.
FAQ
Q: How much energy can AI really save in a city?
A: There is no reliable single figure. Documented results are specific to one system: more than 25 percent improvements in travel time and stops in a Pittsburgh signal pilot, up to 40 percent less cooling energy at a Google data center, and 63 percent less energy from an LED street light program in Los Angeles that was not driven by machine learning. The IEA has put the potential of smart building controls at about 10 percent of building energy use to 2040.
Q: Does smart city optimization need 5G?
A: Not for most energy uses. Building and street light controls tolerate delays of seconds or minutes and work on existing wired, Wi-Fi, or cellular links. Faster links matter more for applications that need split-second responses, such as coordinating connected vehicles.
Q: What if the AI model is biased against certain neighborhoods?
A: It is a real risk. A model trained on historical usage can learn to give less service where activity was low in the past. Mitigations include explicit minimum service levels for every neighborhood, audits of outcomes by area, and community oversight of the objectives the system optimizes.
Q: Can smart traffic systems make cities less walkable?
A: Yes, if the objective counts only vehicle delay. A system that gives pedestrians long waits to keep cars moving can raise energy efficiency for traffic while harming walkability. Better designs include pedestrian wait times, cyclist safety, and transit reliability in the objective alongside vehicle flow.
Q: How much data do smart cities collect about individuals?
A: It depends on the design. Minimal systems use aggregated counts, such as the number of cars at an intersection or total occupancy of a floor. Invasive systems track individual movement through cameras or phone signals. Techniques such as federated learning and differential privacy limit exposure, but they do not replace rules about what may be collected.
Q: Can optimization target carbon, not only energy cost?
A: Yes. A controller can shift consumption to hours when the grid is cleaner, which may mean using slightly more energy at a time of abundant solar or wind. This needs reliable data on the carbon intensity of the grid by hour, which is available in some regions and not in others.
Q: Why not just replace old equipment instead of adding AI?
A: Often that is the better first step. LED lighting, better insulation, and heat pumps deliver large, well-documented savings. Learned control is most useful after the equipment is efficient, when the remaining waste is in how and when it is run.
Sources
- International Energy Agency (2016). Cities are in the frontline for cutting carbon emissions.
- U.S. EPA (2010). Announcement of the National Building Competition.
- Global Alliance for Buildings and Construction. IEA tracking report: buildings.
- Vazquez-Canteli, J.R., et al. (2020). CityLearn: Standardizing Research in Multi-Agent Reinforcement Learning for Demand Response and Urban Energy Management. arXiv:2012.10504.
- Smith, S.F., et al. (2013). Smart Urban Signal Networks: Initial Application of the SURTRAC Adaptive Traffic Signal Control System. ICAPS. Paper.
- U.S. DOT ITS Knowledge Resources. SURTRAC summary.
- Google and DeepMind (2016). DeepMind AI reduces energy used for cooling Google data centers by 40%.
- McMahan, H.B., et al. (2017). Communication-Efficient Learning of Deep Networks from Decentralized Data. AISTATS.
- Zhu, L., Liu, Z., and Han, S. (2019). Deep Leakage from Gradients. NeurIPS.
- IPOsgoode (2020). Sidewalk Labs withdraws from Quayside development project.
Follow new articles
Add SciHub101 to your feed reader to see new science and technology stories.
About the Author
SciHub101 is an independent science and technology publication founded and edited by Buğra Sözeri, a software engineer and app developer based in Türkiye. AI tools assist with drafting and research. Source documentation in the existing archive is uneven, and articles are being reviewed and corrected. The Editorial Team byline identifies editorial responsibility; it does not certify specialist or independent human review. Where we compare products, anything built by our own team is labelled as such — see the editorial guidelines and About page for how corrections and disclosures work.
Related Articles
AI-Powered Carbon Capture Technology: What Machine Learning Can Do
Machine learning is helping chemists screen millions of candidate sorbents for direct air capture. Here is what the evidence shows, what plants cost today, and where the claims run ahead of the data.
Neural Networks for Ocean Monitoring: How AI Tracks Marine Life
Neural networks now find vessels in satellite radar images and recognize whale calls in underwater audio. Here is what they do, how accurate they are, and where the claims run ahead of the evidence.
Machine Learning for Climate Prediction: What AI Can Forecast
AI weather models now produce 10-day global forecasts in under a minute. Climate projections are a harder problem, and the gap between the two is where the real science sits.
Smart Buildings & AI: How Machine Learning Cuts HVAC Energy Use
How machine learning forecasts occupancy, tunes HVAC setpoints, and flags failing equipment early, and why measured savings in offices are smaller and harder to prove than the headline numbers suggest.

AI & Water Conservation: How Machine Learning Cuts Waste
How machine learning optimizes irrigation, leak detection, and demand forecasting to save water in agriculture, cities, and industry.
How AI Optimizes Renewable Energy Grids: What It Really Does
Solar and wind output swings with the weather, but a grid must balance supply and demand every second. Here is what machine learning actually does for grid operators, which claims are documented, and where the limits are.