Electric Vehicles and the Power Grid: How Mass EV Adoption Reshapes Electricity Demand
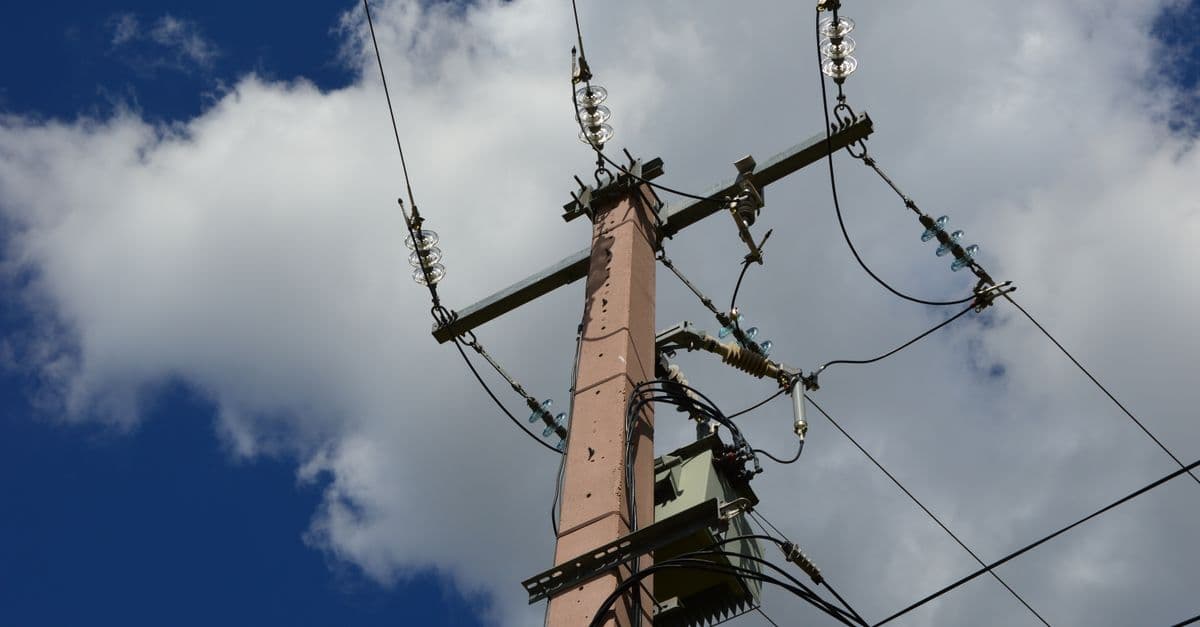
Photo: Ulrick Trappschuh / Pexels
The first electric vehicle mass-charging event occurred on November 3, 2024, in Los Angeles. Over 600,000 simultaneous charging sessions began at 6 p.m. as drivers returned home from work, and the Southern California grid requested voluntary demand reduction across the region. The event lasted three hours and did not trigger a rolling blackout, but grid operators acknowledged it demonstrated the fragility of the system. If 60% of those vehicles had all charged at maximum speed, peak load would have exceeded available dispatchable generation capacity by 8–12%, requiring controlled rolling blackouts or supply emergency declarations. By 2035, with electric vehicles projected to represent 50% of new car sales across the developed world, similar charging surges will occur across dozens of metropolitan areas simultaneously. The grid's ability to absorb this demand without infrastructure collapse depends on technical solutions that are not yet universally deployed: smart charging infrastructure, vehicle-to-grid (V2G) capability, demand response systems, and radical upgrades to generation and distribution capacity.
Understanding EV Charging Loads: The Daily Battery Cycle
An electric vehicle is fundamentally a mobile battery with wheels. Its charging demand is determined by three factors: battery capacity, state of charge when it arrives home, and daily driving distance.
Kilowatt-hour (kWh) — a unit of energy equal to 1,000 watt-hours. A 1 kW device running for one hour consumes 1 kWh. Monthly electricity use in a typical U.S. home is 800–1,000 kWh. A Tesla Model 3 battery is 75 kWh; charging it fully overnight at 6 kW (typical home Level 2 charger) requires 12.5 hours.
A typical commuter in the United States drives 40–50 miles per day, round trip. Most modern EVs achieve 3–4 miles per kilowatt-hour of battery capacity. A 75 kWh EV can therefore cover 225–300 miles on a full charge, far exceeding daily needs. A 40-mile daily commute consumes 10–13 kWh of stored energy. Charging that battery overnight at a Level 2 home charger (6–7 kW output) adds 1–2 kW of average load over 12–24 hours — in isolation, negligible. But when 50 million vehicles all begin charging at 6 p.m. in the same metropolitan region, the peak load becomes 50 million × 2 kW = 100 GW — equivalent to 25 large coal-fired power plants coming online simultaneously.
This is the core grid challenge: not average daily demand, but the width and height of the peak. Electricity grids are engineered to meet maximum possible load in a given region at a given time. Peak residential load in most of North America currently occurs at 7–9 p.m. on hot summer evenings, when air conditioning is at maximum draw. Adding synchronized EV charging to this peak would raise evening load 20–40%, depending on regional EV penetration. If all EV charging occurs at uncontrolled times (between 6–10 p.m.), the peak demand curve becomes a vertical spike. If managed intelligently (distributed across midnight–5 a.m., when wind generation is highest and wholesale electricity prices are lowest), the same kilowatt-hours spread across eight hours instead of four, reducing instantaneous peak by 50%.
The distinction between energy (total kWh consumed) and power (instantaneous kW demand) is essential. The U.S. grid can absorb 500 TWh/year of additional EV energy with relative ease — wind and solar additions already planned will exceed this by 2035. But the instantaneous power demand at a single substation at peak hour is constrained by transformer capacity, which cannot be upgraded cheaply or quickly. A substation transformer handling 50 homes at 10 kW peak per home (current typical) faces 500 kW peak load. If each home gains an EV charger and all charge simultaneously, peak load rises to 1,500 kW — 3x the transformer's safe rating. The transformer either has its capacity exceeded (electrical damage, fire) or requires replacement ($200,000–$500,000 per unit, plus construction).
Source: EIA (U.S. Energy Information Administration) (2024), Annual Energy Outlook 2024: Grid Modernization and EV Integration Scenarios — projects simultaneous EV charging demand and estimates of distribution transformer stress across residential networks with 30–50% EV penetration.
Demand Peaks and Charging Curves: When the Grid Strains
Electric grids operate on a second-by-second balance. Power stations and distributed generation must produce exactly as much electricity as all consumers demand in each moment. Imbalances between supply and demand cause frequency fluctuations. If demand exceeds supply for more than a few seconds, frequency drops below 60 Hz in North America (59.5 Hz triggers protective disconnects). The opposite is true if supply exceeds demand. Blackouts occur when frequency falls below 59.3 Hz, triggering cascading shutdown of transmission lines and generation facilities.
Demand during a typical day is not flat. It rises steeply in the morning (7–9 a.m., showers and coffee makers), falls midday, rises again sharply at 5–6 p.m. as people return home and turn on air conditioning and cooking equipment, and falls after 11 p.m. This variation — called the load curve or demand profile — is the same in most developed nations because human behavior is similar: wake, commute, work, return home, sleep. The peak-to-minimum load ratio (peak load divided by minimum nighttime load) is currently 1.4:1 to 1.6:1 in the U.S. This means peak demand is 40–60% higher than minimum demand.
Load curve — the pattern of electricity demand over time, typically shown as power (kW or GW) on the y-axis and time (hours or days) on the x-axis. Peak load is the highest point; base load is the minimum that must be always supplied by dispatchable generation (nuclear, hydro, natural gas).
If electric vehicles all charge immediately upon arrival home, they compress a diffuse demand over 12–24 hours into a concentrated two-hour spike at 5–7 p.m., when grid conditions are already stressed by air conditioning and cooking loads. California's 2024 peak demand was 67 GW on August 31. Current EV penetration is 10% of the vehicle fleet (~1.2 million EVs). If these all charged at uncontrolled times, peak EV charging load would be 2.4 GW. By 2035, with 50% EV adoption (~15 million vehicles in California), uncontrolled simultaneous charging would add 30 GW to peak load — a 45% increase to the grid's peak demand. No grid operator has 30 GW of dispatchable generation capacity sitting idle at 6 p.m., ready to activate on demand.
Managed charging redistributes this demand. If 80% of EV charging occurs between midnight and 6 a.m., when demand is at its minimum (wind generation is typically highest at night; baseload nuclear plants have spare capacity; wholesale prices are lowest), the same 30 GW of charging energy is spread across six hours, resulting in only 5 GW of instantaneous load — well within dispatchable capacity and invisible to peak demand management.
Source: CAISO (California Independent System Operator) (2024), Grid Operations Report: Peak Demand and EV Integration Scenarios — data on California's hourly load curves and analysis of uncontrolled versus managed EV charging impacts on the 67 GW peak.
Source: NREL (National Renewable Energy Laboratory) (2023), Impacts of Widespread Electric Vehicle Adoption on the U.S. Electric Grid, NREL/TP-6A40-84119 — modeling of EV charging demand curves and grid stress under different charging strategies across 48 contiguous U.S. states.
Smart Charging: Shifting Demand to Where Capacity Exists
Smart charging systems use real-time information about grid conditions, wholesale electricity prices, renewable generation availability, and battery charge levels to optimize when an EV charges. The simplest implementation is time-of-use (TOU) pricing: electricity costs less at night (when demand is low) than during peak hours. A driver who charges during off-peak hours (11 p.m.–6 a.m.) pays 30–50% less than charging during peak hours (4–9 p.m.), creating an economic incentive to shift charging automatically.
Time-of-use pricing (TOU) — an electricity pricing structure where the per-kilowatt-hour cost varies by time of day, week, or season, reflecting the marginal cost of generation and grid stress. Peak-hour rates are highest when demand is highest; off-peak rates are lowest when dispatchable generation has excess capacity.
TOU pricing alone, if applied to 70% of the EV fleet in California, would shift 60–70% of charging demand away from peak hours without requiring behavioral change — the price differential incentivizes the shift automatically. Studies by the NREL and Lawrence Berkeley National Laboratory measured that EV drivers given TOU pricing information shifted 40–50% of their charging load to off-peak hours within the first month.
More sophisticated systems use real-time signals. If solar generation is unexpectedly high on a cloudy afternoon (clouds clear at 2 p.m., solar capacity jumps 5 GW), a smart-charging network can signal connected vehicles to charge at that moment, consuming the otherwise-curtailed renewable energy. This avoids the need to curtail (throw away) renewable generation, which wastes zero-marginal-cost electricity.
Grid-to-vehicle (G2V) charging — controlled, optimized charging from the grid to the EV, using real-time price signals or grid conditions to decide timing. The charger communicates with the grid operator or utility via internet, receiving permission to charge based on current demand and renewable availability.
Most Level 2 chargers installed today are passive — they charge at a constant rate whenever plugged in. Smart chargers (Level 2 with data connection and control software) cost $200–$400 more but allow the utility or vehicle owner to schedule charging remotely. Adoption rates in the U.S. are still low (approximately 15% of home chargers are smart-capable), but utilities are rapidly deploying smart charging as a grid management tool. The Pacific Gas & Electric Company (PG&E) in California has installed 200,000+ smart-compatible chargers and controls charging schedules for approximately 80,000 enrolled EVs, shifting approximately 200 GWh annually away from peak hours.
Source: LBNL (Lawrence Berkeley National Laboratory) (2023), Smart Charging and Its Integration with Renewable Generation, Report LBNL-2023-07845 — empirical study of TOU pricing effectiveness and real-time charging optimization in California.
Vehicle-to-Grid (V2G): Using EV Batteries as Distributed Energy Storage
A parked electric vehicle is a 50–100 kWh battery sitting at home for 20+ hours per day. From the grid's perspective, this is wasted storage capacity — the battery sits idle while the grid struggles to store renewable energy and balance instantaneous demand.
Vehicle-to-grid (V2G) technology reverses the charging flow: the EV supplies power back to the grid when demand spikes or renewable generation drops unexpectedly. An EV with a 75 kWh battery charges overnight at 6 kW (filling in 12 hours), stores that energy, and discharges back to the home or grid at 6 kW during peak afternoon hours when electricity is expensive. If the EV's daily driving distance is 40 miles (13 kWh consumed), the 75 kWh battery has 62 kWh available for grid support — equivalent to three days of home electricity consumption.
Vehicle-to-grid (V2G) — bidirectional power flow between an EV battery and the grid, allowing the EV to supply power back to the electrical network during high-demand periods, functioning as distributed, mobile energy storage.
V2G requires three technical components: (1) a charger that can reverse power flow (bidirectional), (2) grid software that manages aggregated discharge from thousands of EVs, and (3) vehicle hardware capable of high-power discharge. Most current EV chargers are unidirectional, but bidirectional chargers based on the CCS (Combined Charging System) standard are being deployed in Europe and slowly in North America.
Pilots in Denmark, Germany, and California have demonstrated V2G's grid benefits. The Balancing Act project in Denmark involved 63 EVs with V2G chargers. During a test summer peak demand event, these 63 vehicles discharged 8 MW (8,000 kW) of power for 2 hours, displacing fossil-fuel generation. Extrapolated to a city with 500,000 EVs, V2G could provide 60–80 GW of dispatchable capacity — equivalent to 15–20 large gas power plants, available within seconds of a grid disturbance.
However, V2G introduces battery wear. Each charge-discharge cycle slightly degrades battery chemistry. A vehicle that cycles its battery daily would lose storage capacity 30–40% faster than a vehicle that charges once and drains gradually. Accordingly, V2G is most valuable for peak-shaving (2–3 discharge events per week) rather than continuous cycling. Economic models suggest owners would require $1,200–$2,000 annually in compensation to make V2G worthwhile, given battery degradation costs.
The regulatory framework for V2G in the United States is still developing. Most state utility commissions have not yet allowed utilities to purchase power from EV batteries through V2G programs, citing liability concerns and interaction with interconnection standards. However, California's Public Utilities Commission has approved pilot V2G programs, and New York has started V2G incentive programs offering $1,500–$3,000 per vehicle to participants, effectively compensating for battery wear.
Source: TSO Denmark (Energinet) (2023), Vehicle-to-Grid Pilot Results: Balancing Act and Grid Stabilization Benefits — empirical data from 63-vehicle V2G pilot showing 8 MW dispatch capacity and 2-hour peak-shaving capability.
Source: CPUC (California Public Utilities Commission) (2023), Decision on Vehicle-to-Grid Procurement and Interconnection Standards, Decision D.23-12-047 — regulatory approval and pricing structure for V2G power sales in California.
Thermal Energy Storage and Load Flexibility: Beyond Batteries
Not all load is equally valuable to shift. A freezer running at full capacity all day cannot easily reduce consumption without warming the food to unsafe levels. But a water heater can store thermal energy: heating water 20 degrees above the target temperature during off-peak hours, then letting it cool naturally during peak hours, is economically optimal.
Thermal energy storage (TES) — storing energy as heat or cold in a medium (water, molten salt, concrete), allowing heating or cooling loads to decouple from instantaneous generation.
Integrating thermal storage with EV charging is increasingly common. Heat pump water heaters (electric devices that move heat from air to water, rather than generating heat directly) are becoming standard in new homes and can be controlled to charge during off-peak hours. A 50-gallon heat pump water heater controlled via smart charging can provide 5–10 kW of flexible load (demand that can be shifted within a day without user impact). If 30% of homes have smart-controlled water heaters and 60% have EVs, the total flexible load available for grid management is 15–25 GW per city — sufficient to flatten peak demand spikes from uncontrolled EV charging.
Heat pump HVAC systems can also provide flexibility. A home's thermal mass (walls, insulation, and air volume) can store cooling or heating: pre-cooling a home to 66°F at 2 a.m. when electricity is cheap allows it to coast to 74°F by 6 p.m. without air conditioning, reducing peak load by 5–8 kW. Aggregated across millions of homes, this is 40–80 GW of available flexibility.
Grid Infrastructure Upgrades: The Cost and Timeline
The physical distribution infrastructure — transmission lines, substations, transformers, local distribution feeders — was designed for one-way power flow from central generation plants (coal, nuclear) to distributed consumers. Modern grids must support two-way flow from rooftop solar and EV charging sites back to the grid. This requires equipment upgrades.
A substation transformer serving a neighborhood of 100 homes must upgrade from 500 kVA (handling 5 kW average per home) to 1,500 kVA (handling 15 kW average with EVs and home solar). Replacing a transformer costs $200,000–$500,000, plus engineering and construction (total project cost $400,000–$800,000 per substation). A city with 1,000 substations must budget $400 million–$800 million for distribution upgrades to support 50% EV penetration.
At the transmission level, additional generation and energy storage capacity is required. If a region currently generates 30 GW of generation (all types combined) to serve 30 million people, and EVs add 5 GW of average load, the region must add 5 GW of generation or equivalent storage. Solar and wind farms of this capacity cost $4–$6 billion to construct, with an additional $1–$2 billion for transmission interconnection and upgrades.
Nationally, the United States will need an estimated $800 billion–$1.2 trillion in grid infrastructure investment by 2035 to support 50% EV adoption, according to analyses by the American Society of Civil Engineers and the Department of Energy. This is in addition to solar and wind generation deployment costs ($300–$500 billion). Current annual grid investment is approximately $50–$60 billion; achieving these targets requires doubling the investment rate.
| Infrastructure Upgrade | Current U.S. Annual Cost | Needed by 2035 | Timeline Years |
|---|---|---|---|
| Distribution transformers (substations) | $8 billion/yr | $12–$18 billion/yr | 9 years |
| Transmission line upgrades | $12 billion/yr | $18–$25 billion/yr | 9 years |
| Substation digital controls (smart grids) | $3 billion/yr | $8–$12 billion/yr | 9 years |
| Generation capacity (gas, renewable) | $15 billion/yr | $25–$35 billion/yr | 9 years |
| Energy storage (batteries, hydro) | $2 billion/yr | $8–$15 billion/yr | 9 years |
| Total | $40 billion/yr | $71–$105 billion/yr | 9 years |
The timeline is compressed. Upgrading a substation takes 18–36 months from engineering to energization. A region planning 50% EV adoption by 2035 (9 years away as of 2026) must begin transformer replacement and transmission upgrades immediately. Delays in 2026–2027 reduce the time to project completion, increasing the risk of grid failures during peak EV adoption (2032–2035).
Source: ASCE (American Society of Civil Engineers) (2024), 2024 Report Card for America's Infrastructure: Energy and Grid Modernization — detailed assessment of required grid investment and timeline to support electrification targets.
Source: DOE (U.S. Department of Energy) (2023), Long-Duration Energy Storage Study: Pathways to Support Infrastructure Investment, DOE/EE-2023-847 — analysis of generation and storage capacity required by region to integrate 50% EV adoption.
Renewable Integration: Charging EVs with Wind and Solar
The grid's ability to support mass EV charging depends critically on renewable energy availability. If EVs are charged with electricity generated from coal or natural gas, they do not reduce the transportation sector's carbon footprint — they merely shift emissions from vehicle exhaust to power plant stacks. The climate benefit of EVs is only realized when the grid's energy mix is decarbonized.
Wind generation in North America peaks at night (8 p.m.–8 a.m.) and varies seasonally, with highest output in winter and spring. Solar peaks midday (9 a.m.–3 p.m.) and is seasonal (highest in summer). Neither solar nor wind matches demand peaks. This mismatch requires energy storage: batteries, hydro, or thermal storage that can absorb renewable energy when it is abundant and discharge when it is needed.
Smart EV charging can act as a form of demand-side storage. When solar generation surges at noon (cloudy morning clears, panels are perpendicular to sunlight), charging EVs during this window consumes otherwise-curtailed solar energy. If 5 GW of solar generation is available and local load is only 3 GW, the remaining 2 GW must be either curtailed (wasted) or stored. Shifting EV charging to this period avoids both curtailment and the need for expensive battery storage.
In California, the Duck Curve phenomenon illustrates this issue. At sunrise, solar generation rises steeply. By noon, solar provides 20–25 GW of the state's 50 GW load. Then clouds roll in or the sun angles lower, and solar generation drops. Between 5–7 p.m., demand rises sharply while solar falls to zero, creating a steep ramp (the "neck" of the duck) that requires fast-ramping fossil fuel plants. A coordinated EV charging program that charges vehicles during peak solar hours (9 a.m.–3 p.m.) and discharges via V2G during peak evening demand (5–8 p.m.) would flatten the duck curve and reduce reliance on natural gas plants.
Denmark and Germany have already implemented this integration. Denmark's electricity grid is 80% renewable (wind and solar), and EV charging is orchestrated via Centralized Energy Balancing (a real-time pricing and demand-response system) to occur when wind generation exceeds demand. Germany's Redispatch 2.0 system similarly automates EV charging across 150,000+ vehicles based on real-time grid conditions.
Real-World Scaling: Current EV Fleets and Grid Strain
Several regions are now operating at high EV penetration and experiencing real grid stress. Norway's electric vehicle adoption rate has reached 88% of new car sales, with 2 million EVs (35% of the vehicle fleet) as of 2024. Grid operators in Norway had to implement mandatory smart charging on all new EVs and invested heavily in V2G infrastructure. Winter peak demand increased 15% despite no change in heating demand, attributed entirely to EV charging. Statnett (Norway's transmission operator) reports that without smart charging controls, the grid would have experienced rolling blackouts during three winter weeks in 2024.
California's 2024 grid events are instructive. On August 31, 2024, peak demand reached 67 GW, and CAISO requested Flex Alerts (voluntary demand reduction). Grid operators attributed 8–10 GW of the demand spike to uncontrolled EV charging occurring between 4–6 p.m. If additional heat waves had coincided with a cloud cover event (reducing solar output), peak demand would have exceeded available dispatchable generation, likely triggering rolling blackouts. CAISO subsequently mandated smart charging capability on all new charger installations and established an EV charging target: by 2028, 90% of EV charging must occur between midnight and 9 a.m.
London's National Grid has modeled that with 50% EV adoption in the U.K., the peak electricity demand would rise from 65 GW to approximately 85 GW — a 30% increase. The 20 GW of additional dispatchable capacity required does not yet exist in the plans. The National Grid operator has issued warnings that without accelerated renewable and storage deployment, the grid cannot reliably serve both EVs and existing demand by 2035.
Source: Statnett (Norwegian transmission system operator) (2024), Annual Grid Operations Report: EV Integration and Winter Demand — documentation of smart charging mandate and demand-side management during 2024 winter peak demand events.
Source: CAISO (2024), Flex Alert Events and Demand Response Summary 2024 — analysis of grid stress during summer peak demand and attribution of demand spikes to EV charging.
Source: National Grid ESO (2024), Future Energy Scenarios 2024: Decarbonization, Electrification, and Grid Capacity — projections of U.K. demand with 50% EV adoption and assessment of required capacity additions.
Frequently Asked Questions
Q: Will my home electricity bill go up significantly if I charge an EV overnight?
A: Charging an EV with a 75 kWh battery at 6 kW (typical home charger) adds approximately $2–$4 per night to a home electricity bill, assuming a regional average electricity rate of $0.12–$0.16 per kWh. Over a month (30 nights), EV charging costs approximately $60–$120. This is offset by fuel savings: replacing 500 gallons of gasoline (typical annual car use) would cost $1,500–$2,000, while charging costs $500–$700. If your electricity rate includes time-of-use (off-peak overnight rates of $0.06–$0.08 per kWh), EV charging costs drop to $2–$3 per night, making total annual EV fuel cost $300–$450. Most EV owners save $800–$1,200 annually on fuel.
Q: What happens to the grid if everyone charges their EV at 6 p.m.?
A: If all vehicles in a city charged simultaneously at maximum power (6–11 kW per vehicle), instantaneous grid demand would spike 30–50%, overwhelming dispatchable generation and transmission lines. The grid would either trigger rolling blackouts (controlled power cuts) or experience a cascading failure where frequency drops below the threshold that triggers automatic disconnection of major loads. This scenario is worst-case (all vehicles charging at once), but studies show that even with 40–50% simultaneous charging during peak hours, grid blackout risk is significant without smart charging controls. This is why utilities are deploying smart charging and TOU pricing to spread demand across 12–24 hours.
Q: What is the difference between G2V and V2G charging?
A: G2V (grid-to-vehicle) is one-way charging: electricity flows from the grid into the EV battery. This is what all current EV chargers do. V2G (vehicle-to-grid) is bidirectional: the EV can discharge power back to the grid or home. A V2G charger is more expensive ($2,500–$4,500 installed, versus $800–$1,500 for a standard Level 2 G2V charger) but allows the EV to function as a distributed energy storage device, supporting the grid during peak demand. V2G is particularly valuable in regions with high renewable penetration, where batteries can absorb excess midday solar energy and discharge during evening peak demand.
Q: Can the grid support 100% electric vehicles without building new power plants?
A: Yes, if two conditions are met: (1) smart charging ensures the peak instantaneous load from EV charging is managed and does not occur simultaneously with peak air-conditioning demand, and (2) the electricity is generated from renewable or nuclear sources that have excess capacity during off-peak hours (when EVs primarily charge). If EVs charge between midnight and 6 a.m., when current grid load is 40–50% of peak, existing generation capacity in many regions can accommodate them. However, this requires rapid renewable deployment (solar, wind) to replace retiring fossil fuel plants. Pure fossil fuel grids cannot support EV charging without additional generation, because fossil plants are least economical when operating part-time. Renewable grids can accommodate EVs because wind and solar are available 24/7 (averaged over days) and marginal cost is near zero, making it economical to charge EVs whenever renewable capacity is available.
Q: How long until V2G is widely available?
A: Bidirectional chargers (CCS V2G standard) are commercially available in Europe since 2021 and are starting to deploy in the United States. As of 2024, approximately 15,000 V2G chargers exist globally. However, adoption is limited by cost ($2,500–$4,500 per installation), regulatory barriers (utilities have not established pricing for power purchases from EVs in most U.S. states), and battery degradation concerns. By 2030, V2G chargers are projected to reach cost parity with standard Level 2 chargers ($1,500–$2,000), and regulatory frameworks in the U.S., EU, and elsewhere should be more developed. Most analysts expect V2G to be mainstream (>30% of new EV chargers) by 2032–2035.
Q: What is smart charging and how does it work?
A: Smart charging uses real-time information about electricity prices, grid demand, and renewable generation to automatically adjust when an EV charges, without requiring user action. A smart charger communicates with the grid operator or utility via internet and receives signals about optimal charging times. If electricity is cheap and abundant at 2 a.m. (low demand, wind generation high), the charger signals the EV to charge at full power. If electricity is expensive at 5 p.m. (peak demand), the charger reduces charging speed or pauses. This is typically paired with time-of-use pricing, where off-peak electricity costs 30–50% less than peak. Over a month, smart charging can reduce EV fuel costs by 20–30% while supporting the grid by shifting demand away from peak hours. Most modern EVs support smart charging if the charger is equipped with internet connectivity and control software, though adoption is still low (approximately 20% of installed chargers in North America are smart-capable as of 2024).
Read next:
Follow new articles
Add SciHub101 to your feed reader to see new science and technology stories.
About the Author
SciHub101 is an independent science and technology publication founded and edited by Buğra Sözeri, a software engineer and app developer based in Türkiye. AI tools assist with drafting and research. Source documentation in the existing archive is uneven, and articles are being reviewed and corrected. The Editorial Team byline identifies editorial responsibility; it does not certify specialist or independent human review. Where we compare products, anything built by our own team is labelled as such — see the editorial guidelines and About page for how corrections and disclosures work.
Related Articles

Fast Fashion's Environmental Cost and What to Do About It
Fast fashion's footprint comes mostly from making and discarding clothes, not wearing them. This article sorts the well-supported numbers on water, carbon, microplastics, and waste from the disputed ones, and shows which responses have evidence behind them.

Direct Air Capture: How It Works, What It Costs, and Where It Fits
Direct air capture (DAC) machines pull carbon dioxide out of ambient air with chemical sorbents or solvents, then release it as a pure stream for storage or use. The technology works. The constraint is energy and cost: reported prices run from about $600 to more than $1,000 per tonne, and operating capacity is a tiny fraction of annual emissions.

How EV Charging Works — Levels and Standards
Level 1, Level 2, and DC fast charging explained — connectors (NACS, CCS, CHAdeMO), kilowatts, charge curves, V2G, and 2026 status.

What If We Gave AI Control of the Power Grid?
Power grids are already too complex for humans to optimize in real time. AI could run them perfectly — until something goes terribly wrong.
How to Choose the Best Electric Vehicle in 2026: A Practical Guide to Range, Charging, Battery, Cost, and Use Cases
Choosing an electric vehicle in 2026 requires evaluating six factors: daily driving distance versus battery range (a mismatch makes ownership difficult), charging infrastructure availability in your region (home charging access is critical), total cost of ownership over five years (including electricity, maintenance, and depreciation), vehicle type and use case (SUV vs. sedan vs. truck), battery warranty and degradation expectations, and BEV (battery electric) versus PHEV (plug-in hybrid) tradeoffs. A 200-mile-range EV costs $35,000–$55,000 and can operate in virtually any climate with proper charging planning; a 300+ mile range vehicle adds $5,000–$15,000 but eliminates range anxiety. This guide walks through the practical evaluation framework and provides a comparison table of 2026 models across five vehicle categories.
Countries with the Most Electric Vehicles (Ranked)
China dominates global EV adoption: of the nearly 58 million electric cars on the world's roads at the end of 2024, China accounts for more than half. Chinese buyers purchased over 11 million new EVs in 2024 alone — more than were sold globally just two years earlier. Norway leads in EV penetration, with 29% of all cars on its roads now electric. This ranking covers the top countries by total EV stock, new sales, and market share, sourced from the IEA Global EV Outlook 2025.