Countries with the Most Electric Vehicles (Ranked)
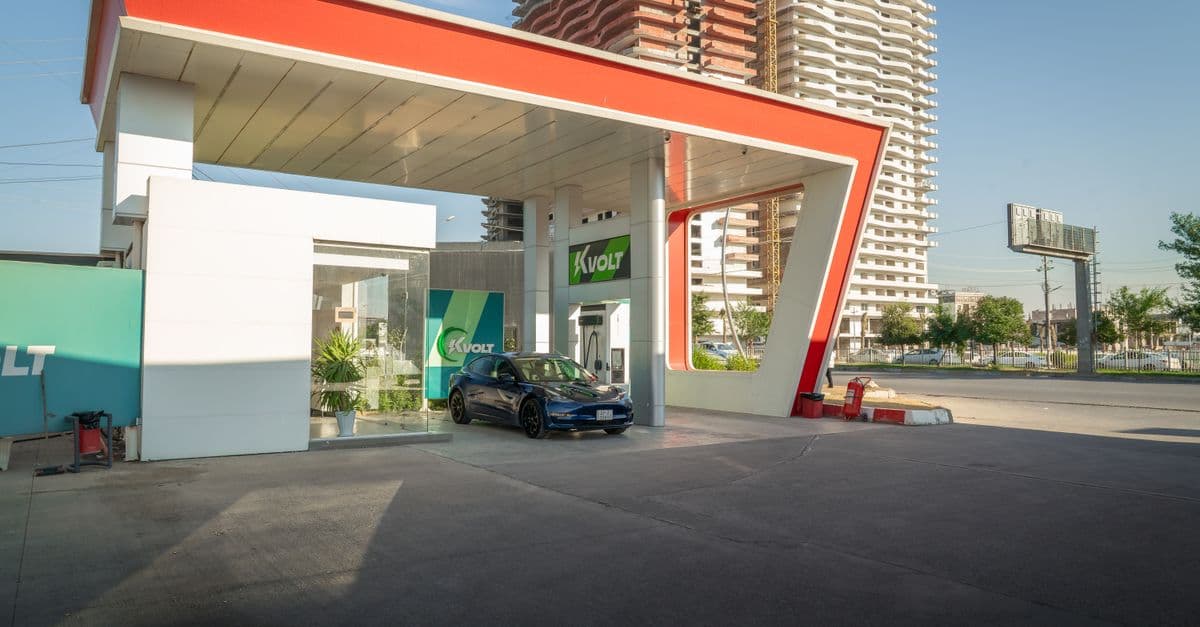
Photo: 04iraq / Pexels
The world's electric car fleet reached almost 58 million vehicles at the end of 2024 — approximately 4 percent of all passenger cars on the road globally — up from roughly 16 million just four years earlier. The shift from novelty to mass market is complete in several countries; it is well underway in many more. But the geography of this transition is deeply uneven.
China alone is responsible for more than half of all electric vehicles in service and accounted for approximately 65 percent of all new EV sales in 2024. The country that invented the internal combustion age's market logic has not merely adopted electric vehicles — it has restructured its entire auto manufacturing sector around them, producing EVs at prices that have rattled legacy manufacturers in Europe, Japan, and South Korea. Norway, meanwhile, has demonstrated that a wealthy country with the right policies can reach near-total electrification of new vehicle sales: 88 percent of cars sold in Norway in 2024 were battery electric, the highest share of any nation on Earth.
Understanding EV rankings requires distinguishing between total stock (how many electric cars are on the road), annual sales (how many were sold in a given year), and sales share or penetration rate (what percentage of all car sales were electric). These three metrics tell very different stories: China leads by stock and sales; Norway and several other Nordic and European countries lead by penetration rate; the United States has large absolute sales but a modest market share relative to its total auto market.
For the per-resident view of that penetration rate — how many EVs a country has relative to its population, rather than absolute fleet size — see Countries with the Most Electric Vehicles Per Capita.
Methodology
Q: Which source tracks global electric vehicle adoption and how is it measured? A: The International Energy Agency (IEA) publishes the Global EV Outlook annually — the authoritative global assessment of electric vehicle markets, policies, and trajectories. The 2025 edition, published in May 2025 and covering data through end of 2024, is the primary source for this article. The IEA defines electric cars to include battery electric vehicles (BEVs, which run entirely on electric power) and plug-in hybrid electric vehicles (PHEVs, which have both an electric motor and a combustion engine). Where figures are separated, BEV and PHEV are distinguished in the notes. Stock figures count all EVs registered in a country that are still in active service; sales figures count new registrations in a single calendar year. EV stock share is the percentage of all passenger cars registered in a country that are electric.
Source: IEA Global EV Outlook 2025 — https://www.iea.org/reports/global-ev-outlook-2025
Industrial policy, not just technology, drives EV adoption
The global EV rankings reveal a pattern that surprises many observers: the countries leading EV adoption are not necessarily those with the most advanced automotive technology or the most EV-friendly geography. Norway succeeds despite a cold climate and sparse rural population. Germany lags despite hosting BMW, Mercedes, and Volkswagen. The determining factor is sustained, coherent government policy aligned with long-term industrial strategy. China's government declared EV development a national priority in the mid-2000s and maintained subsidies, purchase incentives, and fleet mandates across multiple administrations for 20 years — creating not just consumer demand but an entire manufacturing ecosystem (BYD, CATL, NIO) that now dominates globally. Norway's near-total electrification of new sales is not a market outcome but the result of two decades of consistent purchase subsidies, VAT elimination, congestion pricing, and parking preferences. Germany's abrupt subsidy removal in December 2023 caused EV sales to plummet immediately, demonstrating that market share depends on policy continuity, not consumer demand. Japan's EV penetration lag reflects Toyota's strategic bet on hybrids over 15 years, which then shaped government policy and domestic market expectations. The lesson is stark: technology availability is necessary but not sufficient. Without government policy sustained across political cycles, EV adoption stalls or retreats, regardless of wealth or automotive capability.
Top countries by electric vehicle stock and market share (end of 2024)
| Rank | Country | EV stock share (% of fleet) | New EV sales 2024 | 2024 EV sales share | Notes |
|---|---|---|---|---|---|
| 1 | China | ~10% | >11 million | ~45% | By far largest in absolute terms; >50% of global EV stock |
| 2 | Norway | ~29% | ~220,000 | 88% BEV | Highest penetration in the world; PHEV nearly eliminated |
| 3 | Sweden | ~11% | ~130,000 | ~59% | Among highest penetration in Europe |
| 4 | Netherlands | ~8.3% | ~340,000 | ~30% | Largest public charging network in Europe per capita |
| 5 | Germany | ~5.4% | ~380,000 | ~18% BEV (+6% PHEV) | Slowing due to subsidy removal in 2023 |
| 6 | United Kingdom | ~5.0% | ~370,000 | ~25% | 2035 ICE ban on track; strong growth |
| 7 | France | ~4.1% | ~300,000 | ~25% | Strong industrial EV policy; Renault and Stellantis pivoting |
| 8 | United States | ~2.1% | ~1.3 million | ~8–9% | Large absolute sales; market share lags China and Europe |
| 9 | South Korea | ~2.4% | ~170,000 | ~9% | Hyundai and Kia EV exports strong |
| 10 | Canada | ~2.3% | ~170,000 | ~12% | Growth concentrated in Ontario and British Columbia |
| 11 | India | <1% | ~100,000 | ~2% | Tata Motors dominant; fast-growing two/three-wheeler EV segment |
| 12 | Japan | ~1% | ~220,000 | ~4% | Toyota hybrid focus has slowed BEV adoption |
| 13 | Australia | ~1.5% | ~87,000 | ~8% | Rapid growth from low base; EV incentives introduced |
| 14 | New Zealand | ~2% | ~18,000 | ~13% | Feebate scheme drives adoption |
| 15 | Denmark | ~4.5% | ~55,000 | ~47% | Among highest EV share in new sales in Europe |
Source: IEA Global EV Outlook 2025, Trends in Electric Car Markets — https://www.iea.org/reports/global-ev-outlook-2025/trends-in-electric-car-markets-2
Cross-reference: IEA Global EV Data Explorer — https://www.iea.org/data-and-statistics/data-tools/global-ev-data-explorer
Historical context: from concept cars to mass market
Electric vehicles are not a new invention. The first practical electric cars appeared in the 1880s and 1890s — before the internal combustion engine had established its dominance — and electric taxis were common in several American cities around 1900. The advantages of gasoline — its energy density, the rapidly expanding infrastructure of fuel stations, and eventually its lower cost — displaced electric vehicles from the market by roughly 1920.
The modern EV era began not with a mass-market product but with a regulatory one: California's Zero Emission Vehicle mandate, first adopted in 1990, forced automakers to develop and sell electric cars in their largest and most profitable US market. The resulting vehicles — most notably the General Motors EV1, leased from 1996 to 1999 and then recalled and destroyed — demonstrated both that electric cars could be attractive and that incumbent automakers had limited enthusiasm for disrupting their own profitable combustion businesses.
Tesla's founding in 2003 and the launch of its Roadster in 2008 reframed the EV as a premium performance product rather than a compliance sacrifice. The Model S (2012) proved that a mass-production luxury EV could outsell comparable BMW and Mercedes models on performance and software, not just environmental credentials. The Model 3 (2017) brought Tesla into the mainstream sedan market at a price point that expanded the customer base substantially.
Meanwhile, China's government made the strategic decision in the mid-2000s to use EV policy as an industrial policy tool — building a domestic EV manufacturing industry through subsidies, purchase incentives, license plate preferences, and government fleet mandates. This decision, sustained across multiple five-year plans, created the Chinese EV industry that now dominates global production.
Source: IEA Global EV Outlook 2025 — https://www.iea.org/reports/global-ev-outlook-2025
China: more than half the world's EVs
China's dominance of global EV adoption is so large that understanding it is essential to understanding the global transition. Chinese consumers purchased over 11 million electric cars in 2024 — more than were sold in the entire global market just two years earlier. The electric share of new car sales in China reached approximately 45 percent in 2024. Around one in ten cars on Chinese roads is now electric, a penetration rate that no other large country has achieved.
Several structural factors explain this dominance. First, China's government made EV development a national industrial priority, providing sustained and substantial subsidies to manufacturers and consumers from roughly 2010 onward. While some of those subsidies have been reduced or restructured, the industrial base they created — battery factories, supply chains, software competence — has given Chinese manufacturers cost and scale advantages that are now self-sustaining even without equivalent subsidies.
Second, Chinese domestic brands have taken over the EV market in ways that mirror the disruption thesis rather than the incumbent response. BYD, not Tesla or Volkswagen or Toyota, was the world's largest EV manufacturer by sales in 2024. BYD, NIO, Li Auto, SAIC, and dozens of other Chinese manufacturers offer EVs across a wide price range, including affordable models at the equivalent of USD 10,000 to 15,000 that are dramatically less expensive than any equivalent in European or North American markets.
Third, Chinese urban conditions — severe air quality problems in major cities, highly congested streets where the range advantages of combustion cars are less relevant, and government-favored charging infrastructure — created favorable conditions for EV adoption that purely market-driven processes might not have.
Source: IEA Global EV Outlook 2025, Executive Summary — https://www.iea.org/reports/global-ev-outlook-2025/executive-summary
Norway: the penetration champion
Norway's 88 percent EV share of new car sales in 2024 is the most extreme mass-market EV adoption in the world. Approximately 29 percent of all cars on Norwegian roads are now electric — a penetration rate that most countries have as a 2030 or 2035 target. Norway is on track to effectively complete the transition to an electric new-car market by around 2025 or 2026, with only a small rump of combustion and hybrid sales remaining.
How did Norway — a country with a cold climate, long distances, and sparse population in rural areas — achieve this? The answer is policy consistency over two decades. Norway provided generous purchase incentives, eliminated the 25 percent VAT on EVs (a particularly powerful measure in a high-tax country), gave EVs free access to toll roads and ferries for many years, reserved priority parking and charging spaces, and allowed EVs to use bus lanes. These incentives, combined with Norway's high baseline incomes and concern about air quality in Oslo, created a perfect adoption environment.
An irony that commentators regularly note: Norway is a major oil-producing nation, heavily dependent on hydrocarbon revenues, that is simultaneously among the world's most aggressive domestically in electrifying transportation. The revenues from oil exports effectively subsidize the EV transition within Norway while the country sells the fossil fuels that drive emissions elsewhere.
Source: IEA Global EV Outlook 2025, Trends in Electric Car Markets — https://www.iea.org/reports/global-ev-outlook-2025/trends-in-electric-car-markets-2
Europe: divergent trajectories within the single market
Europe as a whole saw approximately 3.2 million new electric car registrations in 2023, growing to higher levels in 2024, making it the second-largest EV market after China. But the aggregate number conceals very different national trajectories.
Scandinavia and Northern Europe lead by market share. Sweden at roughly 59 percent EV sales share, the Netherlands at 30 percent, and Denmark at around 47 percent are among the world's most advanced EV markets in penetration terms. Germany, despite being the EU's largest auto market and home to Volkswagen, BMW, and Mercedes-Benz, has seen slower EV growth after the German government abruptly ended its EV purchase subsidy program in December 2023, mid-year and ahead of schedule — a decision that caused EV sales to fall sharply in 2024. Germany's 18 percent BEV sales share lags Nordic neighbors by a significant margin.
France and the United Kingdom sit around 25 percent EV sales share — substantial markets with strong growth trajectories. Both countries have committed to ending internal combustion engine car sales by 2035, in alignment with the EU mandate (for France) and the UK's own Zero Emission Vehicle mandate.
The EU itself has mandated that all new cars sold from 2035 must be zero-emission, effectively requiring the complete electrification of new car sales within the bloc. This regulation, alongside ongoing debates about e-fuels exemptions and the competitive pressure from Chinese EVs, is the dominant policy backdrop for European auto manufacturers navigating an industry transformation whose outcome is not yet settled.
Source: IEA Global EV Outlook 2024 — https://www.iea.org/reports/global-ev-outlook-2024
The United States: large market, lagging share
The United States sold approximately 1.3 million new electric cars in 2024 — making it the third-largest EV market by volume after China and the collective European Union. Yet at a sales share of roughly 8 to 9 percent, US EV penetration lags China and most of Western Europe by a significant margin.
The Inflation Reduction Act of 2022 provided substantial consumer tax credits — up to USD 7,500 for new EVs meeting domestic content requirements — and manufacturing incentives that have driven investment in US EV and battery manufacturing. These provisions have contributed to growth, though the domestic content rules (designed to reduce dependence on Chinese battery supply chains) have also complicated which vehicles qualify for credits.
The US EV market is dominated by Tesla, which accounts for roughly half of all US EV sales despite rapidly expanding competition from Ford (Mustang Mach-E, F-150 Lightning), General Motors (Chevrolet Equinox EV, Silverado EV), Hyundai, Kia, and BMW. The charging infrastructure network — while expanding rapidly — remains less dense than in many European countries, a factor that continues to deter adoption among consumers without home charging capability.
Source: IEA Global EV Outlook 2025 — https://www.iea.org/reports/global-ev-outlook-2025
The battery supply chain: China's deeper advantage
Beyond vehicle production, China's dominance extends to the batteries that make EVs work. China accounts for approximately 70 to 80 percent of global lithium-ion battery cell production and processes the majority of the critical minerals — lithium, cobalt, manganese, nickel — that batteries require. This upstream dominance gives Chinese EV manufacturers structural cost advantages that Western manufacturers cannot quickly replicate: building battery gigafactories and establishing new critical mineral supply chains takes years and billions of dollars.
CATL (Contemporary Amperex Technology), a Chinese company, is the world's largest battery manufacturer by a wide margin, supplying not only Chinese brands but also Tesla, BMW, Volkswagen, and many others. BYD, which both makes batteries and builds cars, has vertically integrated in a way no Western competitor has matched.
The US and EU are both investing heavily in domestic battery manufacturing — through the IRA's battery production credits in the US and through the EU's Critical Raw Materials Act — but achieving supply chain independence from China in this sector within a decade is widely considered unrealistic by industry analysts.
Source: IEA, Critical Minerals Market Review 2024 — https://www.iea.org/reports/global-critical-minerals-outlook-2024
Why Japan is falling behind
Japan's EV penetration — around 4 percent of new sales in 2024 — lags almost every other wealthy nation, a remarkable fact given Japan's dominance of the global auto industry for decades. The explanation lies partly in strategy and partly in incumbency.
Toyota, Japan's largest automaker and historically the world's most profitable car company, made a strategic bet on hybrid technology — most notably the Prius hybrid — and on hydrogen fuel cells as the long-term zero-emission solution, rather than on battery EVs. Toyota's chairman publicly expressed skepticism about the pace of full electrification and the readiness of charging infrastructure. This positioning influenced Japanese government policy and shaped the domestic market in ways that are now proving costly: Japan is losing ground in the fastest-growing segment of the global auto market.
As of 2025, Toyota has announced substantially expanded EV commitments and investment, but the company acknowledges it is behind and must catch up in a competitive environment where Chinese manufacturers have several years of manufacturing and software development head start. Japan's EV trajectory will be one of the most closely watched industrial stories of the next decade.
Source: IEA Global EV Outlook 2025 — https://www.iea.org/reports/global-ev-outlook-2025
The 2030 outlook: toward 300 million EVs
The IEA's Stated Policies Scenario (STEPS) — which models only announced and legislated policies, without additional climate ambition — projects the global EV fleet growing from approximately 58 million in 2024 to over 200 million by 2030. The IEA's more ambitious Net Zero Emissions by 2050 scenario requires the global fleet to reach approximately 300 million by 2030, requiring EV sales to reach roughly 50 percent of all new car sales globally by that year — from 20 percent today.
Achieving that would require dramatic acceleration in markets like India, Southeast Asia, Latin America, and Africa, where EV adoption currently lags significantly. India, despite having the world's second-largest vehicle market, sold only around 100,000 electric cars in 2024. The affordability gap between EVs and combustion vehicles in lower-income markets remains the dominant barrier — one that Chinese manufacturers, with their ability to produce low-cost EVs, are better positioned to address than Western competitors.
Source: IEA Global EV Outlook 2025, Outlook for Electric Mobility — https://www.iea.org/reports/global-ev-outlook-2025/outlook-for-electric-mobility
Frequently asked questions
Q: How far can most electric vehicles travel on a single charge? A: The range of modern electric cars varies by model and battery size. In 2024, mainstream EVs typically offered ranges of 250 to 400 kilometers (155 to 250 miles) on a single charge under standard test conditions. Premium long-range models — including Tesla Model S, Mercedes EQS, and Hyundai IONIQ 6 — exceed 500 kilometers under test conditions. Real-world range is typically 10 to 20 percent below test conditions, and cold weather can reduce range significantly — a particular concern in Nordic countries. Rapid charging technology has improved substantially: many modern EVs can add 100 to 200 kilometers of range in 15 to 20 minutes using high-speed DC charging stations.
Q: Are electric vehicles actually lower-carbon than combustion cars over their full lifecycle? A: Yes, in virtually all electricity grids globally as of 2024. A lifecycle analysis must account for emissions from battery manufacturing (which are significant, particularly the energy-intensive production of cathode materials) as well as tailpipe emissions over the vehicle's life. Studies by the IEA, BloombergNEF, and Transport and Environment consistently find that even in coal-heavy grids, EVs produce lower lifecycle CO2 than comparable combustion vehicles. In grids with substantial renewable energy — including China, France, and most of Northern Europe — the lifecycle advantage is very large. As grids decarbonize further, the advantage grows.
Q: What is the biggest barrier to EV adoption in developing countries? A: Purchase price is the dominant barrier. The upfront cost of an EV remains higher than a comparable combustion vehicle in most markets, even as the gap has narrowed. In lower-income markets, where consumers are more sensitive to upfront cost and rely on used car markets (which have far fewer EVs available), the affordability barrier is severe. In India, for example, the most popular EVs are electric three-wheelers and two-wheelers — lower-priced segments where the economics work — rather than passenger cars. Chinese manufacturers' ability to produce EVs at USD 10,000 to 15,000 is beginning to create affordable options, but penetrating markets with limited charging infrastructure requires solving the infrastructure problem in parallel.
Q: Is there enough lithium to electrify the global car fleet? A: Current lithium reserves and resources are sufficient to electrify the global car fleet many times over, according to the USGS and IEA assessments. The constraint is not geological abundance but mining and processing capacity — expanding lithium extraction and refining to meet demand requires large capital investment and faces environmental and community approval challenges in producing countries (primarily Australia, Chile, and Argentina). Additionally, battery technology is evolving rapidly toward reduced lithium intensity (solid-state batteries) and alternative chemistries (lithium-iron-phosphate batteries, which use no cobalt and less lithium per kWh than older chemistries).
The takeaway
The electric vehicle transition is underway at a scale and speed that was not predicted even five years ago. The 58 million EVs on the world's roads at end of 2024 represent only about 4 percent of the total passenger car fleet, meaning the vast majority of the transition is still ahead. China is the overwhelming leader by any absolute measure: stock, sales, market share, and manufacturing capability. Norway has demonstrated that a wealthy, policy-consistent nation can essentially complete the passenger car transition within a decade. The United States, Europe, and Japan are progressing but at varying speeds, with policy continuity the key determinant of trajectory. The most consequential next chapter will be whether affordable EVs — primarily from Chinese manufacturers — can accelerate adoption in India, Southeast Asia, and Africa, where the next several hundred million cars sold will be bought.
Sources
- IEA Global EV Outlook 2025 — https://www.iea.org/reports/global-ev-outlook-2025
- IEA Global EV Outlook 2024 — https://www.iea.org/reports/global-ev-outlook-2024
- IEA Global EV Data Explorer — https://www.iea.org/data-and-statistics/data-tools/global-ev-data-explorer
- IEA Global EV Outlook 2025, Trends in Electric Car Markets — https://www.iea.org/reports/global-ev-outlook-2025/trends-in-electric-car-markets-2
- IEA Global EV Outlook 2025, Executive Summary — https://www.iea.org/reports/global-ev-outlook-2025/executive-summary
- IEA Critical Minerals Market Review 2024 — https://www.iea.org/reports/global-critical-minerals-outlook-2024
Related Reading
- Countries That Emit the Most CO2
- Countries with the Most Nuclear Power
- Countries with the Most 5G Connections
- Countries with the Most Nobel Prizes
- Countries with the Highest Income Tax Rates
Vehicle ownership and network quality answer different questions. See how to compare cycling infrastructure for an example of evaluating a transport network rather than counting vehicles.
Follow new articles
Add SciHub101 to your feed reader to see new science and technology stories.
About the Author
SciHub101 is an independent science and technology publication founded and edited by Buğra Sözeri, a software engineer and app developer based in Türkiye. AI tools assist with drafting and research. Source documentation in the existing archive is uneven, and articles are being reviewed and corrected. The Editorial Team byline identifies editorial responsibility; it does not certify specialist or independent human review. Where we compare products, anything built by our own team is labelled as such — see the editorial guidelines and About page for how corrections and disclosures work.
Related Articles

Countries with the Most Nuclear Power (Ranked)
The United States operates 94 nuclear reactors producing nearly 97 GW of electricity — more nuclear capacity than any other nation on Earth. But France is the world's most nuclear-dependent country: 70–75% of French electricity comes from its 57 reactors, the highest share of any major economy. This article ranks nuclear nations by capacity, reactor count, and electricity share.

Countries That Recycle the Most (Municipal Waste Recycling Rates Ranked)
Austria recycles or composts 62.8% of its municipal waste — the highest rate in the European Union, the benchmark organization for standardized recycling statistics. Germany follows at approximately 67% when historical figures are used, with ten EU countries exceeding 50%. Outside Europe, South Korea leads Asia with an overall recycling and recovery rate that exceeds 80% through a deposit-refund system widely studied as a global model.
Countries That Consume the Most Electricity (Ranked)
China consumes more electricity than any other country — approximately 9,794 TWh in 2024, nearly 33 percent of global demand and more than the United States, India, Russia, and Japan combined. The United States ranks second at roughly 4,194 TWh. India is third and the fastest-growing major consumer. But total consumption obscures vast per-capita differences: Iceland, Norway, and Canada use far more electricity per person than China or India. This ranking covers total and per-capita electricity consumption with IEA and Ember data, methodology notes, and analysis of what drives the gaps.

Countries with the Most Hydropower (Ranked by Installed Capacity)
China leads the world in hydropower with 435.95 GW of installed capacity — more than three times that of second-place Brazil at 110 GW. Hydropower is the world's largest source of renewable electricity, accounting for roughly 40 percent of global renewable generation. This ranking covers the top 15 countries by hydropower installed capacity using IHA and IRENA 2024 data, with methodology, historical context, and caveats about what capacity figures do and do not tell you.
How to Choose the Best Electric Vehicle in 2026: A Practical Guide to Range, Charging, Battery, Cost, and Use Cases
Choosing an electric vehicle in 2026 requires evaluating six factors: daily driving distance versus battery range (a mismatch makes ownership difficult), charging infrastructure availability in your region (home charging access is critical), total cost of ownership over five years (including electricity, maintenance, and depreciation), vehicle type and use case (SUV vs. sedan vs. truck), battery warranty and degradation expectations, and BEV (battery electric) versus PHEV (plug-in hybrid) tradeoffs. A 200-mile-range EV costs $35,000–$55,000 and can operate in virtually any climate with proper charging planning; a 300+ mile range vehicle adds $5,000–$15,000 but eliminates range anxiety. This guide walks through the practical evaluation framework and provides a comparison table of 2026 models across five vehicle categories.

Countries That Emit the Most CO2 (Ranked)
China emits 12.3 billion tonnes of CO2 per year — 32% of the global total — making it by far the world's largest emitter. The United States is second at 4.9 Gt, India third at roughly 3.4 Gt. Together the top three nations account for more than half of all fossil fuel CO2 emissions on Earth. Here is the full country ranking with methodology, per-capita figures, and historical context.