Countries with the Most Hydropower (Ranked by Installed Capacity)
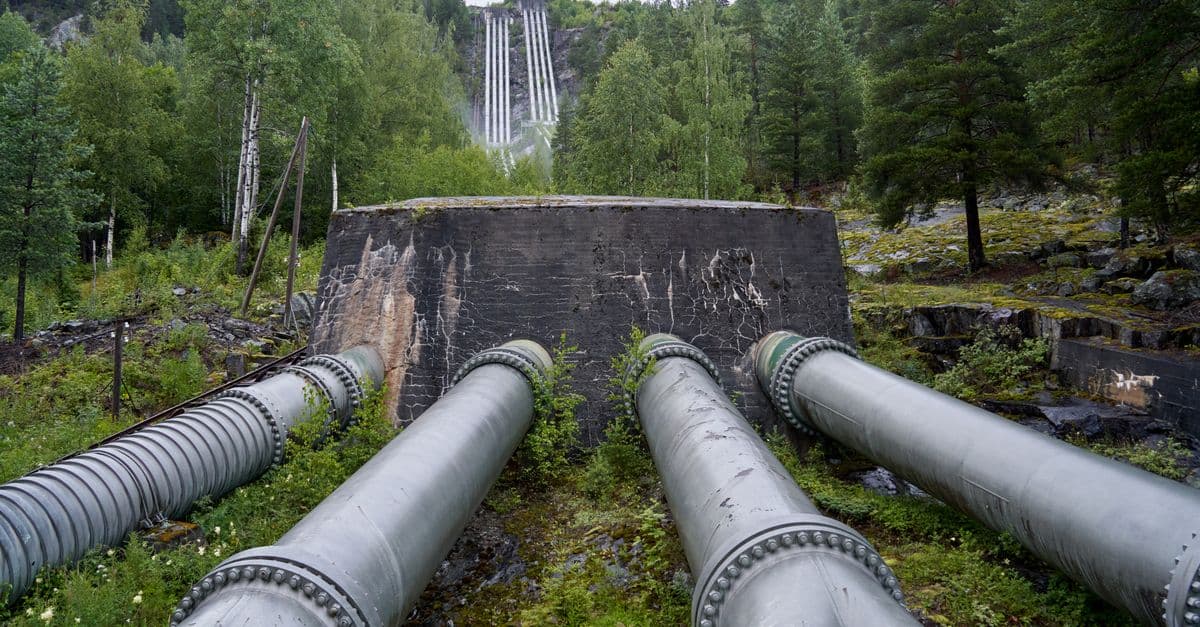
Photo: Barnabas Davoti / Pexels
China has reshaped the global map of renewable energy more dramatically than any other country in history, and nowhere is that transformation more visible than in hydropower. With 435.95 gigawatts (GW) of installed hydropower capacity as of 2024 — a figure that includes 7.75 GW of pumped-storage hydropower added in that year alone — China accounts for roughly one-third of the entire world's hydroelectric generating potential. To put that in perspective, China's hydropower capacity is larger than the installed capacity of all other energy sources combined in most medium-sized nations.
Brazil, with its vast Amazonian watershed and the continental-scale river systems of the Paraná and São Francisco basins, holds second place at approximately 110 GW. Canada and the United States are tightly clustered behind Brazil at roughly 84 GW and 102 GW respectively, with Russia completing the top five at 54.3 GW. Together, these five countries account for nearly half of global hydropower capacity.
What the raw capacity figures do not capture is the extraordinary variation in how much hydropower matters to each country's electricity system. Norway generates roughly 88 to 92 percent of all its electricity from hydropower — more than any other large economy — yet its total installed capacity is only 33.9 GW, less than one-tenth of China's. Brazil depends on hydropower for approximately 65 percent of its electricity, making drought years economically consequential. China, despite having by far the most capacity in absolute terms, generates a far smaller share of its electricity from hydro because its total power system is enormous.
Globally, the International Hydropower Association (IHA) estimates that total installed hydropower capacity reached 1,443 GW in 2024, with generation jumping 10 percent year-on-year to 4,578 TWh — the highest level ever recorded. Hydropower remains the single largest source of renewable electricity worldwide.
Methodology
Q: What does "installed capacity" mean, and why is it different from generation? A: Installed capacity measures the maximum electricity output a power plant can produce under ideal conditions, expressed in gigawatts (GW) or megawatts (MW). Generation — measured in terawatt-hours (TWh) — reflects how much electricity is actually produced over a period, typically one year. A hydropower plant's generation depends on rainfall and river flow, which vary year to year: a drought can cut a country's hydropower generation by 20 to 30 percent even if capacity is unchanged. Ranking countries by installed capacity measures their potential; ranking by generation measures their actual output. This article uses installed capacity as the primary metric because it reflects the structural commitment a country has made to hydropower infrastructure, independent of hydrological luck in any given year.
Data are sourced from the International Hydropower Association (IHA) 2025 World Hydropower Outlook, which compiles national capacity data annually and is the most authoritative source for this metric. Cross-reference figures come from the International Renewable Energy Agency (IRENA) Renewable Capacity Statistics 2025, which tracks capacity by technology and country. Where IHA country profile pages provide more granular data, those figures are used.
Source: IHA 2025 World Hydropower Outlook — https://www.hydropower.org/publications/2025-world-hydropower-outlook
Source: IHA Country Profile: Russia — https://www.hydropower.org/country-profiles/russia
Source: IRENA Renewable Capacity Statistics 2025 — https://www.irena.org/Publications/2025/Jul/Renewable-energy-statistics-2025
Top 15 countries by hydropower installed capacity (2024)
| Rank | Country | Installed Capacity (GW) | Share of Global Total | Data year | Notes |
|---|---|---|---|---|---|
| 1 | China | 435.95 | ~30% | 2024 | Added 14.4 GW in 2024 alone |
| 2 | Brazil | ~110 | ~8% | 2024 | Itaipu and Belo Monte among world's largest plants |
| 3 | United States | ~102 | ~7% | 2024 | Pacific Northwest dominant; Grand Coulee largest US dam |
| 4 | Canada | ~84 | ~6% | 2024 | Quebec's James Bay complex is among world's largest |
| 5 | Russia | 54.3 | ~4% | 2024 | Generation 212 TWh; Siberian rivers basis |
| 6 | India | ~52 | ~4% | 2024 | Large hydro ~46.9 GW + small hydro ~5.1 GW |
| 7 | Norway | 33.9 | ~2% | 2024 | Produces ~90% of electricity from hydro |
| 8 | Turkey | ~32.8 | ~2% | 2024 | Second in Europe after Norway |
| 9 | Spain | 22.7 | ~2% | 2024 | Iberian peninsula rivers; drought-sensitive |
| 10 | Italy | 22.1 | ~2% | 2024 | Alpine rivers dominant |
| 11 | Japan | ~22 | ~2% | 2024 | Conventional hydro; large pumped-storage base |
| 12 | Sweden | 16.4 | ~1% | 2024 | Nordic rivers; high share of national electricity |
| 13 | Germany | 14.6 | ~1% | 2024 | Mostly pumped-storage and run-of-river |
| 14 | Austria | 11.9 | ~1% | 2024 | One of Europe's most hydro-dependent grids |
| 15 | France | ~10 | ~1% | 2024 | Alpine rivers; complements nuclear-dominant grid |
Global total: approximately 1,443 GW (2024)
Source: IHA 2025 World Hydropower Outlook — https://www.hydropower.org/publications/2025-world-hydropower-outlook
Source: IHA Europe Regional Profile — https://www.hydropower.org/region-profiles/europe
Source: India Ministry of New and Renewable Energy — https://mnre.gov.in
Historical context: hydropower's long arc
Hydropower is the oldest large-scale electricity generation technology. The first hydroelectric power station opened at Niagara Falls in 1881, and by the early twentieth century, hydropower supplied the majority of the world's electricity — not because it was abundant, but because coal and gas generation had not yet matured. The Tennessee Valley Authority (TVA) dams of the 1930s and 1940s represent perhaps the most consequential infrastructure program in American history: they electrified an impoverished region, controlled catastrophic flooding, and demonstrated that large dam projects could reshape entire economies.
The mid-twentieth century saw a global dam-building boom. The Soviet Union constructed enormous hydroelectric complexes on the Volga, Yenisei, and Angara rivers. Canada built the James Bay project across Quebec's boreal wilderness. Brazil and Paraguay constructed the Itaipu dam on the Paraná River, which remained the world's largest power plant by generation for years. Egypt built the Aswan High Dam with Soviet assistance, transforming agriculture in the Nile Valley while permanently flooding Nubian heritage sites upstream.
By the 1980s, the dam-building era was encountering fierce opposition. The social and environmental costs had become impossible to ignore: populations displaced by reservoirs, fisheries destroyed by blocked migration routes, ecosystems submerged, indigenous lands inundated without meaningful consent. The World Bank, which had been the primary funder of large dams in developing countries, effectively retreated from dam financing in the 1990s under sustained advocacy pressure. The World Commission on Dams, reporting in 2000, produced a comprehensive reckoning with these costs that reshaped global policy on large infrastructure projects.
Source: International Hydropower Association, Hydropower Facts — https://www.hydropower.org/iha/discover-facts-about-hydropower
China: the era-defining hydropower superpower
No country has invested as heavily in hydropower as China, and no country ever will — at least not in the near term. The Three Gorges Dam, completed in 2003, has a capacity of 22.5 GW and remains the world's single largest power station by installed capacity. It displaced approximately 1.3 million people during its construction, a figure that still generates significant human rights discussion. But Three Gorges is only the most visible element of what is, in totality, a hydropower system without parallel.
China added 14.4 GW of new hydropower capacity in 2024 alone. Its current capacity of 435.95 GW is more than double that of the United States. The Baihetan dam, completed in 2022 at 16 GW, is the world's second-largest power station. The Xiluodu and Wudongde dams, both on the Jinsha River, together exceed 20 GW. China's planning pipeline includes further projects on the Yarlung Tsangpo River in Tibet that, if constructed, would individually dwarf Three Gorges.
China's hydropower build-out is inseparable from its industrial policy logic: hydropower provides dispatchable renewable energy, meaning it can be ramped up or down in response to grid demand, unlike solar and wind. It also provides pumped-storage capacity — essentially enormous batteries that use off-peak electricity to pump water uphill, then release it to generate power during peak demand. China added 7.75 GW of pumped-storage hydropower in 2024, more than any other country.
Source: IHA 2025 World Hydropower Outlook news release — https://www.hydropower.org/news/flagship-2025-world-hydropower-outlook-out-now
Brazil: hydro dependence and the drought problem
Brazil's relationship with hydropower is more fraught than the headline capacity figure suggests. For most of the twentieth century, hydropower expansion was synonymous with development: dams powered São Paulo's industrial boom, lit up Rio de Janeiro, and extended electrification to remote Amazonian communities. By the early 2000s, Brazil generated more than 90 percent of its electricity from hydro.
Then came the droughts. In 2001, a severe drought triggered Brazil's worst electricity crisis since World War II: rolling blackouts, emergency rationing, and a sharp economic contraction. The episode repeated itself in 2015 and again in 2021, when reservoir levels at major plants dropped to critical levels. These crises forced Brazil to rethink hydropower dependence and invest aggressively in wind and solar as weather-independent complements.
The Belo Monte dam on the Xingu River, which reached full operation in 2019, added 11.2 GW of capacity but became one of the most contested infrastructure projects in Latin American history. Indigenous communities downstream, led by the Kayapó people, fought the project for decades. The dam's reservoir flooded significant areas of the Amazon, displacing thousands of people.
Today, Brazil's hydropower remains its electricity backbone, but the country has deliberately diversified. Wind power capacity has grown from near-zero in 2005 to over 25 GW, and solar is expanding rapidly. The goal is to reduce drought vulnerability without abandoning the existing hydropower infrastructure in which Brazil has invested over a century.
Source: IHA 2025 World Hydropower Outlook — https://www.hydropower.org/publications/2025-world-hydropower-outlook
Norway: the nation that runs almost entirely on water
Norway occupies a unique position in the global hydropower story. It generates approximately 88 to 92 percent of all its electricity from hydropower — the highest share of any major economy — from a total installed base of 33.9 GW spread across hundreds of relatively small plants fed by the country's glacially carved river systems and high-altitude fjord headwaters.
Norway's hydropower dominance is a product of geology and climate: the country's steep terrain, abundant rainfall, and cold-storage snowpack make it naturally suited for run-of-river and reservoir hydropower. The economics were compelling enough that Norway electrified its fishing and forestry industries with hydro power in the early twentieth century, decades before many other European nations reached similar electrification levels.
Today, Norway's hydropower surplus makes it a critical player in European electricity markets. Underground cables — most notably the NordLink cable to Germany and the North Sea Link to the United Kingdom — allow Norway to export surplus hydropower when its reservoirs are full and import wind and nuclear power during dry periods. Norway effectively functions as a giant rechargeable battery for the broader Northern European grid.
The country also faces challenges: its reservoirs serve double duty as water supplies, and during dry years, the tension between electricity export revenues and water security creates political friction. Climate change is altering precipitation patterns and snowmelt timing in ways that make long-term planning increasingly complex.
Source: IHA Europe Regional Profile — https://www.hydropower.org/region-profiles/europe
Why hydropower remains critical to net-zero targets
Despite its twentieth-century baggage of displaced communities and flooded ecosystems, hydropower is now being reappraised by climate scientists and energy planners as an irreplaceable component of decarbonized electricity systems. The core argument is about dispatchability: solar panels produce electricity only when the sun shines, and wind turbines only when the wind blows. Hydropower reservoirs, by contrast, store energy in the physical form of elevated water and can release it on demand — within minutes of a grid operator's instruction.
As solar and wind capacity scales globally, the need for dispatchable, weather-independent backup generation grows in proportion. Nuclear power provides some of this, but new nuclear plants are expensive and slow to build. Hydropower reservoirs — particularly those already built — provide it essentially for free, at least in terms of marginal operating cost. This is why the IHA's 2025 World Hydropower Outlook argues that existing hydropower infrastructure should be considered critical grid infrastructure in the same way as transmission lines, not merely one generation source among many.
Pumped-storage hydropower (PSH) represents the most scalable form of grid-scale energy storage currently available. Unlike lithium-ion batteries, pumped-storage projects can last a century or more, have very long discharge durations, and are limited mainly by geography rather than material supply chains. China's aggressive PSH build-out is partly a recognition that its vast solar and wind fleet requires long-duration storage to remain reliable.
The challenge for developing countries is financing. New hydropower projects, particularly large ones, require enormous upfront capital and long construction timelines. The social and environmental safeguards that responsible projects now require — meaningful indigenous community consultation, environmental impact assessment, fish passage infrastructure, downstream flow guarantees — add cost and time. Only countries with low cost of capital, strong state capacity, or access to multilateral development bank financing can typically build large hydro at scale.
Source: IHA 2025 World Hydropower Outlook — https://www.hydropower.org/publications/2025-world-hydropower-outlook
Source: REN21 Global Status Report 2025 — https://www.ren21.net/gsr-2025/technologies/hydro-power/
The geopolitical dimension: hydropower as energy security asset
The distribution of hydropower capacity is not merely a technical fact but an emerging source of energy geopolitics. The top five countries by capacity — China, Brazil, the United States, Canada, and Russia — collectively hold more than half of global hydropower. This concentration creates asymmetric power in electricity markets and energy transitions. Norway's ability to export surplus hydropower into European electricity markets gives it disproportionate influence over regional grid stability and pricing. China's hydropower capacity — coupled with its pumped-storage ambitions and its dominance in solar and wind manufacturing — positions it as an architect of the net-zero transition in ways smaller countries cannot match. Brazil's hydropower dependency, combined with the reversibility of climate decisions (drought affects output immediately), creates vulnerability that shapes its international energy negotiations. Countries without significant hydropower capacity must either build it themselves (expensively and slowly) or import electricity (creating dependency). India and Turkey's push to expand hydropower reflects this strategic logic: energy independence through diversification of domestic generation. For the energy transition to succeed globally, hydropower's role as dispatchable, storage-capable generation will become more valuable — meaning that countries with abundant rivers and the capital to dam them possess a durable advantage in decarbonized energy systems.
Frequently asked questions
Q: Is hydropower really "renewable" if it floods ecosystems and displaces communities? A: Hydropower is classified as renewable by the IEA, IRENA, and most national energy authorities because the water cycle that powers it is perpetually replenished by rainfall and snowmelt, unlike fossil fuels which are consumed. Whether it is "clean" in an environmental and social sense is a distinct and more contested question. Hydropower projects vary enormously in their impacts: a small run-of-river plant that diverts a fraction of a stream's flow is ecologically very different from a mega-dam that creates a reservoir the size of a small country. Modern project standards, including those of the Hydropower Sustainability Standard (HSS), attempt to define what responsible hydropower looks like, but implementation varies widely.
Q: Which country generates the most electricity from hydropower in absolute terms? A: China, by a substantial margin. China generated approximately 1,200 to 1,300 TWh of hydropower annually in recent years, though annual figures vary with rainfall. Brazil typically generates 350 to 400 TWh. Canada generates roughly 380 to 400 TWh. The United States generates approximately 250 to 300 TWh. Norway generates approximately 130 to 160 TWh — smaller in absolute terms, but from a grid that is almost entirely powered by it.
Q: What is pumped-storage hydropower and why does it matter? A: Pumped-storage hydropower (PSH) uses two reservoirs at different elevations. During periods of excess electricity (typically at night when demand is low and wind generation is high), water is pumped from the lower to the upper reservoir. During peak demand, the water is released back through turbines to generate electricity. PSH is the world's dominant form of grid-scale energy storage, accounting for more than 90 percent of all stored energy capacity globally. Countries like Japan, the United States, and China have built substantial PSH capacity specifically to firm up their electricity systems as variable renewables scale.
Q: Will new hydropower be built given the environmental controversies? A: Yes, but primarily in South and Southeast Asia and Sub-Saharan Africa, where energy access remains limited and the opportunity cost of not building is high. Countries like Bhutan, Nepal, Ethiopia, Tanzania, and Laos are actively developing significant hydropower capacity, often for export as well as domestic use. In OECD countries, new large-scale hydropower is rare; the focus is on upgrading existing plants, improving efficiency, and adding PSH capacity.
The takeaway
The hydropower ranking is ultimately a ranking of geography, history, and industrial ambition. China, Brazil, Canada, Russia, and the United States top the list because they have vast river systems, have invested in them for a century, and have the engineering and financial capacity to build at scale. Norway leads in dependency because its terrain makes hydro uniquely suited to its geography. India and Turkey are climbing the ranks because they have the rivers and the policy will to develop them.
Hydropower's role in the energy transition is not nostalgic — it is structural. The world's existing reservoir systems represent an enormous natural battery whose value grows, not shrinks, as solar and wind scale up. The countries that have built the most hydropower are, arguably, best positioned for a renewable-dominated grid — not because hydro alone is enough, but because it provides the dispatchable backbone that intermittent sources need.
Sources
- IHA 2025 World Hydropower Outlook — https://www.hydropower.org/publications/2025-world-hydropower-outlook
- IHA 2025 Flagship Report News Release — https://www.hydropower.org/news/flagship-2025-world-hydropower-outlook-out-now
- IHA Country Profile: Russia — https://www.hydropower.org/country-profiles/russia
- IHA Europe Regional Profile — https://www.hydropower.org/region-profiles/europe
- IRENA Renewable Energy Statistics 2025 — https://www.irena.org/Publications/2025/Jul/Renewable-energy-statistics-2025
- REN21 Global Status Report 2025, Hydropower chapter — https://www.ren21.net/gsr-2025/technologies/hydro-power/
- India Ministry of New and Renewable Energy, Renewable Energy Statistics 2024-25 — https://mnre.gov.in
Related Reading
Follow new articles
Add SciHub101 to your feed reader to see new science and technology stories.
About the Author
SciHub101 is an independent science and technology publication founded and edited by Buğra Sözeri, a software engineer and app developer based in Türkiye. AI tools assist with drafting and research. Source documentation in the existing archive is uneven, and articles are being reviewed and corrected. The Editorial Team byline identifies editorial responsibility; it does not certify specialist or independent human review. Where we compare products, anything built by our own team is labelled as such — see the editorial guidelines and About page for how corrections and disclosures work.
Related Articles
Countries That Produce the Most Solar Power (Ranked)
China installed 278 GW of new solar capacity in 2024 alone — more than the entire installed base of the United States. With 888 GW of total solar PV capacity, China now hosts nearly half of all solar power on Earth. This article ranks the top solar nations by installed capacity and explains how the global solar revolution became so geographically concentrated.
Countries with the Most Freshwater Resources (Ranked)
Brazil has the world's largest total renewable freshwater resources — approximately 8,647 cubic kilometers per year, more than any other country and roughly 20 percent of the global total. Russia is second at 4,525 km³/year, Canada third at 2,860 km³/year. But total volume is only part of the story: Canada's per-capita freshwater availability is 36 times higher than China's. And water stress — not total availability — is the defining water challenge of the twenty-first century. This ranking covers the top 20 countries by total renewable freshwater resources, sourced from FAO AQUASTAT, with per-capita comparison and analysis of global water scarcity.
Countries with the Most Electric Vehicles (Ranked)
China dominates global EV adoption: of the nearly 58 million electric cars on the world's roads at the end of 2024, China accounts for more than half. Chinese buyers purchased over 11 million new EVs in 2024 alone — more than were sold globally just two years earlier. Norway leads in EV penetration, with 29% of all cars on its roads now electric. This ranking covers the top countries by total EV stock, new sales, and market share, sourced from the IEA Global EV Outlook 2025.
Countries with the Most Wind Power Capacity (2025 Ranked)
China has about 641 GW of installed wind capacity, nearly half of the world's roughly 1,291 GW. The United States, Germany, India, and Brazil follow. Denmark ranks 17th by capacity but gets about 59% of its electricity from wind. Here is the 2025 ranking, what it measures, and what it leaves out.
Largest Solar Farms in the World
The largest solar farms rank by installed capacity, from China's Tengger park to the UAE's Al Dhafra site. Here is how capacity, land, and real output compare.
Countries With the Most Renewable Energy Capacity (2025)
China had 1,827 GW of renewable power capacity at the end of 2024, 41% of the world total, per IRENA. See the top 20 countries by installed gigawatts and why capacity is not the same as generation.