Largest Solar Farms in the World
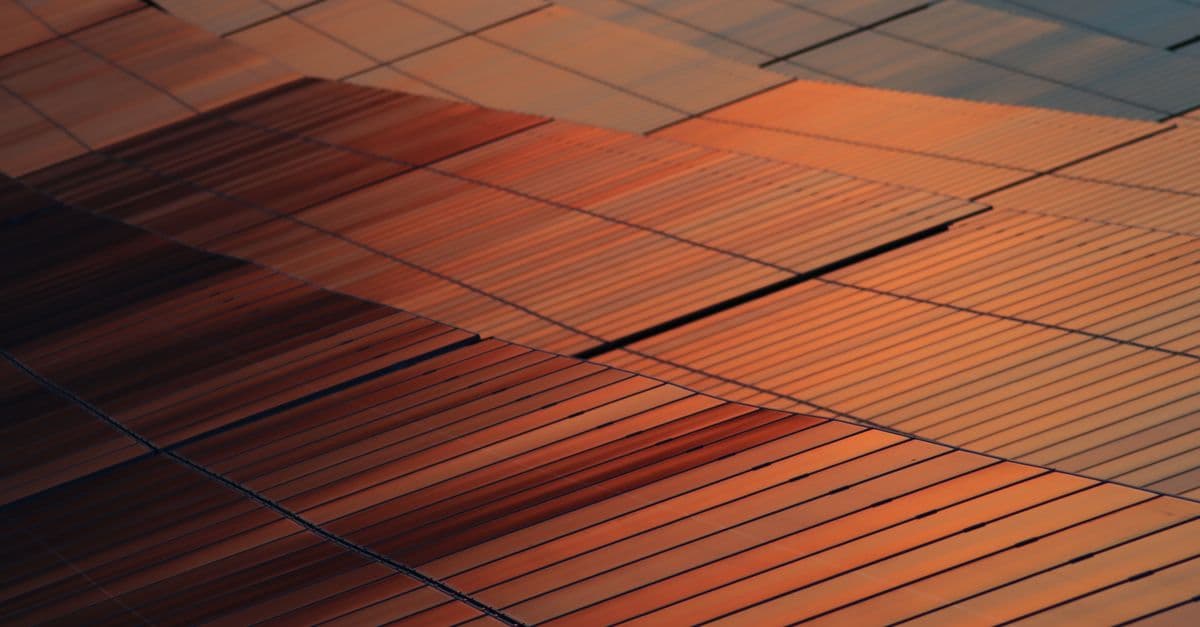
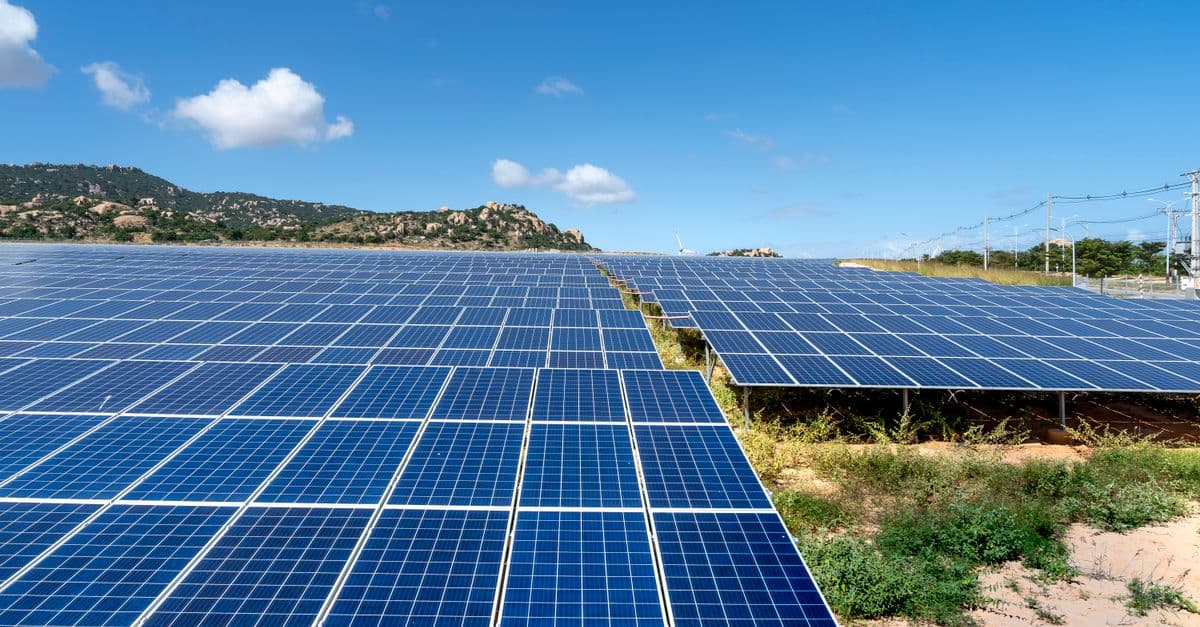
Photo: Tobi &Chris / Pexels
Global solar capacity crossed 2.2 terawatts by the end of 2024, and roughly 60% of the new capacity installed that year went up in China alone, according to the International Energy Agency's PVPS program. Inside that number sits a handful of installations so large they cover more ground than small cities: sprawling deserts and salt flats now converted into some of the most productive power plants ever built. This guide ranks the largest solar farms in the world, explains why the ranking depends on which number you trust, and walks through the engineering that lets a single facility power hundreds of thousands of homes.
What counts as the "largest" solar farm
Ask five sources for the world's largest solar farm and you will get five different answers, and none of them are lying. The confusion comes from three different things people call "largest": total installed capacity in megawatts (MW) or gigawatts (GW), physical land area in square kilometers, and whether the site counts as one contiguous plant or a cluster of many independently built projects under one administrative name.
China's Golmud Solar Park in Qinghai province illustrates the cluster problem well. It is often cited as the world's largest solar park because it combines around 80 separate solar plants and more than 7.2 million panels into a reported capacity near 2.8 GW, according to figures compiled by industry trackers including Heatable's 2026 solar farm roundup. That is a real number, but it describes a regional zone built out over more than a decade, not a single power station commissioned on one day.
Compare that to the Al Dhafra Solar PV project outside Abu Dhabi, which Masdar, TAQA, EDF Renewables, and JinkoPower inaugurated as a single 2 GW facility in November 2023. Al Dhafra covers more than 20 square kilometers and uses nearly 4 million bifacial panels, according to PV magazine's site profile. By the "single connected site, single commissioning event" definition, Al Dhafra is the largest solar power plant on Earth. By the "cumulative capacity under one administrative zone" definition, Golmud and India's Bhadla Solar Park still rank higher. Both framings are defensible. Neither is complete without the other.
The current ranking, by installed capacity
The table below uses the most commonly cited nameplate capacity for each site, which is the maximum output the plant is rated to produce under ideal sunlight and equipment conditions. It is not the same as the electricity the plant actually delivers over a year, a distinction covered in detail further down.
| Solar Farm | Location | Reported Capacity | Land Area | Type |
|---|---|---|---|---|
| Golmud Solar Park | Qinghai, China | ~2.8 GW (cluster of ~80 plants) | Multi-site zone | Utility-scale cluster |
| Al Dhafra Solar PV | Abu Dhabi, UAE | 2.0 GW | ~20 km² | Single-site plant |
| Bhadla Solar Park | Rajasthan, India | ~2.7 GW | ~57 km² (14,000 acres) | Multi-developer park |
| Mohammed bin Rashid Al Maktoum Solar Park | Dubai, UAE | 3.86 GW (phased, DEWA-reported) | Multi-phase zone | Phased utility park |
| Pavagada Solar Park (Shakti Sthala) | Karnataka, India | ~2.05 GW | ~53 km² (13,000 acres) | Multi-developer park |
| Xinjiang solar cluster | Xinjiang, China | ~3.5 GW (Reuters-reported) | Multi-site | Utility-scale cluster |
| Benban Solar Park | Aswan, Egypt | ~1.8 GW | ~37 km² | Multi-developer park |
| Tengger Desert Solar Park | Ningxia, China | ~1.55 GW | ~43 km² | Utility-scale park |
Table: Reported figures compiled from operator statements, PV Tech, Wikipedia's sourced entries on Bhadla, Pavagada, and Tengger solar parks, and industry trackers including Heatable and Sunsave. Capacity figures for phased and multi-developer parks change as new blocks come online; treat them as most-recent-reported, not fixed.
Notice the pattern: the top of the list is dominated by China, India, and the Gulf states, three regions that share one thing in common — enormous stretches of flat, cheap, sun-drenched, and largely unfarmable land. That is not a coincidence. It is the single biggest predictor of where a gigawatt-scale solar farm gets built.
Why deserts and drylands win the size race
A solar farm needs land, sun, and a way to move electricity somewhere people actually use it. Deserts satisfy the first two almost by definition: minimal cloud cover, few competing land uses, and land prices low enough that a multi-square-kilometer footprint is financially viable. The Thar Desert in Rajasthan, the Gobi-adjacent basins of Qinghai and Ningxia, and the Arabian desert outside Abu Dhabi all share the same profile: more than 300 sunny days a year and land nobody was going to farm or build housing on anyway.
Think of it like the difference between renting a warehouse downtown versus out past the airport. The downtown warehouse might be more convenient, but the one past the airport lets you build something ten times bigger for the same money. Solar developers make exactly that trade: they accept longer transmission lines in exchange for land that costs a fraction of what it would near a city, and then they build big enough that the extra transmission investment pays for itself.
The third ingredient, grid connection, is where deserts start to work against developers instead of for them. A 2 GW plant in the middle of nowhere is useless unless someone builds high-voltage transmission lines to carry that power to where people live. China solved this with ultra-high-voltage direct current (UHVDC) lines that move power more than 2,000 kilometers from western deserts to eastern cities with minimal loss, a solution few other countries have replicated at the same scale.
How does bifacial panel technology increase output?
Bifacial panels capture sunlight on both the front and back surfaces, using light reflected off the ground, sand, or a reflective backing beneath the array to generate additional electricity from the rear side. Facilities like Al Dhafra use nearly 4 million bifacial panels specifically because desert sand reflects sunlight efficiently, according to PV magazine's technical profile of the plant. The gain over standard single-sided panels typically runs several percentage points, which compounds meaningfully across millions of panels.
Capacity versus what a solar farm actually delivers
This is the part most rankings skip entirely, and it is the part that matters most if you actually want to understand what these plants do. The megawatt number on a spec sheet is nameplate capacity: the maximum output the plant produces if every panel is clean, the sun is directly overhead, and nothing is drawing power away from the grid connection. Real-world output almost never hits that ceiling, because the sun sets, clouds pass, panels get dusty, and grids sometimes cannot absorb everything a plant could theoretically produce.
The metric that captures reality is capacity factor: the ratio of electricity a plant actually delivers over a year to what it would deliver if it ran at full nameplate output every single hour of that year. According to the U.S. National Renewable Energy Laboratory's Annual Technology Baseline, utility-scale solar capacity factors in the United States range from about 17% in the least sunny regions to around 31% in the sunniest, with single-axis tracking systems adding another five percentage points or more where solar resource is strongest. A median historical figure for US utility-scale projects installed between 2007 and 2021 sits around 24%, per Lawrence Berkeley National Laboratory's utility-scale solar data update.
Apply that math to a 2 GW plant like Al Dhafra. At a 25% capacity factor, which is a reasonable estimate for a low-latitude desert site with strong direct irradiance, the plant would deliver roughly 500 megawatts of average continuous power across a year, or about 4.4 terawatt-hours of electricity annually. That is enough to cover a substantial share of Abu Dhabi's residential demand, which is why Masdar and its partners projected the plant would power around 200,000 homes and cut over 2.3 million tonnes of carbon dioxide emissions per year, according to reporting from Enerdata.
Why does a solar farm's output drop even on sunny days?
Panel soiling, temperature derating, inverter losses, and curtailment all cut into theoretical output. Dust accumulation alone can cut panel efficiency by several percent between cleanings, which is a serious operational issue at desert sites like Bhadla, where sandstorms are common and panels require frequent washing to maintain rated output.
What is curtailment and why does it matter for these rankings?
Curtailment happens when a grid operator deliberately reduces a solar plant's output because the grid cannot absorb all the power being generated at that moment, often around midday when solar generation peaks but demand has not caught up. China in particular has faced curtailment challenges in western provinces where solar capacity has outpaced transmission buildout, meaning some of the largest plants by nameplate capacity do not always get to generate at their full potential even when the sun is shining.
Inside the engineering: what it takes to build a gigawatt-scale plant
Building a plant like Bhadla or Al Dhafra is closer to building a small city's worth of infrastructure than installing rooftop panels at scale. Each site requires graded and leveled land across tens of square kilometers, tens of thousands of steel or aluminum mounting structures anchored against wind loads, kilometers of internal medium-voltage cabling, dozens of inverter stations that convert the direct current (DC) panels produce into the alternating current (AC) the grid uses, and a substation capable of stepping that power up to transmission-level voltage.
Water is a surprising constraint. Desert solar farms need water to wash accumulated dust off panels regularly, and desert sites by definition have little of it. Bhadla Solar Park, which sits in one of the hottest and driest parts of Rajasthan, has had to develop dedicated water logistics for cleaning, since even a thin dust layer can cut output by a meaningful percentage, according to figures reported alongside Wikipedia's sourced entry on the park. Some newer sites are experimenting with robotic dry-cleaning systems that use brushes instead of water to reduce this dependency.
Tracking systems are another major engineering choice. Fixed-tilt arrays are cheaper to build and maintain but capture less sunlight over the course of a day. Single-axis tracking systems rotate panels to follow the sun from east to west, adding cost and mechanical complexity but boosting output by roughly five percentage points of capacity factor in strong-sun regions, per NREL's analysis. At gigawatt scale, that difference translates into tens of millions of dollars in additional annual revenue, which is why most new mega-projects, including Al Dhafra, use tracking systems rather than fixed mounts.
Think of a fixed-tilt panel like a sunbather lying flat on a towel all day: it gets whatever sun happens to fall on it. A tracking panel is more like someone repositioning their beach chair every hour to face the sun directly. Over a full day, the person actively repositioning captures noticeably more sunlight, even though both started with the same amount of daylight available. Another large energy structure is covered in the largest dams in the world.
Financing and ownership: how a 2-gigawatt plant gets paid for
No single company builds a plant this size alone. Al Dhafra was financed and owned through a consortium: Abu Dhabi National Energy Company (TAQA) holding 40%, with Masdar, EDF Renewables, and JinkoPower each holding 20%, according to PV Tech's coverage of the inauguration. This structure spreads both the multi-billion-dollar upfront capital cost and the long-term operating risk across several balance sheets, which is standard practice at this scale. Utility-scale solar procurement, meanwhile, is typically anchored by a power purchase agreement (PPA): a long-term contract in which a utility or government buyer agrees to purchase the plant's electricity at a fixed price for 20 to 25 years, giving developers and lenders the revenue certainty needed to justify a project this large.
India's Bhadla and Pavagada parks use a different model: the state government designates and prepares the land, builds shared transmission infrastructure, and then leases plots to multiple independent solar developers who each build and operate their own smaller plant within the park's boundary. That is why Bhadla's total capacity figure is really a sum of many separate projects rather than one integrated build, similar to Golmud in China. This model lowers the barrier to entry for smaller developers but means the "park" as a whole answers to no single operator.
Common confusion: what people get wrong about these rankings
The most frequent mistake is treating "solar park" and "solar power plant" as interchangeable terms. A solar park, like Bhadla or Pavagada, is a government-designated zone where multiple independent developers build separate projects that happen to sit next to each other and share transmission infrastructure. A solar power plant, like Al Dhafra, is a single facility built, financed, and operated as one project. Both are legitimate ways to measure "largest," but conflating them produces headlines that compare apples to fruit baskets.
The second common error is quoting capacity figures without a date. These plants expand in phases. The Mohammed bin Rashid Al Maktoum Solar Park in Dubai is a moving target precisely because Dubai's utility, DEWA, keeps adding phases, with reported capacity climbing from under 1 GW several years ago to 3.86 GW by 2026 reporting, according to figures compiled in industry coverage. A "largest solar farm" list published in 2022 and one published today can both be accurate for their respective publication dates and still disagree sharply.
The third error, covered above but worth repeating because it drives so much confusion, is quoting nameplate capacity as if it were guaranteed output. A 3.86 GW park does not deliver 3.86 GW of continuous power any more than a car's top speed tells you its average highway cruising speed. When a headline says a plant "can power X million homes," check whether that figure accounts for capacity factor or just divides nameplate wattage by average household consumption, because the two methods can produce numbers that differ by a factor of three or four.
Finally, readers often assume bigger automatically means more efficient. It does not. A cluster of older, less efficient panels spread across a huge land area can have a higher total nameplate capacity than a smaller, newer plant using higher-efficiency bifacial panels and tracking systems, even though the smaller plant generates more electricity per square meter of land and per dollar invested. Total capacity measures scale, not efficiency, and the two are frequently at odds.
What comes next for solar's biggest projects
The next wave of records will likely be shaped less by raw panel count and more by storage attachment and grid integration. Standalone solar capacity without batteries has already run into curtailment limits in parts of China and California during peak midday output; the plants that set new records over the next few years are increasingly likely to be paired with large battery storage systems that shift midday solar generation into the evening demand peak, rather than pure-generation plants competing on panel count alone. Combined solar-plus-storage projects change the ranking question entirely, since a smaller solar array paired with a large battery can deliver more usable, dispatchable electricity than a larger array with no storage at all.
The takeaway
There is no single largest solar farm in the world, because "largest" depends on whether you are counting nameplate megawatts, physical land area, or a single connected site versus a multi-developer zone. Al Dhafra in the UAE holds the strongest claim to largest single-site plant at 2 GW, while China's Golmud cluster and India's Bhadla park report higher cumulative capacity across many separate projects. What actually matters for judging any of these plants is not the headline gigawatt figure but the capacity factor, the percentage of that theoretical maximum the plant reliably delivers to the grid across a full year. A smaller, well-sited, tracking-equipped plant can outproduce a larger fixed-tilt one, and increasingly, the plants that matter most are the ones paired with storage that can deliver power after the sun goes down.
Read next:
- The Largest Structures Ever Built
- The Fastest Man-Made Objects Ever Built
- Countries with the Most Data Centers
Frequently Asked Questions
Q: What is the largest solar farm in the world? A: It depends on the definition. By single-site nameplate capacity, the 2 GW Al Dhafra Solar PV plant in Abu Dhabi, UAE, inaugurated in November 2023, holds the strongest claim. By cumulative capacity across a multi-developer zone, China's Golmud Solar Park (~2.8 GW across roughly 80 plants) and India's Bhadla Solar Park (~2.7 GW) rank higher.
Q: Why do different sources rank solar farms differently? A: Sources disagree because they use different definitions of "largest": some count single connected plants, others count multi-developer parks as one combined figure, and capacity figures change as phased projects like Dubai's Mohammed bin Rashid Al Maktoum Solar Park add new blocks over time.
Q: What is the difference between installed capacity and actual output? A: Installed (nameplate) capacity is the maximum power a plant can produce under ideal sunlight conditions. Actual output, measured as capacity factor, is typically 17% to 31% of that maximum over a full year, according to NREL, because of nighttime hours, clouds, panel soiling, and curtailment.
Q: How much electricity does a 2-gigawatt solar farm actually produce? A: At a 25% capacity factor, a reasonable estimate for a strong desert site, a 2 GW plant delivers roughly 4.4 terawatt-hours of electricity per year, equivalent to an average continuous output of about 500 megawatts.
Q: Why are most of the largest solar farms located in deserts? A: Deserts combine abundant direct sunlight, minimal competing land uses, and low land costs, which lets developers build multi-square-kilometer arrays economically. The tradeoff is longer transmission lines to reach population centers and higher water demand for cleaning dust off panels.
Q: What is a bifacial solar panel and why do large plants use them? A: A bifacial panel generates electricity from both its front and back surfaces, capturing sunlight reflected off the ground or a reflective surface beneath the array. Desert sand reflects light efficiently, which is why plants like Al Dhafra use nearly 4 million bifacial panels to boost output beyond what standard single-sided panels would produce.
Q: What is curtailment and how does it affect solar farm rankings? A: Curtailment occurs when a grid operator deliberately reduces a solar plant's output because the grid cannot absorb all the electricity being generated, often around midday. Regions with fast solar buildout but slower transmission investment, including parts of western China, have experienced curtailment that keeps some of the world's largest plants from generating at full nameplate capacity even in ideal sun conditions.
Q: Who owns and finances a project as large as Al Dhafra? A: Al Dhafra is owned by a consortium: Abu Dhabi National Energy Company (TAQA) holds 40%, with Masdar, EDF Renewables, and JinkoPower each holding 20%. Projects at this scale are typically financed through long-term power purchase agreements that guarantee revenue for 20 to 25 years, which gives lenders the certainty needed to fund multi-billion-dollar construction costs.
Q: How is a solar park different from a single solar power plant? A: A solar park, like Bhadla or Pavagada in India, is a government-designated zone where multiple independent developers build and operate separate projects that share land and transmission infrastructure. A single power plant, like Al Dhafra, is built, owned, and operated as one integrated project, even if multiple companies co-invest in it.
Q: What will the next generation of record-setting solar farms look like? A: Future record projects are increasingly likely to pair solar generation with large battery storage systems, since standalone solar capacity has already hit curtailment limits in some regions during peak midday generation. A smaller solar array paired with storage that can shift power into evening demand hours may deliver more usable electricity than a larger array without storage.
Sources
- IEA-PVPS Snapshot 2025 Report — global installed PV capacity data
- NREL Annual Technology Baseline, Utility-Scale PV 2024 — capacity factor ranges
- Lawrence Berkeley National Laboratory, Utility-Scale Solar 2025 Data Update — historical median capacity factor
- PV Tech, Al Dhafra inauguration coverage
- PV magazine, Al Dhafra site profile
- Enerdata, Al Dhafra plant inauguration report
- Wikipedia, Bhadla Solar Park (sourced entry)
- Wikipedia, Pavagada Solar Park (sourced entry)
- Wikipedia, Tengger Desert Solar Park (sourced entry)
- Heatable, Largest Solar Farms in the World 2026
Follow new articles
Add SciHub101 to your feed reader to see new science and technology stories.
About the Author
SciHub101 is an independent science and technology publication founded and edited by Buğra Sözeri, a software engineer and app developer based in Türkiye. AI tools assist with drafting and research. Source documentation in the existing archive is uneven, and articles are being reviewed and corrected. The Editorial Team byline identifies editorial responsibility; it does not certify specialist or independent human review. Where we compare products, anything built by our own team is labelled as such — see the editorial guidelines and About page for how corrections and disclosures work.
Related Articles

Largest Stadiums in the World by Capacity
The world's largest stadiums ranked by capacity: Narendra Modi Stadium, Rungrado, Michigan Stadium and more, plus how capacity is counted and why it shifts.
Largest Ships Ever Built: Tankers, Container Ships, and Floating Cities
The largest ship ever built was a 458-meter supertanker. Compare record-holders by length, tonnage, and cargo capacity, from supertankers to floating LNG plants.
Largest Dams in the World Explained: Height, Volume, and Power
The largest dam changes depending on whether you rank by height, reservoir, concrete volume, or hydroelectric output. Here is the science behind each record.
Countries with the Most Hydropower (Ranked by Installed Capacity)
China leads the world in hydropower with 435.95 GW of installed capacity — more than three times that of second-place Brazil at 110 GW. Hydropower is the world's largest source of renewable electricity, accounting for roughly 40 percent of global renewable generation. This ranking covers the top 15 countries by hydropower installed capacity using IHA and IRENA 2024 data, with methodology, historical context, and caveats about what capacity figures do and do not tell you.
Countries That Produce the Most Solar Power (Ranked)
China installed 278 GW of new solar capacity in 2024 alone — more than the entire installed base of the United States. With 888 GW of total solar PV capacity, China now hosts nearly half of all solar power on Earth. This article ranks the top solar nations by installed capacity and explains how the global solar revolution became so geographically concentrated.
Countries With the Most Renewable Energy Capacity (2025)
China had 1,827 GW of renewable power capacity at the end of 2024, 41% of the world total, per IRENA. See the top 20 countries by installed gigawatts and why capacity is not the same as generation.