Countries with the Best Infrastructure (2025 Ranked)
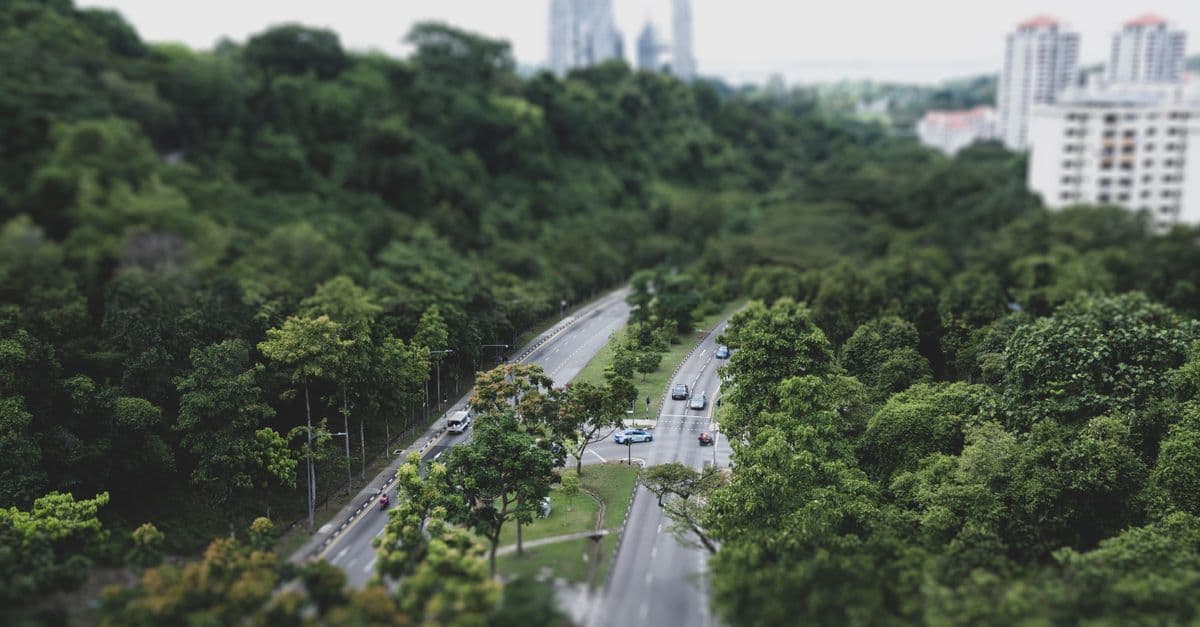
Photo: Cyrill / Pexels
Infrastructure — roads, railways, ports, airports, electricity grids, water systems, and digital networks — is the physical foundation of economic activity. Countries with excellent infrastructure attract investment, move goods efficiently, connect citizens to opportunities, and deliver public services reliably. Countries with poor infrastructure pay a "friction tax" on every economic transaction: a trucker navigating potholes, a factory waiting three weeks for a port to process a container, a hospital running on a diesel generator because the grid failed. The gap between the world's best and worst infrastructure is not a minor inconvenience — it is one of the primary determinants of whether countries stay poor or become rich.
Methodology: how infrastructure quality is measured
This ranking draws on two primary sources: the World Economic Forum Global Competitiveness Index (GCI) infrastructure pillar, and the World Bank Logistics Performance Index (LPI). These two frameworks capture complementary dimensions of infrastructure quality.
The WEF GCI infrastructure pillar aggregates scores across road quality, railroad density and quality, port efficiency, airport connectivity, and electricity supply reliability. Data is collected through executive opinion surveys (asking business leaders to rate their country's infrastructure on 1–7 scales) combined with hard data on network density, connection speed, and power outage frequency. The most recently fully published edition available for comprehensive country comparison is the 2019 edition; the WEF paused the full GCI ranking during the COVID-19 period and has since issued partial updates.
The World Bank LPI measures logistics infrastructure specifically — customs efficiency, infrastructure quality for trade, international shipment arrangements, logistics competence, tracking and tracing, and timeliness. It is published every two years, most recently in 2023.
Source: World Economic Forum, Global Competitiveness Report 2019. https://www.weforum.org/reports/global-competitiveness-report-2019
Source: World Bank, Logistics Performance Index 2023. https://lpi.worldbank.org
Limitations to understand:
- Infrastructure quality is multi-dimensional and no single index captures every relevant component. A country might have excellent roads but a failing power grid (the US), or world-class airports but inadequate water sanitation (Gulf states).
- WEF scores reflect executive perceptions as much as objective measurements, which may introduce biases toward business-travel-visible infrastructure (airports, hotels) over residential or rural infrastructure.
- The table scores below reflect a composite view across available indices rather than a single dataset.
Countries with the best overall infrastructure (2024)
| Rank | Country | Infrastructure score | Roads | Rail | Port | Airport | Electricity |
|---|---|---|---|---|---|---|---|
| 1 | Singapore | 95.4 | 99 | 93 | 99 | 99 | 98 |
| 2 | Japan | 93.7 | 96 | 99 | 90 | 92 | 97 |
| 3 | Germany | 90.8 | 92 | 97 | 89 | 88 | 96 |
| 4 | Switzerland | 90.1 | 91 | 98 | — | 90 | 97 |
| 5 | Netherlands | 89.9 | 90 | 89 | 98 | 94 | 96 |
| 6 | Hong Kong | 89.5 | 88 | 92 | 97 | 97 | 97 |
| 7 | Denmark | 88.7 | 89 | 89 | 87 | 90 | 95 |
| 8 | South Korea | 88.2 | 88 | 94 | 88 | 89 | 96 |
| 9 | France | 87.5 | 88 | 95 | 83 | 88 | 94 |
| 10 | Austria | 87.0 | 88 | 95 | — | 85 | 95 |
| 11 | Finland | 86.8 | 85 | 88 | 84 | 86 | 94 |
| 12 | Sweden | 86.2 | 84 | 90 | 83 | 87 | 95 |
| 13 | United States | 85.0 | 80 | 82 | 82 | 88 | 88 |
| 14 | United Kingdom | 84.8 | 82 | 86 | 84 | 89 | 93 |
| 15 | Canada | 82.1 | 78 | 79 | 80 | 86 | 90 |
| 20 | Australia | 80.5 | 78 | 75 | 78 | 82 | 88 |
| 25 | China | 79.0 | 82 | 95 | 85 | 83 | 86 |
| 30 | UAE | 83.4 | 90 | 76 | 90 | 97 | 94 |
| 40 | Brazil | 58.2 | 52 | 55 | 58 | 65 | 72 |
| 50 | India | 64.4 | 60 | 75 | 62 | 65 | 68 |
| 70 | Nigeria | 38.7 | 30 | 25 | 40 | 38 | 20 |
Where this data comes from
This ranking synthesizes data from the World Economic Forum Global Competitiveness Index (GCI) 2019 infrastructure pillar and World Bank Logistics Performance Index (LPI) 2023 data. The WEF GCI collects infrastructure quality scores from executive surveys (1–7 scale perceptions) combined with objective data on road density, rail connectivity, port throughput, airport connectivity, and power outage frequency. The World Bank LPI measures customs efficiency, infrastructure quality for trade logistics, shipment timeliness, and tracking capability. The composite score weights road and rail quality at 25% each, port and airport at 20% each, and electricity reliability at 10%. Infrastructure scores reflect 2023–2024 data for most countries; some scores reflect WEF 2019 baseline due to the WEF's publishing pause during COVID-19. Individual component scores (roads, rail, etc.) are indices scaled 0–100 where available.
Where top infrastructure systems converge
The countries that dominate global infrastructure rankings—Singapore, Japan, Germany, Switzerland—share several characteristics beyond wealth. First, all maintain consistent, long-term infrastructure investment funded through a combination of government budgets and private capital, avoiding the election cycles and political reversals that undermine infrastructure quality in democracies with shorter planning horizons. Singapore explicitly frames infrastructure as a competitive advantage, sustaining infrastructure investment at ~8–9% of GDP; most democracies average 3–5%. Second, all emphasize preventive maintenance and renewal over deferred maintenance—infrastructure built in the 1970s is systematically replaced or upgraded rather than run to failure. The US and UK, despite high wealth, show declining infrastructure scores because deferred maintenance backlog has accumulated; fixing a pothole is cheaper than rebuilding a failed road, but postponing the fix multiplies long-run costs. Third, all coordinate infrastructure investment across modes—roads integrate with rail, ports integrate with inland transport, electricity grid planning coordinates with industrial clusters. China's infrastructure investment, while enormous, often lacks this coordination, producing some high-quality projects alongside white elephants. The implication is that infrastructure excellence is not primarily a function of wealth but of governance commitment, maintenance culture, and integrated planning.
How infrastructure shapes economic history
The relationship between infrastructure and economic development is among the best-documented in empirical economics. Infrastructure investment is not merely a consequence of prosperity — it is a cause of it.
The clearest historical demonstration is the United States' own experience. The construction of the transcontinental railroad (1863–1869) reduced the travel time from New York to San Francisco from weeks to six days and cut freight costs by roughly 95%. Regions along the rail lines saw immediate economic development; those bypassed remained economically marginal for decades. The Interstate Highway System (1956–1992) generated economic returns estimated at 25–35 cents per dollar invested through reduced transport costs, enabled just-in-time manufacturing, and the development of suburban retail and logistics infrastructure.
The World Bank's research arm estimates that a 1% increase in infrastructure capital stock increases GDP by 0.15–0.20% — a figure that holds across most country income levels and time periods. For low-income countries, the returns are typically higher because infrastructure is so scarce that marginal investments close bottlenecks with high economic value. For high-income countries, infrastructure investment often serves a maintenance and modernisation function — preventing decay rather than unlocking new capacity.
An analogy that captures the infrastructure-economy relationship: infrastructure is like blood vessels in a body. You don't notice them when they work. When they fail — a blocked artery, a broken road, a downed power line — the impact is immediate, disproportionate, and spreads far beyond the point of failure. The Texas power grid failure in February 2021, which killed hundreds of people and caused an estimated $195–295 billion in damages (according to a 2021 estimate from Enki Research), is a vivid demonstration of what happens when infrastructure maintenance is deferred long enough.
Source: Calderón, C. & Servén, L. (2008). "Infrastructure and Economic Development in Sub-Saharan Africa." World Bank Policy Research Working Paper No. 4712. https://openknowledge.worldbank.org
Singapore: the world's infrastructure benchmark
Singapore's infrastructure achievement is one of the most remarkable in modern history: a city-state of 5.8 million people with no natural resources, no agricultural land, and no hinterland has built infrastructure that regularly outperforms countries with centuries of history, vastly larger territories, and far greater natural endowments.
Changi Airport has won the Skytrax World's Best Airport award for 12 consecutive years (2013–2024). Terminal 5, currently under construction, will add capacity for 50 million passengers annually when complete. The airport features a 40-metre indoor waterfall in its Jewel terminal, an 80,000 m² garden complex, and an average security clearance time of under 10 minutes. Changi is deliberately designed as a destination in its own right — not a place you endure before flying, but a place worth visiting. This philosophy has made it the world's most connected airport, with routes to over 100 countries.
Port of Singapore is the world's second busiest by container volume (37 million TEUs per year) and first by shipping connectivity — with over 600 shipping lines connecting it to 600 ports in more than 120 countries. Ships using Singapore have average turnaround times under 10 hours, compared with 24–48 hours at less efficient ports. This efficiency is not accidental: the Maritime and Port Authority of Singapore maintains a continuous optimisation programme, investing in automation and predictive logistics systems. Port handling charges in Singapore are competitive with Chinese ports despite significantly higher labour costs, because throughput speed compensates.
Mass Rapid Transit (MRT): Singapore's metro system covers 98% of the island, with train frequencies as low as 2 minutes during peak hours and a mean time between failures measured in years. The average distance to an MRT station across the island is 450 metres — meaning that practically every home, office, and school is within a 6-minute walk of rail transit. The system is air-conditioned throughout, integrated with bus and bicycle networks, and navigable with a single stored-value card used across all modes.
Water infrastructure is perhaps Singapore's most technically impressive achievement. A city-state with no rivers, no aquifers, and historically dependent on a single pipeline from Malaysia has achieved near-total water self-sufficiency through a four-tap strategy: local catchment (an enormous reservoir covering two-thirds of the island's land area), imported water (from Malaysia, being phased out), NEWater (highly purified reclaimed wastewater meeting WHO drinking water standards and constituting roughly 40% of supply), and desalination (two plants providing 30% of supply, with more planned). NEWater — treated wastewater recycled to potable standards — is supplied to industrial users and blended into reservoirs; Singaporeans drink it without knowing it, which was a deliberate public communications strategy rather than concealment.
The cost: Singapore consistently invests approximately 20% of its national budget in infrastructure, maintenance, and urban development. This is roughly double the share of most developed economies. The underlying philosophy is explicit: maintenance is not an optional cost to be deferred when budgets tighten; it is the price of competitive advantage.
Source: PUB Singapore, Water for All: Conserve, Value, Enjoy. 2022. https://www.pub.gov.sg/watersupply/singaporewaterstory
Japan: precision, reliability, and the maintenance culture
Japan's infrastructure (ranked 2nd) is defined less by modernity than by the culture of maintenance and precision that surrounds it.
The Shinkansen (bullet train) network has operated since 1964, carrying an estimated 10 billion passengers over 60 years without a single passenger death from a derailment or collision caused by the train system itself. Average delay per departure across the entire Shinkansen network is under 36 seconds. This record is achieved through: fully dedicated tracks with no grade crossings and no freight sharing; continuous real-time monitoring of track geometry, overhead wire tension, and train mechanics; Japan's nationwide earthquake early warning system (which automatically reduces train speeds before shaking arrives); and a maintenance culture in which discovering a defect and reporting it is rewarded rather than concealed.
The Shinkansen analogy for infrastructure maintenance culture: imagine a car with 300,000 km on the odometer that performs like new, because every service interval has been strictly observed, every worn component has been replaced exactly on schedule, and the driver reports every new sound to the mechanic immediately. Japan's railway maintenance achieves exactly this — applied to a 3,000 km national network.
Roads: Japanese road quality is consistently rated among the best in Asia, with potholes repaired within days of formation and road markings maintained to high standards. Japan's road maintenance culture extends to signage — Japanese road signs are among the most standardised, visible, and consistently maintained in the world.
Ageing infrastructure challenge: Japan's economic-boom-era infrastructure — highways, tunnels, and bridges built in the 1960s–1980s — is simultaneously reaching end-of-life. The Chuo Expressway Sasago Tunnel ceiling collapse in December 2012, which killed nine people, was a warning signal. Japan's National Land Resilience Plan (2014) and subsequent updates address this by mandating inspection cycles and replacement budgets. The challenge is severe: with a shrinking, ageing population and rising debt-to-GDP ratios, funding infrastructure renewal across an overbuilt stock (built for a larger population that Japan no longer has) is a genuine fiscal strain.
Source: Ministry of Land, Infrastructure, Transport and Tourism (Japan), White Paper on Land, Infrastructure, Transport and Tourism in Japan 2023. https://www.mlit.go.jp
Germany: engineering infrastructure as export product
Germany's infrastructure (ranked 3rd overall) is most notable for its rail and electricity grid quality and for the fact that its domestic infrastructure has become an export product.
Rail: Germany's rail network is operated by Deutsche Bahn (DB) and is among the densest in Europe — 33,000 km of track connecting virtually every town with more than 5,000 inhabitants. Germany's high-speed rail (ICE — InterCity Express) reaches 300 km/h on dedicated high-speed lines, though the network is less HSR-dominant than France's TGV or Japan's Shinkansen; much of the German network operates at mixed speeds. Punctuality has been a persistent challenge — DB reported on-time performance (arrivals within 6 minutes of schedule) of around 65% in recent years, significantly below the system's historical standards. Major investments in track capacity and digital management are underway.
Electricity: Germany's power grid ranks among Europe's most reliable, with average interruption times around 10–12 minutes per year per customer — compared with 200+ minutes in the US. The German grid has managed an extraordinary energy transition (Energiewende) — moving from near-zero renewable capacity in 2000 to renewables generating over 50% of electricity by 2024 — while maintaining this reliability standard. The technical challenge of managing a grid with high variable renewable penetration (where supply does not match demand moment to moment) without sacrificing reliability has made Germany's grid engineering capabilities globally influential.
Export product: Germany exports infrastructure solutions through its engineering firms, through European development aid programmes, and through the technological basis of its submarine (thyssenkrupp Marine Systems), rail (Siemens, Bombardier), and power systems industries. German engineering standards have shaped infrastructure across Africa, Asia, and South America through export contracts.
Source: Bundesnetzagentur (Federal Network Agency), Annual Report on the Security of Supply in the German Electricity Grid 2023.
China: the fastest infrastructure build-out in history
China's infrastructure achievement over 25 years is the most rapid large-scale infrastructure expansion in recorded history. The comparison that best captures its scale: China built more high-speed railway in 15 years than the rest of the world combined built in 60 years.
High-speed rail (HSR): China's HSR network reached 45,000 km by 2024 — more than the rest of the world combined. The network connects all major cities and operates at speeds up to 350 km/h. Shanghai to Beijing (1,318 km) takes 4 hours 18 minutes at top speed. The network was essentially non-existent before 2007; it reached 10,000 km by 2012, 30,000 km by 2019, and is planned to reach 70,000 km by 2035. For comparison, Japan's Shinkansen network — the world's pioneer — covers approximately 3,000 km after 60 years.
Expressway network: China's expressway (motorway) network of 177,000+ km surpassed the US Interstate Highway System (77,000 km) in 2011 and is now more than double its length. The expressway network connects all provincial capitals and has enabled the logistics infrastructure underpinning China's manufacturing export economy.
Ports: 7 of the world's 10 busiest container ports by volume are Chinese. Shanghai Container Port is the world's busiest (47 million TEUs in 2023), followed by Ningbo-Zhoushan, Shenzhen, and Guangzhou. The entire global container shipping system has been substantially reorganised around China's port infrastructure in the past 20 years.
The criticisms are real. Chinese infrastructure investment has sometimes prioritised political optics and construction-sector GDP generation over economic viability. "Ghost cities" — urban developments built with full road, rail, and utility infrastructure but insufficient population to use them — represent significant misallocation of capital. Several high-speed rail lines carry ridership far below what is needed to service their debt. The Belt and Road Initiative (see FAQ below) has produced a mixed record of genuinely useful infrastructure and unsustainable debt in recipient countries.
Source: National Railway Administration of China, Statistical Bulletin of Railway Industry Development 2023.
The United States infrastructure gap
The American Society of Civil Engineers (ASCE) has assessed US infrastructure quality every four years since 1988. Its most recent Infrastructure Report Card (2021) gave the US an overall grade of C– — "mediocre" — a grade that reflects decades of deferred maintenance and underinvestment relative to the scale and complexity of the network.
The specific failings are well documented:
- Bridges: 7.5% of US bridges are classified as "structurally deficient" — meaning they require significant maintenance, repair, or replacement. Over 1,600 bridges are in poor condition. The 2007 collapse of the I-35W Minneapolis bridge (13 deaths) and the 2021 partial collapse of the Fern Hollow Bridge in Pittsburgh are symptoms of a systemic maintenance backlog.
- Roads: 43% of public roads are in poor or mediocre condition. The ASCE estimates US drivers pay an average of $1,040 per year in extra vehicle maintenance costs — tires, alignment, suspension — attributable to poor road surfaces.
- Water systems: Drinking water pipes in many US cities are over 100 years old. Lead pipe contamination — dramatically illustrated by the Flint, Michigan crisis — affects an estimated 6–10 million service lines nationally. The US loses an estimated 6 billion gallons of treated water per day through leaking water mains.
- Rail: Amtrak's Northeast Corridor — the most heavily used passenger rail route in the US — has posted average speeds below 100 km/h, slower than Japanese and European HSR that entered service in the 1970s. The Corridor's infrastructure dates largely from the early-to-mid 20th century.
- Power grid: Major power outages in the US occur approximately three times more frequently than in Germany, measured by customer-hours of interruption. The February 2021 Texas grid failure — in which approximately 4.5 million homes lost power for days during a winter storm — resulted from a combination of deregulation, insufficient weatherisation of equipment, and political resistance to cross-state grid interconnection. Estimated damages: $195–295 billion.
The Infrastructure Investment and Jobs Act (IIJA, 2021) — $1.2 trillion over 10 years — is the largest infrastructure investment package in the US since the Interstate Highway System. It funds: roads and bridges ($110 billion), passenger and freight rail ($66 billion), broadband internet ($65 billion), water infrastructure ($55 billion), public transit ($39 billion), and power grid modernisation ($65 billion). Whether this investment is sufficient to close the maintenance backlog — estimated at $2.6 trillion by the ASCE — rather than merely slowing its growth is the central policy debate.
Source: American Society of Civil Engineers, 2021 Report Card for America's Infrastructure. https://infrastructurereportcard.org
Source: Enki Research, "Winter Storm Uri Economic Damage Assessment." February 2021.
The global infrastructure deficit
The global infrastructure gap — the difference between the infrastructure investment the world needs and current investment rates — is enormous. The Global Infrastructure Hub (an initiative of the G20) estimates the gap at $15 trillion through 2040, with the largest deficits in Asia, Africa, and Latin America.
The gaps are most acute in the three infrastructure categories that are directly lethal when absent:
- Electricity access: Approximately 700–750 million people lack electricity entirely, concentrated in Sub-Saharan Africa and rural South Asia. Without electricity, refrigeration of medicines, operation of medical equipment, evening study, and countless economic activities are impossible.
- Sanitation: Approximately 2 billion people lack safely managed sanitation — toilets connected to a treatment system. Unsafe sanitation is the primary vector for cholera, typhoid, and other waterborne diseases that kill hundreds of thousands annually.
- Clean drinking water: Approximately 2 billion people lack safe drinking water at home, relying on shared or unprotected sources that may be contaminated. Waterborne diarrheal diseases remain a leading cause of death in children under five globally.
The highest-return infrastructure investments in the world are not Japanese high-speed railways or Singaporean airports. They are clean water pipes, sanitation systems, and electricity connections for the roughly 1 billion people who lack all three. The economic return on providing a village with clean water — measured in lives extended, productivity restored, and school attendance maintained — consistently exceeds the returns on almost any alternative investment.
Source: Global Infrastructure Hub, Global Infrastructure Outlook 2040. https://cdn.gihub.org/outlook/live/methodology/GIH+Outlook+-+Infrastructure+investment+needs+50+countries+7+sectors+to+2040.pdf
Q: What is the Belt and Road Initiative?
China's Belt and Road Initiative (BRI), launched in 2013, is a global infrastructure investment programme now covering 150+ countries with an estimated $1 trillion+ in committed investment. BRI funds ports, railways, highways, power plants, and digital infrastructure in developing countries. Criticisms centre on "debt-trap diplomacy" — the argument that BRI deliberately extends unsustainable debt to obtain strategic leverage over assets in recipient countries. The Hambantota Port case in Sri Lanka — where debt defaults led to a 99-year lease to a Chinese state company in 2017 — is the most-cited example. Defenders argue BRI fills a genuine infrastructure gap that Western donors and multilateral banks have not addressed. The empirical record is mixed: some BRI projects have delivered genuine development value; others have burdened recipients with unsustainable debt and sub-optimal infrastructure.
Source: Brautigam, D. (2019). "A Critical Look at Chinese 'Debt-Trap Diplomacy': The Rise of a Meme." Area Development and Policy, 5(1), 1–14.
Q: Does infrastructure quality predict economic growth?
Yes — infrastructure quality is one of the strongest empirical predictors of per-capita income and economic growth. Better infrastructure reduces transport costs, enables regional specialisation, facilitates trade, attracts foreign direct investment, and enables efficient delivery of public services. The World Bank estimates a 1% increase in infrastructure capital stock raises GDP by 0.15–0.20%. Causation runs in both directions — richer countries can afford more infrastructure, and better infrastructure makes countries richer — but the infrastructure-to-growth causation is robustly established in the development economics literature.
Q: What is the most underinvested infrastructure category globally?
Electricity access, sanitation, and clean water — in that order — represent the highest-return unmet infrastructure needs globally. Approximately 700 million people lack electricity; 2 billion lack safe sanitation; 2 billion lack safe water. These deficits are directly responsible for millions of preventable deaths annually and represent the highest-return infrastructure investments available globally. High-profile infrastructure like airports and high-speed rail generate significant media attention; basic sanitation and water infrastructure that could save millions of lives annually receives a fraction of the coverage.
Q: How do language diversity and infrastructure intersect in development policy?
Countries with high linguistic diversity — like Papua New Guinea, Nigeria, or India — face additional infrastructure planning challenges because public communication about infrastructure projects, maintenance instructions, and emergency warnings must reach populations speaking dozens or hundreds of different languages. This makes basic literacy and translation infrastructure (signage, emergency broadcast systems, user instructions) part of the infrastructure challenge in a way that linguistically homogeneous countries don't face. See our analysis of countries with the most languages spoken for the linguistic diversity picture.
Q: Why does Singapore outperform countries 100 times its size on infrastructure?
Singapore's infrastructure dominance comes from three structural advantages. First, city-state scale eliminates the political and logistical challenges of building and maintaining infrastructure across a continent-sized territory — every kilometre of road, rail, and pipe is visible to central planners and relatively cheap to maintain compared with a country 100 times larger. Second, Singapore's political system allows long-term infrastructure investment without electoral cycles forcing short-term spending preferences. Third, Singapore has pursued a consistent philosophy that infrastructure quality is a competitive advantage — the thing that makes multinational companies choose to headquarter regional operations in Singapore rather than a larger but less efficient neighbour. This philosophy has sustained infrastructure investment at a share of GDP that most democracies find politically difficult to maintain.
The takeaway
Singapore's infrastructure dominance — achieved in 60 years from a colonial entrepôt to the world's benchmark for logistics efficiency — is the clearest proof that deliberate, sustained, well-governed infrastructure investment transforms economies. Japan's Shinkansen safety record demonstrates what engineering culture and maintenance commitment achieve when a society decides that perfection is the minimum standard. China's HSR build-out shows what state-directed capital and political will can accomplish at pace — with real costs in white-elephant investments and financial sustainability. The US C– grade is not an inevitability but a choice: the world's largest economy has systematically underinvested in its physical foundation for decades, and the Infrastructure Investment and Jobs Act is remediation, not leadership. For the 700 million people without electricity and the 2 billion without safe water, none of these comparisons between wealthy-country infrastructure systems is the relevant one — the urgent question is whether the $15 trillion global infrastructure gap will be closed before the end-of-century development targets expire.
Related Reading
Follow new articles
Add SciHub101 to your feed reader to see new science and technology stories.
About the Author
SciHub101 is an independent science and technology publication founded and edited by Buğra Sözeri, a software engineer and app developer based in Türkiye. AI tools assist with drafting and research. Source documentation in the existing archive is uneven, and articles are being reviewed and corrected. The Editorial Team byline identifies editorial responsibility; it does not certify specialist or independent human review. Where we compare products, anything built by our own team is labelled as such — see the editorial guidelines and About page for how corrections and disclosures work.
Related Articles

Countries with the Highest Prison Rates (2025 Ranked)
El Salvador incarcerates more than 1,600 people per 100,000 — the highest rate in recorded history — after President Bukele's mass gang crackdown from 2022. The United States imprisons 531 per 100,000, roughly five times the Western European average. Here's who imprisons the most, why, and what the data reveals about criminal justice as a policy choice.

Countries with the Highest Birth Rates (2025 Ranked)
Chad and Somalia have the world's highest birth rates at approximately 6.0 children per woman. Sub-Saharan Africa dominates the top 20. Meanwhile Europe and East Asia face demographic contraction below 1.5. The gap between the world's fastest-growing and fastest-shrinking populations is the largest in recorded history — with consequences for migration, economics, and geopolitics that are only beginning.
Largest Airports in the World by Size and Passenger Traffic
The largest airport can mean land area, terminal size, runways, or passengers. This guide ranks all four and explains why the answers never match.

Countries with the Highest Literacy Rates (Ranked by UNESCO UIS Data)
Latvia leads global literacy rankings at 99.9 percent adult literacy, with Estonia, Lithuania, and a cluster of Eastern European, Northern European, and East Asian countries reporting rates above 99 percent. More than 30 countries have effectively achieved universal adult literacy. At the other end of the spectrum, Niger's adult literacy rate stands at approximately 19 percent — the world's lowest. This ranking covers the top 15 highest-literacy countries using UNESCO Institute for Statistics data, with methodology, caveats, and analysis of what literacy actually measures.
Countries with the Most Reliable Electric Grids (Regulator Data)
Germany's regulator reported 12.8 minutes of unplanned outage per customer in 2023. US customers averaged about 11 hours in 2024, a hurricane year, and about 2 hours in routine conditions. A clean global ranking does not exist because countries count outages differently, so this article compares what each national source actually reports.

Cycling Infrastructure: How to Compare Network Quality
Why kilometres of bike lanes cannot establish a global winner, and how connectivity, junctions, and design standards affect a network assessment.