Extreme Weather and Climate Change: What Science Says
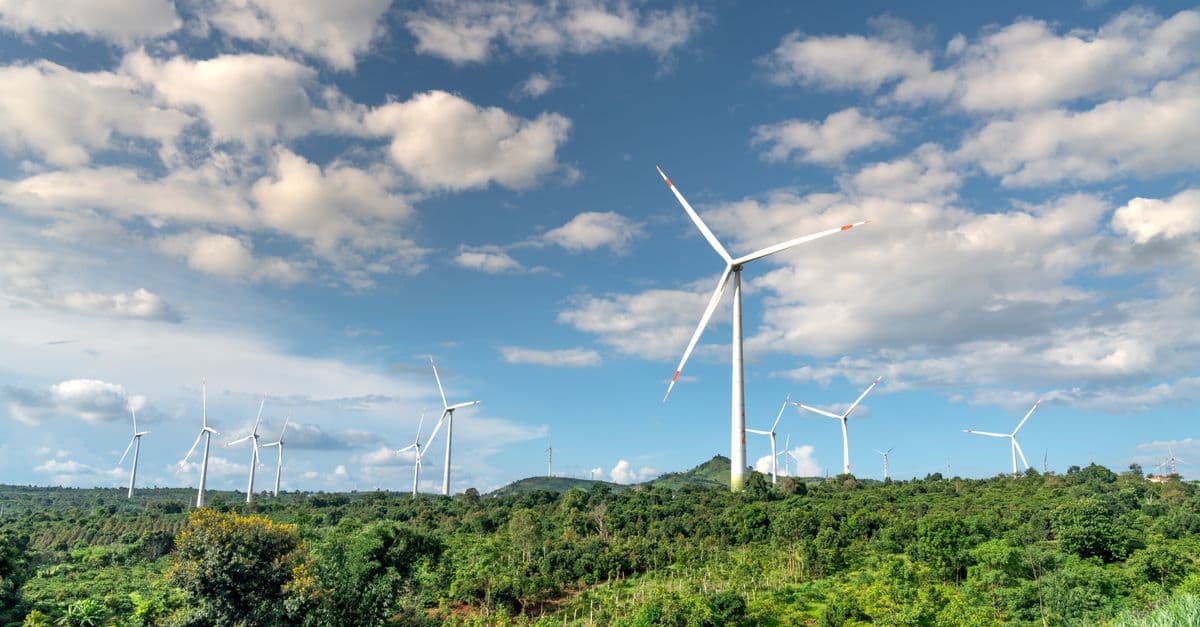
Photo: Quang Nguyen Vinh / Pexels
When a heat wave breaks a national temperature record by several degrees, a wildfire season burns an area larger than most countries, or a storm parks over a city and drops more than a meter of rain, the same question follows within hours: did climate change cause this? The honest scientific answer is more precise than a yes or no. Researchers can now estimate how much human-caused warming changed the probability and the intensity of a specific event, and they publish those estimates with uncertainty ranges attached.
That shift, from talking about trends to talking about individual disasters, matters beyond the lab. Insurers price it, engineers design for it, and governments argue about who should pay for it.
What is attribution science, and what question does it answer?
Attribution science asks a narrow question: would this event have happened without the extra greenhouse gases humans have added to the atmosphere, and if so, would it have been as bad? It does not ask whether climate change "caused" the event in the way a spark causes a fire. Weather still happens through the same physics it always did. What changes is the odds.
The analogy that holds up best is loaded dice. Roll a fair die and a six comes up one time in six. Load the die slightly and sixes come up more often, but you can never point at a single roll and say the weight made it happen. You can, however, roll the die thousands of times and measure how much the weight changed the frequency. Attribution studies do the same thing with the climate, using models in place of the physical dice.
A second way to picture it is a stepladder. A person standing on a stepladder who jumps just as hard as before still reaches higher than a person on the floor. Warming raises the floor under every weather event, so ordinary variability now tops out at a higher peak.
How do researchers compare the real world with a world that never warmed?
The method, developed by research groups and used by World Weather Attribution (WWA), and assessed in the IPCC Sixth Assessment Report (AR6, 2021 and 2022), relies on counterfactual comparison. A counterfactual is a "what if" scenario that did not happen. Because we only have one Earth, scientists have to build the second one in a computer and in the historical record.
The usual workflow has four steps:
- Define the event. The team picks a measurable quantity, such as the hottest daily maximum temperature of the year in a given region, or the heaviest three-day rainfall in a river basin. How the event is defined can change the answer, so this step is argued over.
- Check the observations. Weather station records show how the chosen quantity has behaved over the instrumental period, and whether it is trending.
- Run the models twice. Climate models simulate the actual world, with observed greenhouse gas levels, and a counterfactual world with pre-industrial conditions. Pre-industrial carbon dioxide was about 280 parts per million, against more than 420 today.
- Compare and combine. The probability or intensity of the event in the two worlds is compared, and the observation-based and model-based results are merged into a single statement with a range.
Two numbers come out of the comparison. The probability ratio is the chance of the event in today's climate divided by its chance in the counterfactual climate. The fraction of attributable risk (FAR) expresses the same thing as the share of today's risk that is due to the added warming. If an event has a 1 percent chance per year today and a 0.1 percent chance in the counterfactual world, the probability ratio is 10 and the FAR is 0.9, meaning 90 percent of today's risk is attributable to human influence.
Why do studies report "at least" and ranges instead of a single number?
Because honest uncertainty is part of the result. The Pacific Northwest heat study, for example, gave only a lower bound for the climate change influence, and the Europe flood study reported a likelihood factor spanning 1.2 to 9. A wide range is not a sign that the effect is imaginary. It usually reflects that observed records are short, that models disagree on fine detail, and that very rare events leave little data to work from.
What did the first attribution study find?
The first landmark paper appeared in Nature in 2004. Peter Stott, Dáithí Stone, and Myles Allen examined the European summer of 2003, using a summer-temperature threshold that had been exceeded in 2003 and in no other year since the instrumental record began in 1851. They concluded, with better than 90 percent confidence, that human influence had at least doubled the chance of such a summer (Stott et al., 2004, abstract). Their climate model was coarse, with a grid of roughly 250 km over Europe, so the conclusion applied to large-scale, seasonal-average temperatures rather than to individual city peaks.
The human cost of that summer was later estimated by Robine and colleagues, who compared daily death counts from 16 European countries with a 1998 to 2002 baseline and put the excess deaths at more than 70,000 (Robine et al., 2008). The 2004 paper was a quiet turning point. Science could speak about one disaster, not only about long-term averages.
Why are heat waves the clearest climate signal?
Of all extreme weather types, heat waves carry the strongest attribution signal. The mechanism is simple: a warmer baseline means every heat wave starts from a higher floor. By the time of the 2021 Pacific Northwest event, the global average was already about 1.2 degrees C warmer than in pre-industrial times, so every hot spell started from that raised floor.
The 2021 Pacific Northwest heat dome is the textbook case. At the peak of the heat in late June 2021, Lytton, British Columbia, reached 49.6 degrees C (121.3 degrees F), a new Canadian record. WWA's rapid study, published on July 7, 2021, found the event would have been at least 150 times rarer without human-caused climate change. In today's climate it was roughly a one-in-1,000-year event, and it was about 2 degrees C hotter than it would have been at the start of the industrial era. At 2 degrees C of global warming, the study estimated, such an event would be about another degree hotter and would occur roughly every 5 to 10 years (World Weather Attribution, 2021). The authors stressed that these were conservative lower bounds and that early death estimates of "at least several hundred" were almost certainly an undercount.
The same study that called the heat dome roughly a one-in-1,000-year event in today's climate also found it would have been at least 150 times rarer in a pre-industrial one.
Global numbers tell the same story. According to the Copernicus Climate Change Service, 2024 was the warmest year in records going back to 1850, at 1.60 degrees C above the 1850 to 1900 estimate, and the first calendar year above 1.5 degrees C. The previous record, 2023, was 0.12 degrees C cooler. Copernicus also notes that this does not mean the Paris Agreement limit has been breached, because that limit refers to averages over at least 20 years (Copernicus, 2025).
Climate change also pushes heat waves into regions that urban design makes worse. Paved surfaces and sparse tree cover add several degrees to city temperatures, a layering effect explained in why cities create heat islands.
How does humid heat become lethal?
Temperature alone understates the danger, because the body cools itself by evaporating sweat. The wet-bulb temperature combines heat and humidity into one number: it is what a thermometer reads when wrapped in a wet cloth and exposed to moving air. Around 35 degrees C (95 degrees F) wet-bulb, evaporation can no longer keep core body temperature in check, and serious health effects begin at lower values, near 26 degrees C (NOAA Climate.gov). The physiology behind this is covered in how sweat cools the body.
A 2020 study by Colin Raymond, Tom Matthews, and Radley Horton in Science Advances examined weather station records from 1979 to 2017. It found more than 7,000 instances above 31 degrees C wet-bulb, more than 250 above 33 degrees C, and two stations with multiple daily maximums above 35 degrees C. Most hot spots were coastal, in the Persian Gulf, South Asia, and the Gulf of California. These extremes lasted only one to two hours, and the authors said a lethal exposure would likely need six or more hours without cooling. They also reported that dangerous humid heat has more than doubled in frequency since 1979, arriving earlier than models projected.
That finding is often misread as "the world already has unsurvivable weather." It does not say that. It says the brief, localized crossings of a known physiological limit have started, years before models expected them.
How is climate change changing wildfires?
Wildfires are not caused by climate change the way heat waves are shaped by it. Ignition still needs a spark, and land management, past fire suppression, and where people build all matter enormously. What warming changes is fire weather: the mix of high temperature, low humidity, dry fuel, and strong wind that lets fires start easily, spread quickly, and resist control.
Attribution studies therefore usually target a fire weather index, not the fire itself. Think of it as measuring how dry the kindling is, not who struck the match.
Australia's Black Summer (2019 to 2020). The fires burned roughly 18.6 million hectares, and a WWF-Australia analysis estimated that nearly three billion native animals were within the burned areas, counting those killed or displaced. A World Weather Attribution study led by Geert Jan van Oldenborgh found that climate change had made the extreme fire weather at least 30 percent more likely, with a week of heat like December 2019's about ten times more likely than in 1900. Van Oldenborgh called the 30 percent a floor, and the team could not link the record-low 2019 rainfall to climate change directly, which means the real increase could be higher (University of Oxford summary).
Canada's 2023 season. The Canadian Interagency Forest Fire Centre counted 17,203,625 hectares burned, which is more than twice the previous record of 7,597,266 hectares set in 1989. Other mapping, such as NASA's, put the figure near 18.4 million hectares, and the final number can shift as maps are refined (Parks Canada bulletin). Two cautions apply here. First, the area burned also depends on forest age, past suppression, and fuel loads, so a single season cannot be pinned on warming alone. Second, fire weather is a better target for attribution than burned area for exactly that reason. The honest summary is that warming reliably loads the conditions, and people and ecology decide how many of those conditions turn into large fires.
Why does a warmer atmosphere deliver heavier rain?
Warm air holds more water vapor, about 7 percent more for every 1 degree C of warming, a relationship known as the Clausius-Clapeyron relation. More vapor means that when a storm system does rain, it has more to release. Warming also shifts where and when rain falls, which is why the same planet can show more drought in one region and record floods in another.
Analogy: a warmer atmosphere is a bigger sponge. It does not decide when you squeeze it, but when you do, more water comes out.
What did attribution find for Hurricane Harvey?
Harvey stalled over Texas in August 2017. The National Hurricane Center recorded a maximum storm total of 60.58 inches (about 1,539 mm) near Nederland, Texas, the highest in U.S. tropical cyclone records, and estimated damage at $125 billion, with a 90 percent confidence range of $90 billion to $160 billion. The van Oldenborgh team's study in Environmental Research Letters found that global warming made the rainfall about 15 percent more intense (range 8 to 19 percent) and about three times more likely (range 1.5 to 5). They described the highest observed three-day total at Baytown as a return period of more than 9,000 years (KNMI publication record).
What about the 2021 floods in Western Europe?
In mid-July 2021, slow-moving low pressure brought extreme rain to Germany and Belgium. WWA estimated that climate change raised the likelihood of this kind of rainfall by a factor of 1.2 to 9 and increased the intensity of one-day summer maximum rainfall by about 3 to 19 percent, compared with a climate 1.2 degrees C cooler. At least 184 people died in Germany and 38 in Belgium. The study's authors were candid about limits: local trends are hard to detect through natural variability, some river-monitoring equipment was destroyed, and the observation-based changes were larger than those simulated by the models (World Weather Attribution, 2021).
What happened in Pakistan in 2022?
The 2022 monsoon floods in Pakistan were a case where climate and vulnerability collided. WWA found that human-caused warming likely increased the heaviest five-day rainfall in the hardest-hit areas by up to about 50 percent. Sindh and Balochistan received 726 percent and 590 percent of their normal August rainfall, respectively, and the study authors said societal vulnerability was probably the biggest factor in the humanitarian disaster (WMO summary).
The three cases show a consistent pattern in how the studies read:
| Event | Year | Climate change effect reported | Source of caveat |
|---|---|---|---|
| Hurricane Harvey rainfall | 2017 | About 15% more intense; about 3 times more likely | Return period more than 9,000 years at Baytown |
| Western Europe floods | 2021 | 3 to 19% more intense; 1.2 to 9 times more likely | Observations and models disagree on size |
| Pakistan monsoon rainfall | 2022 | Up to about 50% heavier five-day peak in worst-hit areas | Large uncertainty; vulnerability dominated losses |
Are hurricanes getting more frequent or more intense?
This is where the picture is more mixed than for heat. Research does not clearly show an increase in the total number of tropical cyclones worldwide. What the thermodynamics favor is a change in character. A warmer ocean surface supplies more energy, so the share of storms reaching the top categories rises, and storms can strengthen faster.
The main changes scientists discuss are:
- More intense storms as a share of the total. The proportion reaching Category 4 and 5 is expected to rise under continued warming, a conclusion the IPCC AR6 reports with high confidence.
- Faster intensification. A storm whose winds jump by 35 mph (about 55 km/h) or more in 24 hours is said to undergo rapid intensification, and it leaves coastal communities less time to prepare.
- Slower movement. A storm that lingers drops more rain on one place, as Harvey did.
- Heavier rain per storm. The Clausius-Clapeyron effect applies here as well.
Total frequency depends on other ingredients, such as wind shear, which can tear a forming storm apart. Warm water is a necessary ingredient, not a guarantee. The formation physics is laid out in how hurricanes form, and a parallel treatment from the atmospheric side sits in cyclone science.
Is the American West drought really worse because of warming?
Drought is complicated because it comes in several forms: a lack of rain (meteorological), a soil moisture deficit (agricultural), and low river flow (hydrological). In the southwestern United States, the picture is unusually clear because tree rings give a 1,200-year record to compare against.
A 2022 study in Nature Climate Change by Park Williams and colleagues found that 2000 to 2021 was the driest 22-year period in the region since at least the year 800, surpassing a late-1500s megadrought. They attributed about 42 percent of the soil moisture deficit since 2000 to human-caused warming, mostly through greater evaporation from soil and plants rather than less rain. (UCLA summary).
That result illustrates a pattern: warming rarely creates a drought from nothing. It takes a dry spell that natural variability would have produced anyway and makes it drier, longer, and harder on rivers and crops. The wider consequences for supply are covered in water scarcity.
How do the extreme weather types compare?
| Weather event type | Climate change link | Confidence | Key mechanism |
|---|---|---|---|
| Heat waves | Very strong; both probability and intensity increased | Very high | Warmer baseline shifts the whole temperature distribution |
| Wildfire (fire weather) | Strong for fire weather; weaker for area burned | High for weather, lower for area | Heat, drought, low humidity, and fuel dryness |
| Extreme rainfall | Strong; heavier events more frequent | High | More atmospheric moisture (Clausius-Clapeyron) |
| Tropical cyclone intensity | Moderate to strong for the share of intense storms | High for intensity, low for frequency | Warmer ocean surface and more moisture |
| Heat-driven drought | Strong in mid-latitudes | High | Increased evaporation from soil and plants |
| River flooding | Moderate; depends on watershed and season | Medium to high | Heavier rain, snowmelt timing, land use |
| Tornadoes | Weak; attribution very difficult | Low | Small-scale dynamics models cannot resolve |
| Cold snaps | Complex; overall cold extremes decline | Low to medium | Jet stream and polar vortex behavior contested |
Which events resist attribution, and why?
Not every weather type can be attributed with confidence, and the gaps are worth knowing about because they show where the method stops.
Tornadoes are small, short-lived, and depend on wind shear and instability patterns that global climate models do not resolve. No clear trend in total tornado activity has been established, and attribution studies for individual tornado outbreaks are rare. The ingredients are laid out in how tornadoes form.
Cold snaps are a different puzzle. Cold extremes are declining overall, as expected in a warming world. Some research proposes that rapid Arctic warming, which has run at roughly four times the global rate over 1979 to 2021 according to a 2022 study by Mika Rantanen and colleagues (University of Eastern Finland), may disturb the polar vortex and occasionally push cold air south. This hypothesis remains contested, and the evidence for it is weaker than for the other hazards in the table.
Attribution also struggles when the event is a compound of several factors, for example a storm surge arriving during high tide and heavy river flow. IPCC AR6 describes rising compound flood risk for coastal cities. Damage in such cases grows faster than the sum of the parts, but the statistics for rare combinations are thin.
What do critics get right about attribution studies?
A careful reader should hear the criticisms, because several are fair.
- Event definition matters. Choose a different region, season, or threshold and the probability ratio changes. Good studies justify the choice in advance, but critics note that selection can still lead to "interesting" definitions being published.
- Fast studies get less scrutiny. Rapid analyses are released within weeks and build on previously published, peer-reviewed methods, as the Pacific Northwest study states, but the specific application has had less review than a journal paper.
- Models can disagree with observations. In the European flood study, the observed increases exceeded the modeled ones. When that happens the researchers have to explain the gap, and sometimes they cannot.
- Selection bias. Studies tend to cover events that already made headlines, which skews the sample toward disasters in wealthy or media-rich regions and under-samples poorer places.
- Lower bounds feel like understatement. A conservative figure is a defensible way to avoid overclaiming, but it can sound weaker than the underlying evidence.
None of these objections undo the central finding for heat waves and heavy rain. They are the reason that well-run studies attach ranges, publish methods, and rank their own confidence.
What does the 1.5 degree C versus 2 degree C difference change?
The IPCC AR6 defines a 10-year hot extreme as a daily maximum temperature over land that was exceeded on average once in a decade during 1850 to 1900. It then asks how often such an event occurs at higher warming levels. The answer rises at every step, and rises faster for the rarer extremes. The Pacific Northwest numbers show the principle in miniature: the same heat dome shifts from roughly a one-in-1,000-year event today to something expected every 5 to 10 years at 2 degrees C of global warming.
For mitigation, this is the quantitative case that half a degree is not a small difference. For adaptation, it tells planners where risk is growing fastest. Flood defenses and building codes designed around twentieth-century extremes are already undersized in many places, and reservoirs, crop systems, and power grids are all calibrated to a climate that no longer exists.
Who pays when extreme weather causes damage?
The IPCC AR6 Working Group II report documents rising human and economic costs of climate-linked extremes, concentrated in regions with the lowest historical emissions: Sub-Saharan Africa, South and Southeast Asia, and small island states. A look at which countries carry the highest exposure appears in the most vulnerable countries, and the emissions side of the ledger is in the countries with the highest CO2 emissions.
The international response is the loss and damage framework. Governments agreed at COP27 in 2022 to establish a dedicated fund, and the fund was made operational on the first day of COP28 in 2023, with the World Bank named interim host for four years. Pledges at launch reached hundreds of millions of dollars, which commentators noted was far short of the billions needed (Down To Earth). Pledge totals differed between reports at the time, so check the fund's own documents for current figures.
Attribution matters here because it turns a vague claim ("climate change made this worse") into a number that can be argued over. It does not, on its own, settle legal responsibility. Scientific attribution and legal causation use different tests, and how far courts will rely on attribution studies is unsettled.
What do people get wrong about extreme weather and climate?
"A cold winter disproves warming." Weather is a single roll of the dice, and climate is the weight on it. A cold week in one region says nothing about the global mean, which is calculated across all places and seasons.
"Extreme weather has always happened." True, and attribution science agrees. The question is whether the odds shifted. A drought that would have occurred once per century and now occurs once per decade is the same kind of event, but a very different planning problem. For the evidence-handling side of this debate, see why the "hoax" claim does not hold up.
"Every disaster is now caused by climate change." Also wrong. Exposure, building practice, warning systems, and poverty usually shape the human toll more than the meteorology does, as the Pakistan floods showed. Attribution results are specific to an event and a definition.
"Attribution is just correlation." Correlation alone cannot separate a trend from natural cycles. Attribution adds a physical model of how the system works and tests it against a counterfactual, which is closer to an experiment. The distinction between the two is explained in how correlation differs from causation.
The takeaway
The most useful way to hold this subject is as a change in odds, with an unevenly strong evidence base. For heat waves the shift is large, directly measurable, and now routine to quantify within days. For heavy rain and fire weather the effect is clear but wider in its uncertainty. For tropical cyclones it shows up in intensity and rainfall more than in count, and for tornadoes the tools cannot yet say. What the field has gained since 2004 is not certainty but calibration: a way of saying how much, how sure, and where the method runs out. The wider physical context is in how climate change works, the energy shift that limits further risk is described in solar and wind power, and the broader Earth-system picture sits in the science hub.
FAQs
Q: Does climate change directly cause extreme weather events? A: Climate change does not "cause" an event the way a spark causes a fire. It shifts the probability and severity of events that the atmosphere would produce anyway. A heat wave that might have been a one-in-a-century event in a pre-industrial climate can become far more common. The same atmospheric processes operate as always, but the dice are loaded.
Q: How quickly can scientists attribute a weather event to climate change? A: World Weather Attribution published its Pacific Northwest heat study on July 7, 2021, about one to two weeks after the peak of the event. Rapid studies build on methods that were peer reviewed beforehand, but the specific analysis has had less scrutiny than a journal paper. Studies that go through full peer review take longer.
Q: Are all regions equally affected by more extreme weather? A: No. The Arctic has warmed roughly four times faster than the global average over 1979 to 2021, and coastal and low-income regions often face the largest losses relative to their ability to adapt. Some hazards, such as humid heat, concentrate in particular places, including coastal South Asia and the Persian Gulf.
Q: Why haven't there been more Atlantic hurricanes if the ocean is warmer? A: Warm water is a necessary ingredient for tropical cyclones but not the only one. Wind shear and atmospheric stability also control whether a storm forms and survives. Research points to a shift toward more intense storms and heavier rainfall, not necessarily a higher count.
Q: Can attribution science be used in court? A: Attribution results are quantitative evidence, but legal causation and scientific attribution use different standards. A study can show that an event was far more likely because of warming without establishing who is liable. How courts treat this kind of evidence is still developing.
Q: How reliable are the climate models used in attribution studies? A: Models are tested against historical observations before use, and they are most trustworthy for large-scale heat, rainfall, and drought. They are weaker for small-scale events such as tornadoes. Studies report ranges, and when models and observations disagree, as in the 2021 European floods, good studies say so.
Q: What can governments do given these risks? A: Cutting greenhouse gas emissions limits how much worse the odds get, and adaptation reduces the harm from risks already locked in. Adaptation measures include heat early warning systems, flood-resilient infrastructure, and drought-tolerant agriculture. These are complements, not alternatives.
Sources
- Stott, P.A., Stone, D.A., and Allen, M.R. (2004). Human contribution to the European heatwave of 2003. Nature, 432, 610-614. Abstract at ideas.repec.org.
- Robine, J.M., et al. (2008). Death toll exceeded 70,000 in Europe during the summer of 2003. Comptes Rendus Biologies, 331(2), 171-178. Journal page.
- World Weather Attribution (2021). Western North American extreme heat virtually impossible without human-caused climate change.
- World Weather Attribution (2021). Heavy rainfall which led to severe flooding in Western Europe made more likely by climate change.
- van Oldenborgh, G.J., et al. (2017). Attribution of extreme rainfall from Hurricane Harvey, August 2017. Environmental Research Letters, 12, 124009. KNMI record.
- Raymond, C., Matthews, T., and Horton, R.M. (2020). The emergence of heat and humidity too severe for human tolerance. Science Advances, 6(19), eaaw1838. Summary at NOAA Climate.gov.
- Williams, A.P., et al. (2022). Rapid intensification of the emerging southwestern North American megadrought in 2020-2021. Nature Climate Change, 12, 232-234. Summary at UCLA.
- Rantanen, M., et al. (2022). The Arctic has warmed nearly four times faster than the globe since 1979. Communications Earth & Environment, 3, 168. University of Eastern Finland.
- Copernicus Climate Change Service. Copernicus: 2024 is the first year to exceed 1.5 degrees C above pre-industrial level.
- University of Oxford. Australia's bushfires made 30% more likely by climate change.
- World Meteorological Organization. Climate change likely increased intense rainfall in Pakistan.
- Parks Canada. 2023's record breaking fire season.
- IPCC Sixth Assessment Report, Working Group I (2021) and Working Group II (2022).
Follow new articles
Add SciHub101 to your feed reader to see new science and technology stories.
About the Author
SciHub101 is an independent science and technology publication founded and edited by Buğra Sözeri, a software engineer and app developer based in Türkiye. AI tools assist with drafting and research. Source documentation in the existing archive is uneven, and articles are being reviewed and corrected. The Editorial Team byline identifies editorial responsibility; it does not certify specialist or independent human review. Where we compare products, anything built by our own team is labelled as such — see the editorial guidelines and About page for how corrections and disclosures work.
Related Articles
Climate Change Science: How It Actually Works
From the greenhouse effect to tipping points — the peer-reviewed science behind climate change, carbon budgets, feedbacks, and 2100 scenarios.
How Solar Panels Actually Work: From Photon to Grid (2026)
A deep-dive into the full physics of solar energy — the photovoltaic effect, silicon p-n junctions, Shockley-Queisser efficiency limits, perovskite tandem cells, inverters, and the real economics of solar in 2026.
Climate Change Explained — The Science, Causes, and Consequences
Climate change is happening, it's caused mainly by human emissions, and the evidence comes from thousands of independent measurements. Here's the science, the consequences, and the realistic path forward.
How Wildfires Spread — The Physics Behind the Flames
Wildfires spread through three heat-transfer mechanisms — radiation, convection, and conduction — turbocharged by wind, dry fuel, and a fire's own self-generated weather. Understanding the physics explains why modern wildfires outrun every suppression strategy thrown at them.
Complete Sustainability Guide 2026 — Climate, Energy, and Conservation
The complete guide to sustainability in 2026: renewable energy, climate science, circular economy, conservation strategies, and actionable steps to reduce your impact.
How Climate Change Is Affecting Your Daily Life
Climate change is not a future event that will arrive later. It is already changing the price of your coffee, the length of your allergy season, the cost of your home insurance, the availability of water in your tap, and the heat outside your window. The effects are measurable, attributed to specific climate mechanisms by peer-reviewed science, and accumulating across every aspect of daily life in 2026. This article maps the concrete pathways — with numbers — from global warming to your daily experience.