How Solar Panels Actually Work: From Photon to Grid (2026)
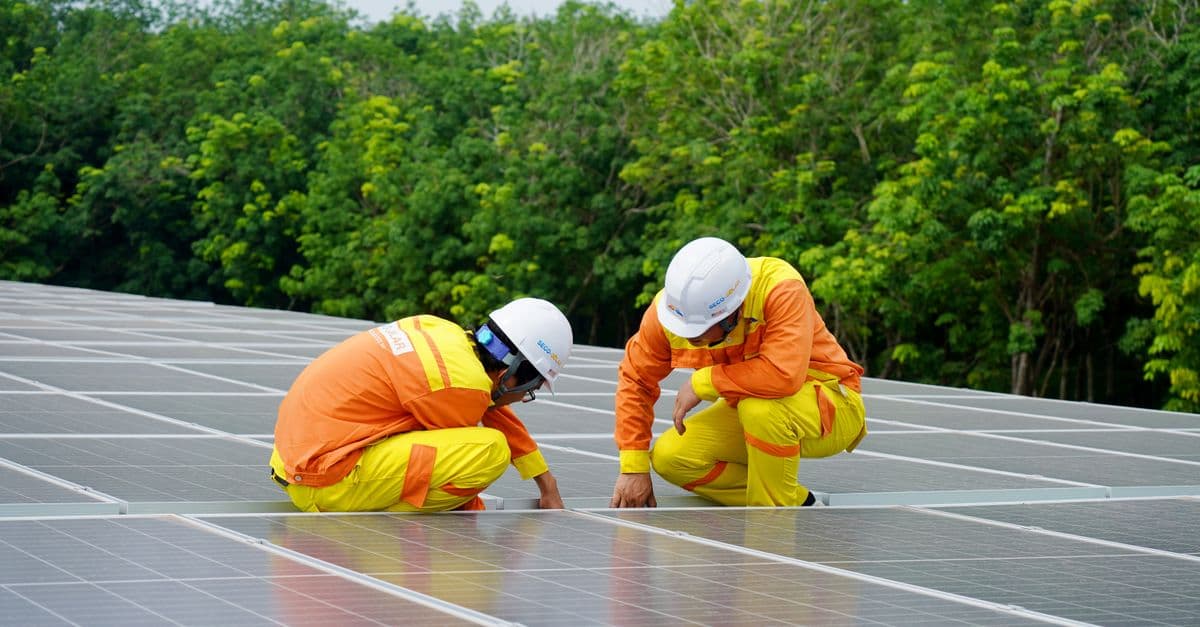
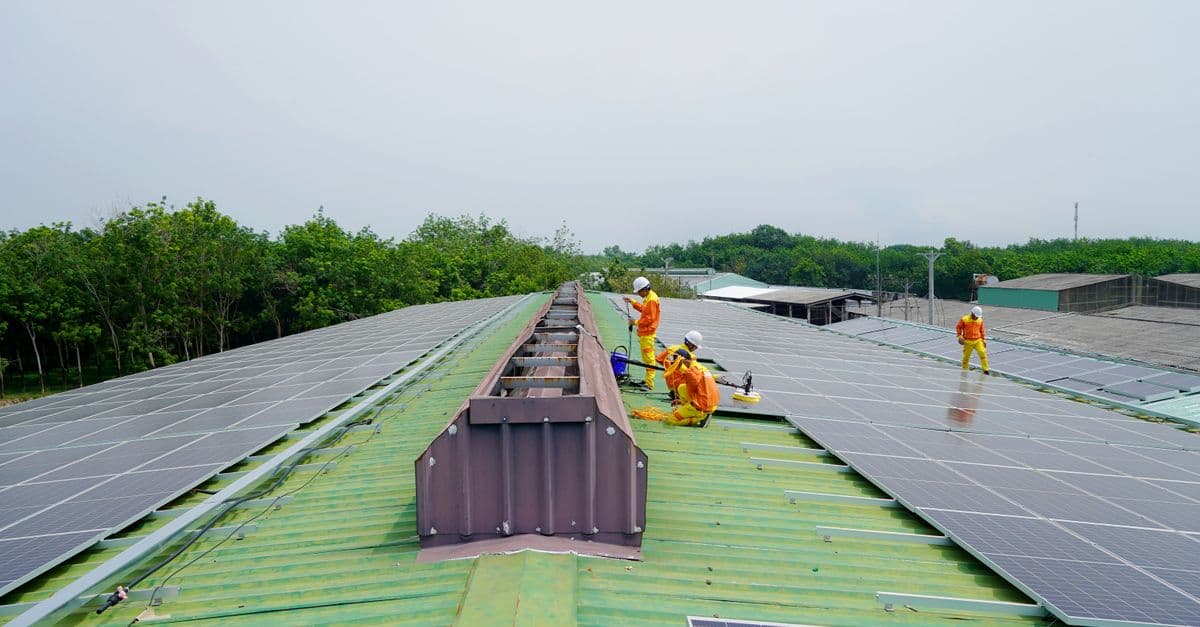
Photo: Trinh Trần / Pexels
A single silicon solar cell converts sunlight into electricity through a quantum mechanical process that Einstein described in 1905 — yet most explanations stop at "sunlight hits the panel and makes electricity." The full story is richer: it involves semiconductor physics, thermodynamic limits, material science breakthroughs, and a grid-integration challenge that is reshaping electricity markets worldwide. This article covers every layer, from the photon arriving at the panel surface to the kilowatt-hour appearing on your electricity meter.
What Is the Photovoltaic Effect?
The photovoltaic effect is the generation of voltage and electric current in a material when it absorbs photons. Albert Einstein won the 1921 Nobel Prize not for relativity but for explaining this effect: photons carry discrete packets of energy (E = hf, where h is Planck's constant and f is frequency), and when a photon's energy exceeds the binding energy of an electron in a semiconductor, it ejects that electron, creating a mobile charge carrier.
In a solar cell, this ejected electron must be directed — not just freed — to produce useful current. That directional push comes from the p-n junction.
Silicon Doping and the p-n Junction
Pure (intrinsic) silicon has four valence electrons and forms a crystal lattice. It conducts electricity poorly at room temperature. To make it useful for solar cells, manufacturers introduce impurities in a process called doping.
n-type silicon is doped with phosphorus (five valence electrons). The extra electron is loosely held and free to move — n-type has an excess of negative charge carriers.
p-type silicon is doped with boron (three valence electrons). The missing electron creates a "hole" — a mobile positive charge carrier.
When p-type and n-type silicon are joined, electrons from the n-side diffuse into the p-side and holes diffuse the other way. This diffusion creates a depletion region at the junction — an area swept clean of free carriers — and establishes a built-in electric field pointing from n to p.
When light generates an electron-hole pair inside or near this depletion region, the built-in electric field separates them instantly: electrons are swept toward the n-side, holes toward the p-side. Connect a wire and load between the two sides, and you have direct current.
This is the essential mechanism of every silicon solar cell made since Bell Labs demonstrated the first practical cell in 1954.
From Cell to Module to Array
A single 6-inch silicon cell produces roughly 0.5–0.6 V and 8–10 A under standard test conditions (1,000 W/m² irradiance, 25°C cell temperature). That is about 4–6 W per cell.
Practical solar panels ("modules") wire 60–72 cells in series to produce 30–40 V and 8–10 A, yielding 300–400 W per panel at standard conditions. An array of panels feeds a string inverter or multiple micro-inverters.
The packaging layers matter enormously for longevity:
- Front glass: low-iron tempered glass, anti-reflective coated, transmits >92% of visible and near-infrared light
- Encapsulant: ethylene-vinyl acetate (EVA) bonding layer, optically clear, protects against moisture
- Cell layer: the silicon wafers
- Back sheet: polymer layer (or glass for bifacial panels) providing electrical insulation and moisture barrier
- Aluminum frame: structural support
Modern panels carry 25–30 year product warranties and are designed to retain >80% of original output after 25 years.
The Shockley-Queisser Efficiency Limit
In 1961, William Shockley and Hans Queisser derived a fundamental thermodynamic limit on how efficient a single-junction solar cell can ever be. The result — approximately 33.7% for silicon under unconcentrated AM1.5 sunlight — arises from two unavoidable losses:
- Sub-bandgap photons: Photons with energy below silicon's bandgap (1.12 eV) pass straight through. They carry about 23% of incident solar energy.
- Thermalization losses: Photons with energy well above the bandgap eject high-energy electrons, but those electrons rapidly lose their excess energy as heat (phonons), settling to the bandgap energy level. This wastes roughly 33% of incident solar energy.
Additional losses include radiative recombination (unavoidable), surface reflection, and electrical resistance. In practice, commercial monocrystalline silicon cells reach 22–24%, and laboratory records sit at 26.8%.
The Shockley-Queisser limit explains why the industry has pursued multi-junction strategies — using multiple materials tuned to different parts of the solar spectrum.
Solar Cell Types and Their Efficiencies
| Cell Type | Typical Commercial Efficiency | Lab Record | Key Advantage | Key Limitation |
|---|---|---|---|---|
| Monocrystalline silicon (PERC/TOPCon) | 21–24% | 26.8% | Mature supply chain, high efficiency | Energy-intensive manufacturing |
| Polycrystalline silicon | 17–19% | 22.3% | Lower cost | Lower efficiency, temperature sensitivity |
| CIGS (copper indium gallium selenide) | 17–21% | 23.4% | Thin film, flexible substrates | Indium scarcity |
| CdTe (cadmium telluride) | 18–22% | 22.1% | Low cost at scale (First Solar) | Cadmium toxicity concerns |
| Perovskite (single junction) | 18–22% | 26.1% | Fast, cheap deposition | Stability and lead content |
| Perovskite-silicon tandem | 28–31% | 33.9% | Exceeds silicon SQ limit | Manufacturing yield, durability |
| III-V multi-junction (concentrator) | 35–40% | 47.6% | Highest efficiency | Very high cost, requires tracking |
Why Silicon: The Band-Gap Sweet Spot
Silicon's dominance in solar cells is not accidental — it comes down to a number: 1.12 eV (electron-volts), the energy required to free an electron from silicon's crystal lattice. That is its bandgap, and it happens to sit close to where the solar spectrum delivers the most useful energy.
The sun's photons arrive at Earth's surface with a wide range of energies. Infrared photons carry less than 1.1 eV; visible and ultraviolet photons carry 1.8–4.0 eV. A semiconductor with a bandgap too low absorbs almost everything but wastes most photon energy as heat (thermalization). One with a bandgap too high passes most photons straight through. The Shockley-Queisser analysis shows the single-junction optimum is approximately 1.34 eV under the standard AM1.5G solar spectrum — which yields a theoretical maximum efficiency of 33.7%. Silicon at 1.12 eV is slightly below that optimum, giving a silicon-specific limit of roughly 32%, but it is close enough that silicon captures the bulk of the spectrum's power-dense visible and near-infrared band.
The consequence is quantified in the lab: LONGi's record for a monocrystalline silicon heterojunction cell is 26.81%, validated by Germany's Institute for Solar Energy Research (ISFH) and confirmed on the NREL Best Research-Cell Efficiency chart. Silicon can reach within roughly 5 percentage points of its theoretical ceiling. Closing that remaining gap through better contact passivation is the frontier for silicon-only cells.
A tandem cell is the only path to go significantly higher. By stacking two materials — perovskite on top (wider bandgap, ~1.7 eV) and silicon below (1.12 eV) — each photon is absorbed by its best-matched sub-cell. Theoretical efficiency limits for two-junction tandems under unconcentrated sunlight exceed 45%, which is why the entire high-efficiency solar R&D community has converged on this architecture.
Perovskite Tandem Cells: The 2026 Breakthrough Frontier
Perovskite solar cells use a crystal structure with the formula ABX₃ (typically methylammonium lead iodide, CH₃NH₃PbI₃). Their bandgap is tunable by composition — a critical advantage — and they can be deposited from liquid solution onto almost any substrate, making manufacturing radically cheaper than silicon wafer production.
The key insight for exceeding the Shockley-Queisser limit is tandem architecture: stack a perovskite top cell (wider bandgap, ~1.7 eV, absorbs blue/green light) on a silicon bottom cell (1.12 eV, absorbs red/near-infrared). Each photon is captured by whichever sub-cell it is best matched to, recovering thermalization losses.
In 2023, KAUST achieved 33.9% efficiency with a perovskite-silicon tandem — the first time any silicon-based technology exceeded 33%. By 2026, several manufacturers including LONGi, Oxford PV, and REC Group have entered pilot production of tandem modules with 28–31% commercial efficiencies.
Stability is the central unsolved challenge. Perovskite degrades under moisture, oxygen, heat, and prolonged UV exposure through a cascade of mechanisms: ion migration within the crystal, decomposition of the organic cation at the grain boundaries, and ingress of water that converts the perovskite back to its precursor salts. Real-world outdoor data is accumulating slowly because the technology is young. Oxford PV reports that their commercial tandem cells lose approximately 1% of efficiency in the first year of outdoor operation, with a smaller rate of decline thereafter, and the company targets a 20-year rated lifetime for its modules by 2028. However, the silicon-industry benchmark is a 25–30 year warranty, and perovskite has not yet matched that bar with field data.
The commercial milestone arrived in September 2024 when Oxford PV shipped the world's first commercial perovskite-silicon tandem modules to a utility-scale installation in the United States. The 72-cell panels achieved 24.5% module efficiency — substantially above commodity silicon — produced at Oxford PV's megawatt-scale pilot line in Brandenburg an der Havel, Germany. This makes Oxford PV the first company to sell perovskite-based solar panels into a real power project, a proof-of-concept that the technology can survive manufacturing yield and field deployment.
Lead content remains the other sticking point. The most efficient perovskites use lead as the "B" site cation; tin-based alternatives have been demonstrated but remain less efficient and less stable. End-of-life recovery and encapsulation to prevent lead leaching will need to be addressed at industrial scale, especially under regulations like the EU's RoHS directive.
The path to >30% at commercial scale runs through tandems. The physics is proven. The engineering — encapsulation chemistry that survives 25 years of thermal cycling, moisture ingress, and UV, plus a manufacturing process that hits acceptable yield at gigawatt scale — is the remaining work.
How a Residential Install Actually Flows
Reading about photovoltaic physics is one thing; understanding what actually happens from the day you sign a contract to the day your meter runs backward is another. The full process takes 60–120 days in most US jurisdictions, though the physical installation itself occupies only 1–3 days.
Site assessment and system design (weeks 1–2): A certified installer evaluates roof orientation, pitch, shading from trees or adjacent structures, and available area. South-facing roofs at 20–35° tilt in the US produce the most annual energy, but east/west splits are common in practice and lose only 15–20% compared to due-south optimal. The installer models your annual load against irradiance data (typically from NREL's PVWatts calculator) to determine string configuration — how many panels are wired in series per string — and selects an inverter sized for that configuration.
Permitting (weeks 2–6): Before any hardware goes on the roof, the installer files building and electrical permit applications with the local Authority Having Jurisdiction (AHJ), typically the city or county building department. Permit drawings must show panel layout, structural attachment details, and one-line electrical diagrams. In most US jurisdictions permit approval takes 15–30 business days, though some have streamlined this to 48–72 hours under SolarApp+ or similar programs.
Installation (1–3 days on site): Mounting rails are lag-bolted through the roof sheathing into rafters. Panels clip to the rails. DC wiring runs to a combiner box (for string configurations) or directly to micro-inverters. The inverter is mounted near the main electrical panel and connects to a new dedicated circuit breaker. A production meter or monitoring gateway is installed alongside the inverter.
Interconnection and net metering (weeks 6–10): The utility must inspect and approve grid connection before the system can be turned on. An interconnection application documents system size, inverter specifications, and anti-islanding protection. Upon approval, the utility installs a net meter — a bidirectional meter that records both energy consumed from the grid and energy exported to it. Net metering policy determines the credit rate for excess generation: most US states credit at the retail electricity rate, meaning a kWh exported is worth the same as a kWh imported.
Final inspection and commissioning: A utility or local inspector makes a final site visit, the system receives permission to operate (PTO), and the installer activates the inverter. The homeowner gains access to a monitoring app showing real-time and historical production. Most modern inverters update data every 5–15 minutes and can flag performance drops indicating a shaded or failed panel.
The soft costs surrounding this process — permitting fees, installer overhead, interconnection application fees, and financing — now represent roughly 75% of a US residential system's installed cost. The panel hardware itself is approximately 25%. This is why policy simplification (automated permitting, standardized interconnection) delivers faster cost reduction than panel efficiency improvements at this point in the technology's maturity.
Inverters: The Bridge to AC Power
Solar panels produce direct current. Almost everything on the electricity grid — and in most homes — runs on alternating current. The inverter is the device that makes the conversion.
Modern string inverters achieve 97–99% conversion efficiency. They also perform:
- Maximum Power Point Tracking (MPPT): continuously adjusting operating voltage to extract maximum power as irradiance and temperature fluctuate
- Anti-islanding protection: shutting down instantly if grid power fails (a safety requirement to protect utility workers)
- Grid synchronization: matching output frequency (50 or 60 Hz) and phase to the grid
Micro-inverters (one per panel) and DC optimizers (panel-level electronics feeding a central inverter) address partial shading issues that can cut string inverter output dramatically when even one panel is shaded.
Grid Integration: The Duck Curve Problem
As solar penetration increases, grid operators face the duck curve: the net load (demand minus solar generation) drops steeply during midday then surges in the evening when solar output falls but demand peaks. California's grid regularly sees net load swings of 15–20 GW over a 3–4 hour window.
Solutions being deployed at scale in 2026:
- Grid-scale battery storage: lithium iron phosphate (LFP) 4-hour batteries now co-located with most new utility solar projects. California has over 12 GW of installed battery storage.
- Demand response: smart appliances (water heaters, EVs, HVAC) shift load to solar production hours under time-of-use pricing.
- Interconnection and transmission: moving excess solar from high-generation regions to deficit regions.
- Hydrogen electrolysis: converting surplus solar power to green hydrogen, stored and used for industrial processes or reconversion.
The Real Economics of Solar in 2026
The cost of solar has fallen faster than any energy technology in history.
| Year | Utility-Scale Solar LCOE ($/MWh, US) | Residential Cost per Watt Installed (US) | Global New Installations (GW) |
|---|---|---|---|
| 2010 | $378 | $7.50 | 17 |
| 2014 | $143 | $4.20 | 45 |
| 2018 | $68 | $3.05 | 109 |
| 2020 | $37 | $2.71 | 139 |
| 2022 | $29 | $2.77 | 239 |
| 2024 | $24 | $2.55 | 447 |
| 2026 (est.) | $20–22 | $2.30–2.45 | 550–620 |
Sources: IRENA Renewable Power Generation Costs 2024; Wood Mackenzie Solar Market Insight Q1 2026; BloombergNEF 2026.
At $20–22/MWh, utility solar is now the cheapest source of new electricity generation in virtually every major market worldwide — cheaper than natural gas, coal, nuclear, or wind in most regions. The US residential payback period has dropped to 6–9 years in most states, with 25-year lifetime savings of $25,000–$60,000 depending on system size and local electricity rates.
The remaining cost drivers are not the panels themselves (which now account for roughly 25% of installed system cost) but soft costs: permitting, installation labor, interconnection fees, and financing. These vary enormously by jurisdiction and represent the primary target for policy and regulatory reform.
How Much of the World's Electricity Comes from Solar?
Global solar electricity generation crossed 2,000 TWh in 2023 and is projected at 3,500–4,000 TWh in 2026, representing approximately 10–11% of global electricity. The IEA projects solar will be the largest single source of electricity generation globally by the early 2030s.
The physics of the photovoltaic effect — discovered by Edmond Becquerel in 1839, explained by Einstein in 1905, and industrialized by Bell Labs in 1954 — is now the foundation of the world's fastest-growing energy technology. The electrons being swept across p-n junctions in panels on millions of rooftops are doing the same quantum mechanical dance they always have. What has changed is our ability to manufacture the silicon, deposit the perovskite, program the inverter, and finance the installation at a scale and cost that is permanently reshaping the global energy system.
Frequently Asked Questions
Q: Why don't solar panels work at 100% efficiency? A: The Shockley-Queisser thermodynamic limit caps single-junction cells at ~33.7%. Sub-bandgap photons pass through unused, and above-bandgap photons lose excess energy as heat. Additional electrical and optical losses bring real-world commercial panels to 21–24%.
Q: Do solar panels work on cloudy days? A: Yes, but at reduced output. Diffuse (scattered) sunlight on overcast days delivers roughly 10–25% of clear-sky irradiance. Modern panels with low-light performance optimization can produce meaningful power even in heavily overcast conditions. Germany — not a particularly sunny country — generates substantial solar electricity.
Q: What is a perovskite solar cell and why is it important? A: Perovskite cells use a crystal structure (ABX₃) that can be solution-deposited cheaply and tuned to absorb different wavelengths. When stacked over silicon in a tandem configuration, they push efficiencies above 33%, breaking the single-junction limit. They represent the most commercially significant solar technology development since PERC cells.
Q: How long do solar panels last? A: Modern silicon panels carry 25–30 year product warranties guaranteeing >80% of original output. Real-world data from panels installed in the 1990s shows degradation rates of 0.3–0.5% per year, meaning panels often remain functional and productive well beyond their warranty period.
Q: What happens to solar panels at end of life? A: Recycling is an emerging industry. Silicon, aluminum, and silver are recoverable. The EU's updated WEEE Directive mandates solar panel recycling. Several companies (including First Solar and SunPower) operate take-back programs. Perovskite cells containing lead will require careful end-of-life management.
Q: Can solar panels power a home at night? A: Not directly — panels produce no power without light. Paired with battery storage (e.g., Tesla Powerwall, Enphase IQ Battery), a home can shift daytime solar production to evening use. Full off-grid operation requires sizing the battery for worst-case winter days, which adds significant cost.
Q: Are solar panels worth it in cloudy climates? A: Yes, often strongly so. Germany — which has roughly the same solar irradiance as Alaska — installed more solar capacity per capita than nearly any country in the world and generates 10–12% of its electricity from solar. What matters financially is not peak irradiance but total annual kWh yield, local electricity prices, and available incentives. A system in Seattle or London produces 30–40% less annual energy than one in Phoenix, but if local electricity rates are high and incentives are strong, the economics can still be compelling. Modern panels with high bifacial gain and low-light optimization perform proportionally better on overcast days than older polycrystalline designs.
Q: What is the difference between solar PV and solar thermal? A: Photovoltaic (PV) panels convert sunlight directly to electricity via the photoelectric effect. Solar thermal systems use sunlight to heat a fluid (water or glycol) for space heating or domestic hot water. They are fundamentally different technologies; this article covers PV only.
Q: Are solar panels worth it financially in 2026? A: In most US states and many countries, yes. With installed costs of $2.30–2.45/W and electricity rates rising, payback periods of 6–9 years on systems lasting 25+ years deliver strong returns. The economics depend on local electricity rates, available incentives (US federal ITC is 30% through 2032), and roof orientation.
Sources
- IRENA. Renewable Power Generation Costs 2024. International Renewable Energy Agency, 2025.
- Shockley, W. & Queisser, H.J. "Detailed Balance Limit of Efficiency of p-n Junction Solar Cells." Journal of Applied Physics, 32(3), 1961.
- NREL. Best Research-Cell Efficiency Chart. National Renewable Energy Laboratory, updated May 2026. https://www.nrel.gov/pv/cell-efficiency.html
- IEA. Electricity 2026. International Energy Agency, 2026.
- Al-Ashouri et al. "Monolithic perovskite/silicon tandem solar cell with >29% efficiency." Science, 370, 2020.
- BloombergNEF. Solar Market Outlook 2026. BloombergNEF, 2026.
Related Articles
Follow new articles
Add SciHub101 to your feed reader to see new science and technology stories.
About the Author
SciHub101 is an independent science and technology publication founded and edited by Buğra Sözeri, a software engineer and app developer based in Türkiye. AI tools assist with drafting and research. Source documentation in the existing archive is uneven, and articles are being reviewed and corrected. The Editorial Team byline identifies editorial responsibility; it does not certify specialist or independent human review. Where we compare products, anything built by our own team is labelled as such — see the editorial guidelines and About page for how corrections and disclosures work.
Related Articles

Extreme Weather and Climate Change: What Science Says
How scientists link heat waves, floods, wildfires, and storms to climate change, how attribution studies work, and where the evidence is still weak.
Countries with the Most Nuclear Power (Ranked)
The United States operates 94 nuclear reactors producing nearly 97 GW of electricity — more nuclear capacity than any other nation on Earth. But France is the world's most nuclear-dependent country: 70–75% of French electricity comes from its 57 reactors, the highest share of any major economy. This article ranks nuclear nations by capacity, reactor count, and electricity share.

Machine Learning for Solar Panel Efficiency: Squeezing More Power from Every Panel
ML is improving solar energy output at every stage — from materials discovery to real-time inverter control — helping solar remain the world's fastest-growing energy source.
Countries with the Most Hydropower (Ranked by Installed Capacity)
China leads the world in hydropower with 435.95 GW of installed capacity — more than three times that of second-place Brazil at 110 GW. Hydropower is the world's largest source of renewable electricity, accounting for roughly 40 percent of global renewable generation. This ranking covers the top 15 countries by hydropower installed capacity using IHA and IRENA 2024 data, with methodology, historical context, and caveats about what capacity figures do and do not tell you.
Largest Solar Farms in the World
The largest solar farms rank by installed capacity, from China's Tengger park to the UAE's Al Dhafra site. Here is how capacity, land, and real output compare.
How Solar Panels Convert Light to Electricity
A photon from the sun hits silicon, kicks out an electron, and creates electricity. This simple fact is reshaping civilization.