How Solar Panels Convert Light to Electricity
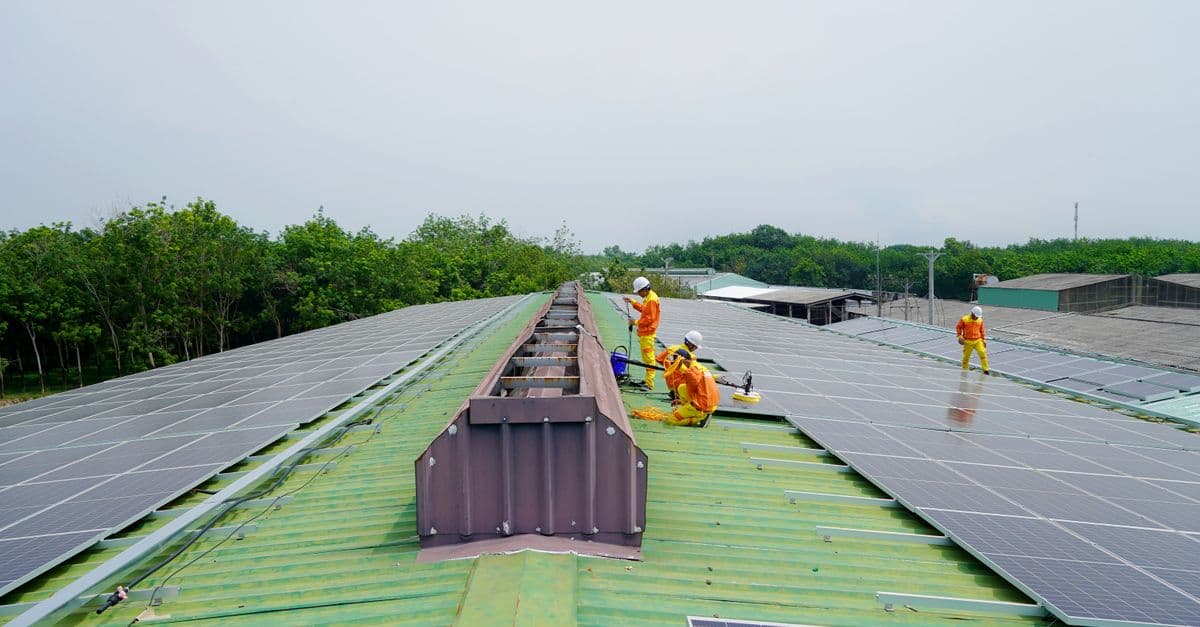
Photo: Trinh Trần / Pexels
In 1839, French physicist Edmond Becquerel noticed that certain materials produced a small electric current when exposed to light. He had no idea why. It took Einstein's 1905 Nobel Prize-winning paper on the photoelectric effect to explain it — and another 50 years before Bell Labs engineers made the first practical solar cell in 1954 at 6% efficiency. Today's commercial silicon panels achieve 22–24% efficiency. The cost has fallen 99.6% since 1976. Solar is now the cheapest electricity source in human history.
Key takeaways
- The photovoltaic effect works when photons with enough energy knock electrons free in a semiconductor — the built-in electric field of a P-N junction drives those electrons through an external circuit as current.
- Silicon solar cells use a P-N junction to create a built-in electric field; photons above the bandgap energy (~1.12 eV for silicon) generate electron-hole pairs that are separated by this field.
- Commercial monocrystalline silicon panels achieve 22–24% efficiency; theoretical limit for single-junction silicon is about 29.4% (the Shockley-Queisser limit).
- Perovskite solar cells are the most exciting next-generation technology — lab efficiencies already exceed 33% in multi-junction configurations.
Light as particles: the photovoltaic effect
To understand solar cells, you need to think of light as particles (photons) as well as waves. Each photon carries a specific amount of energy proportional to its frequency — higher frequency light (blue, violet) carries more energy per photon than lower frequency light (red, infrared).
When a photon hits a material, several things can happen: it can pass through (transparent), be reflected, be absorbed and converted to heat, or — in photovoltaic materials — be absorbed and transfer its energy to an electron.
In a semiconductor like silicon, electrons occupy specific energy bands. The valence band is where electrons normally reside; the conduction band is where electrons can move freely and conduct current. The gap between them — the bandgap — is 1.12 electron volts (eV) for silicon.
If a photon arrives with energy greater than 1.12 eV (corresponding to wavelengths shorter than about 1,100 nm — most of visible and near-infrared sunlight), it can promote an electron from the valence band to the conduction band, leaving behind a positively charged "hole" where the electron was. This electron-hole pair is the fundamental unit of photovoltaic energy conversion.
The challenge: these electron-hole pairs will recombine almost instantly (within microseconds) unless something separates them. That's where the P-N junction comes in.
The P-N junction: the engine of the solar cell
A standard silicon solar cell is a thin wafer of silicon with two differently doped regions:
- A thick P-type base (doped with boron, creating a surplus of holes)
- A thin N-type emitter layer on top (doped with phosphorus, creating a surplus of electrons)
At the junction between these regions, electrons from the N side drift to fill holes in the P side, and vice versa. This creates a region depleted of free charge carriers called the depletion zone, and establishes a built-in electric field pointing from N to P.
When a photon generates an electron-hole pair near this junction:
- The electric field sweeps the electron toward the N-type side
- The hole is swept toward the P-type side
- The separated carriers are collected by metal contacts and driven through the external circuit
Connect a wire from the P-type contact to the N-type contact, and current flows. That's it — sunlight to electricity. The voltage a silicon solar cell produces is about 0.5–0.6V; connect cells in series to get higher voltages (a standard 60-cell panel produces about 30–36V).
The efficiency equation: why not 100%?
Only about 46% of the solar energy reaching Earth's surface can theoretically be converted to electricity by a single-junction silicon cell — the Shockley-Queisser limit, calculated in 1961.
The main losses:
Below-bandgap photons (infrared light): Don't have enough energy to excite an electron. They pass through or are absorbed as heat. This wastes about 19% of incoming energy.
Above-bandgap excess energy: A photon with more than 1.12 eV energy generates an electron-hole pair, but the excess energy above 1.12 eV is lost as heat (thermalization). A blue photon has 2.7 eV — half its energy is wasted. This loses another ~33%.
Recombination losses: Some electron-hole pairs recombine before reaching the contacts.
Optical losses: Reflection from the surface, absorption in the front metal contacts.
Real cells achieve less than the theoretical maximum due to additional losses. The best research silicon cells hit about 26–27%; commercial panels are at 22–24%. The gap is real engineering achievement headroom.
Modern cell architectures: racing toward the limit
Several innovations have pushed commercial silicon efficiencies higher:
PERC (Passivated Emitter and Rear Cell): Adding a dielectric passivation layer on the back surface reduces recombination losses. PERC is now the industry standard for 2023-era panels, achieving ~22–23%.
TOPCon (Tunnel Oxide Passivated Contact): An ultra-thin tunnel oxide layer on the rear contact provides excellent passivation while still allowing current to tunnel through. TOPCon cells achieve ~23–24%.
Heterojunction (HJT): Combines crystalline silicon with thin amorphous silicon layers, offering excellent surface passivation and a high temperature coefficient (they maintain efficiency better in hot conditions). Panasonic's HIT cells and Longi's HJT products reach ~24–25%.
IBC (Interdigitated Back Contact): Moves all contacts to the back of the cell, eliminating shading from front metal fingers. SunPower's Maxeon cells and IBC designs reach up to 24–26% but cost more to manufacture.
The Physics of Semiconductors: Doping and Energy Bands
To truly understand solar cells, you need to grasp semiconductor physics. Silicon on its own is a poor conductor — electrons are tightly bound to atoms. But add a dopant, and everything changes.
N-type doping: Adding phosphorus (which has 5 valence electrons vs. silicon's 4) creates an extra electron that doesn't fit into the covalent bonds. This electron is nearly free — it requires only 0.045 eV to promote into the conduction band. Phosphorus is called a donor, and silicon doped with phosphorus is N-type.
P-type doping: Adding boron (3 valence electrons) creates a missing electron — a "hole" that acts like a positive charge. A hole in the valence band can move through the crystal by electrons filling it, effectively moving the positive charge. Boron is called an acceptor, and silicon doped with boron is P-type.
At the P-N junction, something remarkable happens. Electrons from N migrate toward P (where holes are); holes from P migrate toward N. This charge movement creates an electric field — a built-in potential of about 0.6–0.8 volts even in darkness. This field is the workhorse of the solar cell: it separates photogenerated electron-hole pairs before they recombine.
Source: MIT Photovoltaic Energy Laboratory (2024) — The built-in potential of silicon P-N junctions reaches ~0.8V in zero light; photons generate additional potential difference, with an operating voltage of 0.5–0.6V under full sun.
The Fermi level — the energy level below which states are filled and above which they are empty at zero temperature — sits differently in P-type and N-type material. At a P-N junction, the Fermi level must be continuous, forcing a band bending. This bending creates the depletion region where most photons are absorbed and most photogenerated carriers are separated.
Temperature Effects and Climate Performance
A counterintuitive fact: solar panels lose efficiency when they heat up, even though they're powered by heat. Why?
As a silicon cell heats up, the bandgap energy decreases. Electrons and holes need less energy to cross the bandgap, meaning fewer high-energy photons are wasted as heat (a good thing). But the open-circuit voltage decreases more than this bandgap narrowing would suggest, primarily due to increased thermal energy causing more recombination in the depletion region.
Net result: Typical silicon cells lose about 0.4–0.5% efficiency per degree Celsius above 25°C. A panel rated at 400W at 25°C produces only 350W at 55°C (a realistic operating temperature in direct sun). This is critical in hot climates — the theoretical advantage of strong sun is partly offset by heat losses.
Temperature coefficient is the manufacturer's way of measuring this. A panel with a -0.4%/°C coefficient loses 4% efficiency over a 10°C rise. Some newer technologies perform better:
- Heterojunction (HJT) cells: -0.3%/°C (better than silicon)
- Perovskites: -0.3 to -0.4%/°C
- III-V multi-junction: Can be below -0.3%/°C
In cold climates, panels paradoxically perform better per watt than their rated specs suggest (as long as there's still sunshine). A 400W panel in Oslo at -10°C might produce 415W, compensating for the lower sun angle and shorter days.
System Architecture: From Cell to Kilowatt-Hour
A complete solar installation involves far more than just panels.
Inverter (30% of system cost): Converts DC from panels to AC for home use. String inverters (one for whole array) are cheaper but less flexible. Microinverters (one per panel) allow monitoring and optimization of individual panels. Hybrid inverters also include a battery charger for storage.
Charge controller (for battery systems): Regulates current from panels to battery, preventing overcharging. MPPT (Maximum Power Point Tracking) controllers constantly adjust voltage/current to operate the panel at its maximum power point — a subtle curve that varies with temperature and irradiance.
Wiring and combiner boxes: Balance-of-system components that add up. Undersized wiring causes voltage drop losses; oversized wiring is expensive. Combiner boxes aggregate multiple panel strings safely.
Mounting hardware (10% of cost): Roof, ground, or pole-mounted structures that orient panels optimally. Rooftop mounting is simplest; ground mounting allows seasonal angle adjustments or tracking (single-axis or dual-axis trackers increase output 20–30% but cost more).
Disconnects and safety equipment: Breakers, fuses, grounding rods, fire detection. Solar systems can produce dangerous voltages (600V+ for large commercial systems); proper disconnects are critical.
System design is where 20–30% of real-world efficiency loss happens. Poor wiring, mismatched components, or suboptimal angles all reduce output below what the panel nameplate promises.
The Soiling Problem and System Degradation
Dust, bird droppings, pollen, and lichen accumulate on panels over time, blocking sunlight. In arid climates (Middle East, Nevada), soiling can reduce output by 5–10% or more if uncleaned.
Source: NREL Soiling Analysis (2024) — Dust and soiling reduce panel output by 3-5% globally on average, up to 15-20% in very dusty regions.
Modern panels have hydrophobic coatings that reduce dust adhesion, but maintenance remains important. Commercial installations often include:
- Regular (monthly or quarterly) cleaning
- Soiling sensors that trigger automatic cleaning systems
- Weather stations that monitor rain (natural cleaning) vs. dry periods
For residential systems, occasional rain usually cleans panels. A professional cleaning every 1–2 years costs $150–300 and often pays for itself through improved output.
Cost Breakdown: What You're Paying For
A typical residential solar installation has a total cost of $2.50–3.50 per watt, broken down roughly as:
| Component | Cost per Watt | % of Total |
|---|---|---|
| Panels | $0.30–0.50 | 12–18% |
| Inverter | $0.40–0.70 | 16–22% |
| Labor | $0.50–0.80 | 20–30% |
| Balance of System (wiring, mounts, safety) | $0.40–0.60 | 16–20% |
| Soft costs (permitting, inspections, engineering) | $0.30–0.50 | 12–18% |
| Contractor profit | $0.10–0.40 | 5–12% |
Panels themselves are only 12–18% of total cost. When people think "solar is cheap," they're usually reacting to the 90% drop in panel prices since 2010. But labor, permitting, and soft costs haven't fallen as fast. This explains why solar is much cheaper in countries with streamlined permitting (Germany, Denmark) than in heavily regulated ones (USA varies by state).
A system that costs $20,000 in California might cost $12,000 in Germany for identical hardware — entirely due to permitting, inspection, and soft-cost differences.
Beyond Silicon: Competing Technologies
Perovskite solar cells are the most exciting near-term frontier. Perovskites are a class of crystal structures that can be tuned to absorb different wavelengths by swapping cations (the "A" in ABX₃ can be methylammonium, cesium, formamidinium, or blends thereof). Lab efficiencies:
- Single-junction perovskites: 25.7%
- Perovskite-silicon tandems: 33.9% (2023 record)
- All-perovskite multi-junction: 31.6%
But challenges remain:
- Stability: Perovskites degrade in moisture and UV. Sealed modules last years, but outdoor durability testing is still ongoing.
- Lead toxicity: Most efficient perovskites contain lead. Lead-free alternatives (tin, bismuth) exist but are less efficient.
- Scaling: Lab batches are millimeters; industrial production at meter scales remains unproven.
Thin-film technologies (CIGS, CdTe) offer advantages:
- Very thin (1–2 micrometers vs. 200+ for silicon)
- Good high-temperature performance
- Commercial production exists but efficiency remains 15–22%
- Environmental concerns (cadmium, selenium) in CdTe
Organic photovoltaics (OPVs) have the advantage of flexibility — roll-able, lightweight panels. But efficiencies remain low (15%) and lifetime is shorter (5–10 years vs. 25+ for silicon). Likely use case: building-integrated flexible PV on vehicles or textiles.
Multi-junction strategies beyond perovskite:
- Perovskite-perovskite tandems, tuning each layer to different bandgaps
- Perovskite-CdTe, perovskite-CIGS tandems
- III-V-perovskite tandems for maximum theoretical efficiency
Solar Economics: Return on Investment and Financial Payback
The physics of solar conversion is only half the story. For most homeowners and businesses, the financial case is what drives adoption. Understanding the economic lifecycle of a solar installation reveals why costs have fallen so dramatically and why solar is now the fastest-growing electricity source globally.
The payback period is the time required for cumulative electricity savings to equal the installation cost. For a $20,000 residential system generating 6,000 kWh annually at $0.14 per kWh (U.S. average), the annual electricity savings is approximately $840. Gross payback occurs in about 24 years — within the 25-30 year lifespan of the panels. However, this simple payback ignores electricity price inflation, tax credits, and performance degradation, which substantially improves the real-world calculation.
Source: NREL Residential Solar Cost and Performance Analysis (2024) — After applying 30% federal investment tax credit (ITC) in the United States and accounting for typical 2–2.5% annual electricity rate escalation, payback periods compress to 7–10 years for residential systems in states with favorable incentives.
Levelized cost of electricity (LCOE) is the industry standard for comparing energy sources. LCOE accounts for all costs (hardware, installation, financing, maintenance, land) divided by lifetime energy output, expressed as $/kWh. As of 2024:
- Solar (utility-scale): $20–30/MWh
- Wind (onshore): $25–35/MWh
- Natural gas (current market): $40–60/MWh
- Coal: $50–80/MWh
- Nuclear: $70–130/MWh
This calculation shows why solar is economically dominant in sunny regions. A 100 MW utility-scale solar farm produces electricity at a cost lower than operating existing coal plants (which no longer need capital costs factored in). This economic advantage drives a feedback loop: cheaper solar attracts investment, which reduces costs further, which accelerates deployment.
Financing structures dramatically affect residential ROI. Most U.S. solar systems are financed via one of three mechanisms:
Cash purchase (25% of installations): Highest upfront cost, but full ownership of all federal and state tax credits, accelerated depreciation benefits (for businesses), and lowest interest costs. Net savings are maximized but require liquid capital.
Solar loans (45% of installations): Third-party lender finances the system, homeowner owns it, receives tax credits, and pays back over 5–20 years. Interest rates typically 4–8%, adding 15–25% to total system cost. Allows ownership without large upfront payment.
Solar leases and Power Purchase Agreements (PPAs) (30% of installations): Homeowner pays zero down; third-party owner leases panels to home and sells electricity at a fixed or escalating rate (typically 1–3% below retail grid rates). No maintenance responsibility, predictable costs, but no tax credits or ownership. Third party captures credits and tax benefits.
A $20,000 system financed via a 7-year loan at 6% interest costs approximately $3,300 per year in loan payments. With $840 in annual savings, the net cost is still negative in year 1 only if electricity savings exceed loan payments — which happens most often in high-rate states (California at $0.20+/kWh, Hawaii at $0.30+/kWh) but not in low-rate states (Louisiana at $0.09/kWh). This explains the geographic disparity in residential solar adoption.
State and federal incentives:
In addition to the 30% federal ITC (Inflation Reduction Act, extended through 2032), states offer:
- Net metering policies (credit unused solar electricity to next month's grid bill)
- Rebate programs ($500–$5,000 per system)
- Tax credits (5–30% state-level on top of federal)
- Performance-based incentives ($/kWh paid for electricity fed to grid)
These incentives can reduce net system cost by 40–50%, cutting payback to 5–6 years in high-solar, high-rate states. Germany and Denmark, with smaller direct incentives but streamlined permitting and high electricity rates (€0.30–0.35/kWh), see payback periods of 8–12 years — competitive with investment returns in many markets.
Commercial and utility-scale economics differ substantially. A utility-scale 10 MW solar farm costs $10–15 million to build and generates electricity 24/7/365 (with ~25% capacity factor in temperate climates). Annual revenue at $25/MWh LCOE and 25% capacity factor is approximately $550,000. Net operating profit (after maintenance, land lease, property tax) is roughly 8–10% of revenue annually, yielding a 10–12% IRR (internal rate of return) over 25 years. This compares favorably to a 5% bond yield, making solar attractive for pension funds, insurance companies, and utilities seeking long-term inflation-hedged returns.
Grid parity — the point where solar LCOE equals grid electricity cost — was reached in most developed nations by 2020. In many regions, it's now reached for storage-augmented solar (solar + batteries), which can guarantee electricity at specific times. This economic inflection point explains why solar deployment accelerates despite no further subsidies: the technology pays for itself.
O&M (operations and maintenance) costs are often underestimated. Annual O&M for residential systems averages $150–300 (cleaning, inverter replacement fund, monitoring). Commercial systems benefit from economies of scale; large farms average $12–15/kW/year. Over 25 years, O&M adds roughly 10–15% to LCOE, a factor that favors solar in dry, dusty climates where soiling is minimal and relatively unfavors solar in rainy climates (where panels rarely need cleaning).
Source: International Renewable Energy Agency (IRENA) Cost Database (2024) — Global weighted-average cost of residential solar systems fell 89% from 2010 to 2023, while utility-scale fell 86%, driven by manufacturing learning curves and supply-chain competition.
Emerging finance models are reshaping who can afford solar. Community solar programs allow renters and apartment dwellers to invest in shared arrays and receive proportional credits on utility bills. Energy service agreements (ESAs) combine solar, storage, and efficiency upgrades into a single service, with payment proportional to energy savings (not system size). These models expand solar access beyond homeowners with roofs and credit scores to underserved populations.
The takeaway
Solar electricity generation relies on physics worked out over a century — the photoelectric effect, quantum mechanics, and semiconductor theory. A modern silicon solar panel is a triumph of engineering: it converts 20–24% of photons into electrons through a remarkably simple P-N junction, survives 25+ years in harsh outdoor conditions, and now costs less than any alternative electricity source on the planet.
Yet the technology is far from mature. Perovskite-silicon tandems in the lab reach 34% efficiency, hinting at improvements ahead. Manufacturing costs continue to fall. Recycling and second-life markets are emerging. And integration with storage, smart grids, and electric vehicles is just beginning.
The bottleneck today isn't the panels themselves — it's system design, installation, permitting, and grid integration. Making solar not just technically superior but economically and logistically superior to fossil fuels at planetary scale requires innovations in soft infrastructure as much as in cell physics.
Frequently Asked Questions
Q: Do solar panels work on cloudy days?
A: Yes, but at reduced output—typically 10–30% of their rated power in overcast conditions. Diffuse sunlight still carries energy and can excite electrons in the semiconductor. Germany, despite its relatively cloudy climate, generates significant solar power because panels operate year-round, accumulating energy across thousands of partially cloudy days.
Q: What is the temperature coefficient of solar panels and why does it matter?
A: The temperature coefficient measures efficiency loss per degree Celsius above the standard test condition (25°C), typically -0.3 to -0.5%/°C for silicon. A panel rated at 400W at 25°C produces only 350W at 55°C (a realistic operating temperature in direct sun). In hot climates, this degradation with heat can reduce annual output by 10–15% compared to temperate zones, offsetting the advantage of stronger sunlight.
Q: What happens to solar panels at end of life, and are they recyclable?
A: Most panels contain silicon, glass, aluminum, silver, and small amounts of lead or other metals. Glass and aluminum are readily recyclable via standard processes. Silicon can be separated and purified, though current recycling captures only 85–95% of material value. The 25–30 year lifespan of current panels means a major recycling wave will peak around 2040–2050; EU regulations mandate 85–95% collection and recycling rates by 2030.
Q: Why is the efficiency rating so different from real-world performance?
A: Panel efficiency ratings use Standard Test Conditions (STC): 1000 W/m² irradiance, 25°C cell temperature, specific solar spectrum. Real panels operate at higher temperatures (reducing efficiency), real sunlight intensity varies with weather and time of day, and system losses (inverter efficiency, wiring losses, soiling) further reduce output. Realistic real-world yield is typically 75–85% of STC-rated output annually.
Q: Is manufacturing a solar panel more energy-intensive than it will ever generate?
A: No. Modern silicon panels have an energy payback period of 1–2 years in European conditions and 6–12 months in sunnier climates. A panel rated for 25–30 years produces 12–50 times the energy used in its manufacture, with net energy benefits accumulating over decades.
Q: What are the most promising next-generation solar technologies after silicon?
A: Perovskite-silicon tandem cells have reached 33.9% laboratory efficiency, nearly double single-junction silicon, with potential for commercial production in the next 5 years. Challenges include durability (perovskites degrade in moisture) and lead toxicity. All-perovskite multi-junction cells offer even higher theoretical efficiency but face similar durability questions. Thin-film CIGS and organic photovoltaics remain viable for niche applications (curved surfaces, portable devices) but lack silicon's efficiency and durability.
Read next:
Follow new articles
Add SciHub101 to your feed reader to see new science and technology stories.
About the Author
SciHub101 is an independent science and technology publication founded and edited by Buğra Sözeri, a software engineer and app developer based in Türkiye. AI tools assist with drafting and research. Source documentation in the existing archive is uneven, and articles are being reviewed and corrected. The Editorial Team byline identifies editorial responsibility; it does not certify specialist or independent human review. Where we compare products, anything built by our own team is labelled as such — see the editorial guidelines and About page for how corrections and disclosures work.
Related Articles

How Ransomware Works — The Cybercrime That Shuts Down Hospitals
Ransomware has crippled hospitals, pipelines, and governments. Here is the technical reality of how attackers get in, encrypt files, steal data, and get paid, and which defenses hold up.

How Social Engineering Hacking Works — Why Humans Are the Weakest Link
The most sophisticated cyberattacks don't exploit code — they exploit people. Here's how phishing, pretexting, spear phishing, and vishing manipulate human psychology to bypass any technical defense.
How Satellites Orbit Earth: The Physics and Engineering Behind Eyes in the Sky
There are over 8,000 active satellites orbiting Earth right now. Here's how they stay up and what they do.
How the Transistor Changed Everything
Demonstrated at Bell Labs in December 1947, the transistor became the building block of every digital device on earth.
History of Electricity: Faraday, Tesla, Edison, and the Force That Powers the World
Electricity was a scientific curiosity in 1800. Within 100 years it was lighting cities and running factories.

How Jet Engines Work: The Physics of Flight Power
A single GE90-115B turbofan is rated at 115,300 pounds-force of thrust. The physics behind it is a short chain of ideas: squeeze air, burn fuel in it, and let the hot gas do work.