How Hurricanes Form — Cyclone Science
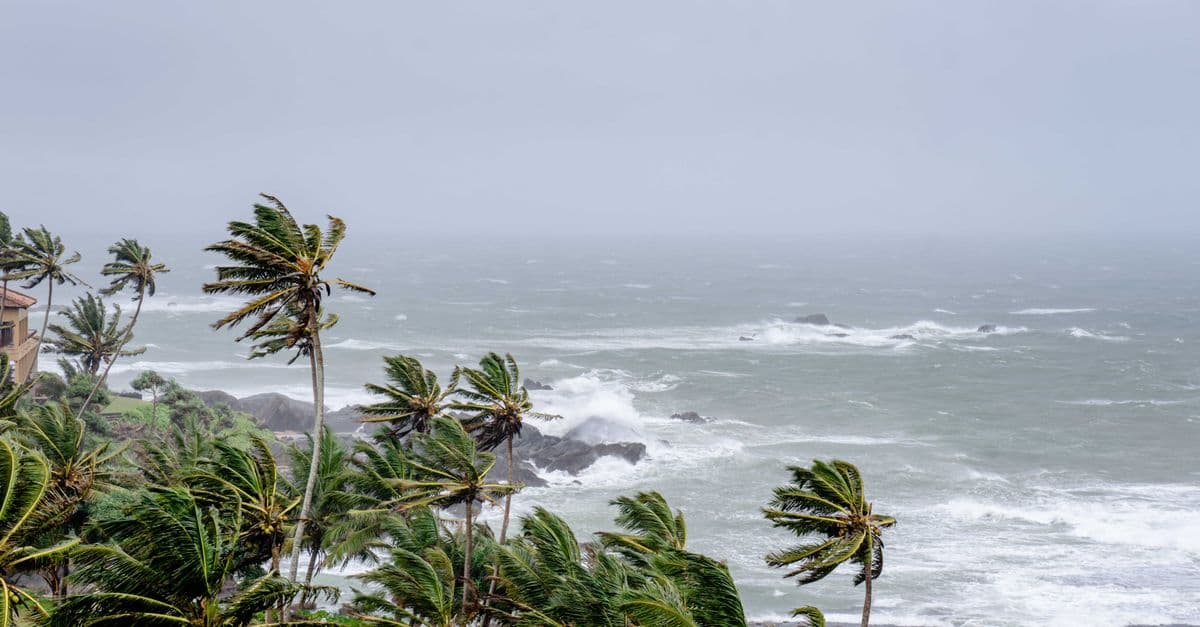
Photo: Atlantic Ambience / Pexels
A hurricane is a tropical cyclone — a rotating storm system that runs on warm ocean water the way a car engine runs on gasoline. The same physical phenomenon goes by different names depending on where it forms: hurricane in the Atlantic and Eastern Pacific, typhoon in the Western Pacific, and cyclone in the Indian Ocean and around Australia. The mechanics are identical everywhere on Earth; only the geography, and the naming committee, changes. This article walks through the five ingredients a storm needs, the internal engine that powers it, why it eventually dies, and what forecasters can and cannot yet predict about it.
The Five Ingredients for Hurricane Formation
Hurricanes do not appear at random, and they are not simply "big storms" that got lucky. Meteorologists at the National Hurricane Center (NHC), a division of NOAA, have identified a specific set of atmospheric and oceanic conditions that must all be present simultaneously. Miss even one, and a promising cluster of thunderstorms fizzles instead of organizing into a cyclone.
1. Warm ocean water at or above 26.5°C (80°F), to a depth of roughly 50 meters (about 165 feet). This is the fuel tank. The threshold matters because a storm's own churning drags cooler water up from below — if that deep water is warm too, the storm keeps feeding itself; if it is cold, the storm effectively cools its own engine and weakens. Warmer surface water means more evaporation, which means more water vapor rising into the storm, which means more latent heat released when that vapor condenses into cloud droplets higher up.
2. Low vertical wind shear. Wind shear is the change in wind speed or direction between the surface and the upper atmosphere, typically measured between about 850 hPa and 200 hPa. Strong shear tilts a developing storm sideways, separating its low-level circulation from its upper-level outflow and tearing the structure apart before it can consolidate. Quiet, uniform winds aloft let the storm build straight up into a coherent, self-reinforcing column.
3. The Coriolis effect. Earth's rotation deflects moving air to the right in the Northern Hemisphere and to the left in the Southern Hemisphere, which is what gives storms their spin — counterclockwise north of the equator, clockwise south of it. Within roughly 5 degrees of latitude of the equator itself, the Coriolis force is essentially zero, so incoming thunderstorm clusters cannot organize into rotation. This is the well-documented reason hurricanes almost never form directly on the equator, even though sea-surface temperatures there are often warm enough.
4. A pre-existing tropical disturbance. A hurricane needs a seed disturbance to amplify — it does not spontaneously assemble from clear sky. In the Atlantic basin, roughly 85% of major hurricanes trace their origin to African Easterly Waves, undulations in the mid-level wind that peel off the African coast near the Cape Verde islands every three to five days during hurricane season and track westward over the tropical Atlantic, some of them intensifying as they cross thousands of kilometers of warm water.
5. Sufficient moisture in the mid-troposphere. Dry air aloft — most notably outbreaks of the Saharan Air Layer, a dusty, dry layer that regularly pushes off West Africa in summer — suppresses the thunderstorm updrafts a hurricane needs to grow. Humid mid-levels, by contrast, let individual convective cells merge into the large, organized cluster that eventually develops a closed circulation.
Lifecycle: From Tropical Wave to Category 5
A hurricane's life is measured almost entirely in one number: maximum sustained wind speed, averaged over one minute at 10 meters (33 feet) above the surface, the standard NHC uses for classification.
| Stage | Sustained Wind Speed | What's Happening |
|---|---|---|
| Tropical disturbance | Not applicable | Disorganized cluster of showers and thunderstorms, no closed circulation |
| Tropical depression | Under 39 mph (63 km/h) | A closed low-level circulation appears; the system gets a number, not a name |
| Tropical storm | 39–73 mph (63–118 km/h) | Circulation tightens; the storm is assigned a name from the WMO's rotating list |
| Hurricane (Category 1) | 74–95 mph (119–153 km/h) | Sustained winds cross the hurricane threshold; an eye may begin to form |
| Major hurricane (Category 3+) | 111 mph (178 km/h) or higher | Structurally the most dangerous tier; eyewall replacement cycles common |
| Category 5 | 157 mph (252 km/h) or higher | Catastrophic; the top of the Saffir–Simpson scale, with no upper bound defined |
Wind-speed thresholds for the Saffir–Simpson Hurricane Wind Scale, National Hurricane Center.
Between the tropical-storm and hurricane stages, a storm can undergo rapid intensification — an NHC-defined jump of at least 30 knots (about 35 mph) in maximum sustained wind in 24 hours. It is not rare among the strongest storms: NHC records show rapid intensification occurs in roughly 80% of Atlantic major hurricanes. Hurricane Milton in October 2024 is the sharpest recent example — NHC's official advisory track shows Milton's winds jumping from about 80 mph to 175 mph in a 24-hour window over the Gulf of Mexico, a leap in intensification rate exceeded in the modern Atlantic record only by Hurricanes Wilma (2005) and Felix (2007). Milton went from tropical storm to Category 5 in roughly a day.
Why does rapid intensification happen?
It happens when every one of the five formation ingredients is simultaneously near-ideal at once — unusually warm water (often over an eddy of especially deep warm water), very low wind shear, and a moist mid-troposphere — combined with an already well-organized inner core. Forecasters still cannot reliably predict which storms will do this or exactly when, which is why it remains, according to a 2024 Congressional Research Service brief on the subject, one of the most stubborn open problems in operational hurricane forecasting.
Anatomy of a Hurricane
A mature hurricane organizes itself into three structures that recur, with only cosmetic variation, in every named storm on Earth.
- The eye. A relatively calm, often partly clear, sinking-air center typically 30–65 km (20–40 miles) across. Air descending through the eye warms adiabatically (through compression, not heat transfer) and dries out, which is why pilots and hurricane hunters flying through it sometimes report brief sunshine ringed by a sheer wall of cloud.
- The eyewall. The ring of intense thunderstorms immediately surrounding the eye, home to the storm's strongest sustained winds and heaviest rainfall. Strong hurricanes frequently undergo eyewall replacement cycles, in which an outer ring of convection forms, chokes off the original eyewall's moisture supply, and contracts to become the new eyewall — a process that briefly weakens the storm before it often re-intensifies with a larger wind field.
- Spiral rainbands. Long, curving bands of thunderstorms that spiral inward toward the core, feeding it moisture and occasionally spinning up their own embedded tornadoes, particularly in the storm's right-front quadrant relative to its motion.
Where the Energy Comes From
A hurricane is, in the most literal sense, a heat engine. Warm ocean water evaporates into the air above it; that water vapor rises, cools, and condenses into cloud droplets; condensation is an exothermic phase change, so it releases latent heat directly into the surrounding air. That heat warms the air further, making it more buoyant, so it rises faster, drawing in more moist air from the surface below in a self-reinforcing loop meteorologists call the Wind-Induced Surface Heat Exchange (WISHE) mechanism.
This single mechanism explains two things people often find puzzling. First, why storms need warm water specifically and not just "hot weather" — the ocean is the actual heat and moisture reservoir, and land simply cannot supply the same continuous flux of both. Second, why hurricanes weaken so quickly after landfall: cut off from the ocean's evaporative fuel supply and dragged by rougher terrain friction, a storm typically loses half its intensity within 12 hours of moving inland, even though its rain and wind field can still travel hundreds of kilometers further and cause severe damage as a weakening system.
Meteorologists quantify a storm's total lifetime energy output using the Accumulated Cyclone Energy (ACE) index, defined as the sum of the squares of a storm's maximum sustained wind speed (in knots), recorded every six hours for as long as it holds at least tropical-storm strength. ACE captures a season's cumulative destructive potential in a way that simple storm counts cannot — a season with few but powerful, long-lived storms can post a higher ACE total than a season with many short-lived weak ones.
The Saffir–Simpson Scale
| Category | Wind Speed | Typical Damage | Example |
|---|---|---|---|
| 1 | 74–95 mph (119–153 km/h) | Some damage to roofing, trees down | Many landfalling US storms |
| 2 | 96–110 mph (154–177 km/h) | Extensive damage; roof and siding failures | Ike, 2008 (at landfall) |
| 3 | 111–129 mph (178–208 km/h) | Devastating; well-built homes lose roofs | Katrina, 2005 (at landfall) |
| 4 | 130–156 mph (209–251 km/h) | Catastrophic structural damage | Harvey 2017; Ian 2022 |
| 5 | 157 mph+ (252 km/h+) | Total roof and wall failure likely | Camille 1969; Dorian 2019 |
Saffir–Simpson Hurricane Wind Scale categories and representative storms, National Hurricane Center.
The scale measures wind only, and that narrow focus has been a source of ongoing criticism for decades, because wind is not what kills most people. NHC-affiliated researchers publishing in the American Meteorological Society's journal Weather, Climate, and Society found that for the 1963–2012 period, storm surge alone accounted for roughly 49% of direct US tropical-cyclone deaths, and storm surge plus rainfall flooding plus high surf together accounted for about 88% of all direct fatalities. More recent NOAA-affiliated analysis covering 2013–2022 shows the mix shifting further toward rain: freshwater/rainfall flooding is now the single leading cause of direct US tropical-cyclone deaths, responsible for roughly 57% of them, with storm surge accounting for a smaller but still substantial share. Either way, across six decades of data, wind itself is a minority cause of death — which is exactly why Superstorm Sandy in 2012, technically only a post-tropical cyclone by the time it made landfall in New Jersey, could still kill dozens of people and cause an estimated $70 billion-plus in damage almost entirely through storm surge into New York Harbor and the New Jersey coast.
Why doesn't the Saffir–Simpson scale include storm surge or rain?
An earlier version of the scale, used until 2010, did include a surge estimate, but NHC dropped it because surge height depends heavily on a coastline's shape, the tide at landfall, and the storm's size and forward speed — not on wind speed alone — so a single wind category could not reliably predict it. NHC now issues separate storm surge watches, warnings, and inundation maps for that reason.
How Forecasters Track and Predict Hurricanes
Modern hurricane forecasting blends satellite imagery, ocean buoys, and — critically — direct measurements taken from inside the storm itself. The US Air Force Reserve's 53rd Weather Reconnaissance Squadron flies ten WC-130J aircraft directly into storms, while NOAA operates two WP-3D Orion turboprops equipped with tail Doppler radar that scan a storm's internal wind field in three dimensions. Both aircraft types repeatedly release dropsondes — instrument packages roughly 35 cm (14 inches) long, containing pressure, temperature, humidity, and GPS sensors — that parachute from flight altitude down to the ocean surface in about 15 minutes, radioing back a vertical profile of the storm's structure the entire way down.
That observational data feeds into ensemble computer models, chiefly the American GFS, the European Centre for Medium-Range Weather Forecasts' ECMWF model, and the specialized HWRF hurricane model, which NHC forecasters blend by hand and judgment into the official forecast cone published every six hours. Track forecasting — predicting where a storm will go — has improved dramatically; NHC's own verification statistics show 48-hour track errors have been cut by roughly half over the past two decades. Intensity forecasting — predicting how strong a storm will be — has improved far less, and rapid intensification events like Milton's remain the field's most persistent forecasting failure mode, a gap NOAA has funded specific research programs to close.
For a related atmospheric-predictability problem, on a totally different scale of chaos, see our explainer on chaos theory and the butterfly effect — the same sensitivity-to-initial-conditions math that limits weather forecasting more broadly also caps how far in advance hurricane intensity can ever be predicted with precision.
Notable Hurricanes in History
- Galveston, 1900 — the deadliest natural disaster in US history, killing an estimated 8,000 or more people in a single night when a Category 4 storm struck an unprotected Texas barrier island with no modern warning system.
- Camille, 1969 — made landfall in Mississippi as one of only a handful of Category 5 hurricanes ever recorded at US landfall.
- Katrina, 2005 — the costliest hurricane in US history at the time; NOAA's most recent combined estimate puts direct and indirect deaths at 1,392, with damage of $125 billion in 2005 dollars (about $186 billion adjusted to 2024 dollars). Levee failures around New Orleans, not the storm's wind, caused the majority of the catastrophic flooding.
- Sandy, 2012 — a hybrid post-tropical storm at landfall that still drove a massive surge into New York Harbor, causing tens of billions of dollars in damage across the Northeast.
- Harvey, 2017 — nearly stalled over southeastern Texas, dumping in excess of 60 inches (152 cm) of rain in some locations, the highest tropical-cyclone rainfall total ever recorded in the continental United States.
- Maria, 2017 — devastated Puerto Rico's power grid; a Harvard T.H. Chan School of Public Health study estimated roughly 4,600 excess deaths in the storm's aftermath, though official government tallies and academic estimates have varied.
- Ida, 2021 — rapidly intensified into a Category 4 just before Louisiana landfall, then weakened but still produced deadly flash flooding as far north as New York City days later.
- Helene, 2024 — made landfall in Florida but caused its most catastrophic damage hundreds of kilometers inland, through record flooding in the Appalachian mountains of North Carolina and Tennessee.
- Milton, 2024 — underwent one of the fastest rapid-intensification episodes on record in the Gulf of Mexico before striking Florida as a major hurricane.
How Hurricanes Get Names
The World Meteorological Organization maintains six rotating alphabetical lists of names, alternating male and female, that cycle back every six years. Storms that cause exceptionally deadly or costly damage have their names formally retired by WMO committee vote, out of both respect for victims and to avoid confusion in historical records — Katrina, Maria, Sandy, Harvey, and Ian are among the names that will never be reused for an Atlantic storm again.
Climate Change and Hurricanes
This is one of the most heavily studied — and most frequently misrepresented in casual conversation — corners of climate science, because the honest answer has several separate parts rather than one soundbite.
1. Rapid intensification is becoming more common. A 2022 study by Bhatia and colleagues, published in Nature Communications, found a statistically significant increase in the frequency of Atlantic storms undergoing rapid intensification episodes over the satellite era, consistent with warmer upper-ocean heat content providing more fuel for the WISHE feedback loop described above.
2. Storms are producing more rainfall. The Clausius–Clapeyron relation, a well-established thermodynamic law, predicts that the atmosphere's water-holding capacity rises by roughly 7% for every 1°C of warming. Attribution studies of Hurricane Harvey's extreme rainfall found a meaningful fraction of the storm's record totals were made more likely, and more intense, by human-caused warming.
3. Storm surge is worsening independent of storm strength. Global mean sea level has risen roughly 21–24 cm (8–9 inches) since 1880 according to NOAA's tide-gauge and satellite records, which means the exact same wind-driven surge from an identical storm now floods further inland than it would have a century ago.
4. Total storm frequency shows no strong, consistent trend. This is the finding most often missed in casual summaries: climate models and observational records do not show a robust increase in the raw number of tropical cyclones forming each year. What Kossin and colleagues' 2020 study in the Proceedings of the National Academy of Sciences did find is a rising proportion of storms that reach major-hurricane intensity, a distinct and more defensible claim than "more hurricanes are forming."
5. Storms may be moving more slowly over land. Some research points to a slowing trend in tropical cyclone translation speed — how fast the storm itself moves across the map, as opposed to its internal wind speed — which, if it holds up in longer records, would mean any given location sits under a storm's rain shield for longer, compounding flood risk.
For the mechanism behind one specific, well-quantified greenhouse gas driving these ocean-temperature trends, see our explainer on why methane matters for climate change.
What People Get Wrong About Hurricanes
"The eye means the storm is over." This is the single most dangerous misconception in hurricane safety, and it has killed people who left shelter during the eye's calm only to be caught by the second eyewall, which arrives with a wind-direction reversal and often the same or greater intensity as the first.
"A lower category number means it's not that dangerous." Because the Saffir–Simpson scale measures only wind, a "weak" Category 1 or even a tropical storm can still produce catastrophic, life-threatening rainfall flooding — Harvey's most extreme impacts came after it had already weakened from its peak intensity, and Helene's deadliest damage occurred far from the coast, well after landfall weakening had begun.
"Bigger storms are always stronger storms." Physical size (the diameter of tropical-storm-force winds) and intensity (peak sustained wind speed) are two different, only loosely correlated properties. Hurricane Sandy was physically enormous but only a Category 1-strength (and eventually post-tropical) system at landfall; its damage came from its size and surge, not from extreme peak winds.
"Hurricanes only hit the coast." Helene's Appalachian flooding and Ida's remnant flash flooding in New York City, both hundreds of kilometers from where the storms made landfall, are recent, well-documented reminders that a weakening hurricane's moisture can produce deadly inland flooding days after the wind threat has passed.
"Climate change is creating more hurricanes." As covered above, the more defensible, evidence-backed claim is that a larger share of the hurricanes that do form are reaching major intensity, intensifying faster, and dropping more rain — not that the annual storm count itself is rising in a clear, consistent way.
Frequently Asked Questions
Q: What's the difference between a hurricane, typhoon, and cyclone? A: Nothing physically — they are the same kind of storm, undergoing the same warm-ocean-fueled process. The name depends only on where it forms: hurricane in the Atlantic and Eastern Pacific, typhoon in the Western Pacific, and cyclone in the Indian Ocean and around Australia.
Q: Why is the eye of a hurricane calm? A: Air in the eye is sinking rather than rising. Sinking air compresses and warms as it descends, which suppresses cloud formation, so the eye is relatively clear and calm while the surrounding eyewall carries the storm's most violent winds and rain.
Q: Can hurricanes form on the equator? A: Essentially no. The Coriolis force, which supplies the spin that organizes a storm's circulation, is close to zero at the equator and only becomes strong enough to matter roughly 5 degrees of latitude away from it, even where sea-surface temperatures are warm enough.
Q: What kills most people in hurricanes? A: Water, not wind. Depending on the time period studied, storm surge and rainfall-driven inland flooding together account for roughly 85–90% of direct US tropical-cyclone deaths, even though the official Saffir–Simpson scale that categorizes storms is based on wind speed alone.
Q: Is climate change making hurricanes more frequent? A: The evidence for a rising annual storm count is weak or inconclusive. What's well-supported is that a growing share of the storms that do form are reaching major-hurricane intensity, intensifying more rapidly, and producing heavier rainfall, according to peer-reviewed studies from Bhatia et al. (2022) and Kossin et al. (2020).
Q: Why do hurricanes weaken over land? A: They lose their fuel supply. The storm's engine depends on continuous evaporation of warm ocean water; once it moves over land that supply is cut off almost entirely, and increased surface friction from terrain further disrupts the storm's low-level circulation, typically cutting intensity roughly in half within about 12 hours of landfall.
Q: What is rapid intensification, and why is it so hard to forecast? A: The NHC defines it as a wind-speed increase of at least 30 knots (about 35 mph) within 24 hours. It happens when all five formation ingredients — warm water, low shear, Coriolis spin, a seed disturbance, and moist mid-levels — align near-ideally at once, and forecasters currently cannot reliably predict in advance which storms will hit that alignment, making it one of the biggest remaining gaps in hurricane science.
Q: How do scientists measure a hurricane's total destructive potential across a whole season? A: Via the Accumulated Cyclone Energy (ACE) index, which sums the square of a storm's maximum sustained wind speed every six hours for as long as it stays at tropical-storm strength or higher. A season with fewer, longer-lived, more intense storms can post a higher ACE total than a season with many short-lived weak ones.
Q: How do meteorologists actually measure conditions inside a hurricane? A: US Air Force Reserve WC-130J aircraft and NOAA's WP-3D Orion turboprops fly directly into storms and release dropsondes — small instrument packages that parachute from flight altitude to the ocean surface in about 15 minutes, radioing back continuous pressure, temperature, humidity, and wind readings that feed directly into forecast models.
Q: Why did the Saffir–Simpson scale used to include storm surge, and why was that dropped? A: An earlier version of the scale included rough surge-height estimates by category, but NHC removed them in 2010 because surge depends heavily on coastline shape, tide timing, and storm size and speed, not on wind alone, so a single category number could not reliably predict it. NHC now issues separate storm surge watches and inundation maps instead.
The takeaway
A hurricane is not a mysterious force of nature so much as a predictable heat engine: warm ocean water evaporates, that vapor's condensation releases latent heat, the heat drives stronger updrafts, and Earth's rotation twists the whole system into a spinning column, as long as the upper atmosphere stays calm and moist enough to let it build. Understanding that mechanism explains almost everything counterintuitive about hurricanes — why the calm eye is a trap rather than an ending, why a "weak" storm can still be a rainfall catastrophe, and why the same warming ocean that fuels these storms is making the strongest ones stronger and wetter even without necessarily making them more numerous.
Read next:
- How Tornadoes Form — Tornado Science Explained
- Why Methane Matters for Climate Change
- Chaos Theory and the Butterfly Effect Explained
Sources
- National Hurricane Center (NOAA) — Saffir-Simpson Hurricane Wind Scale
- NOAA Climate.gov — Hurricane Milton Rapid Intensification
- Congressional Research Service — Hurricane Rapid Intensification: In Brief (R48212)
- Bhatia, K. T. et al. (2022). Recent increases in tropical cyclone intensification rates. Nature Communications.
- Kossin, J. P. et al. (2020). Global increase in major tropical cyclone exceedance probability over the past four decades. PNAS.
- NOAA — Storm Surge, the Deadliest Threat from Tropical Cyclones
- Yale Climate Connections — What New Data Reveal About How Hurricanes Kill
- NOAA NCEI — Katrina at NCEI: 20 Years Ago
- NHC — Tropical Cyclone Report: Hurricane Katrina
- NOAA Office of Marine and Aviation Operations — Hurricane Hunters
- World Meteorological Organization — Tropical Cyclone Naming
- Emanuel, K. (2005). Divine Wind: The History and Science of Hurricanes. Oxford University Press.
Follow new articles
Add SciHub101 to your feed reader to see new science and technology stories.
About the Author
SciHub101 is an independent science and technology publication founded and edited by Buğra Sözeri, a software engineer and app developer based in Türkiye. AI tools assist with drafting and research. Source documentation in the existing archive is uneven, and articles are being reviewed and corrected. The Editorial Team byline identifies editorial responsibility; it does not certify specialist or independent human review. Where we compare products, anything built by our own team is labelled as such — see the editorial guidelines and About page for how corrections and disclosures work.
Related Articles

What Is Gravity? From Newton to Einstein
Gravity explained: Newton's universal law, Einstein's curved spacetime, gravitational waves, and why GPS satellites must correct for it.

How the Sun Works — Nuclear Fusion Powered Star
How the Sun works: proton-proton fusion in the core, layers from radiative zone to corona, solar wind, sunspots, and the Sun's far future.

The Strongest Winds Ever Recorded on Earth
The strongest surface wind gust ever officially recorded was 408 km/h on Barrow Island, Australia, during Tropical Cyclone Olivia in 1996. But the answer changes if you mean one-minute sustained tropical cyclone winds, tornado winds, jet stream winds, or winds measured away from Earth's surface. This guide explains the real records, why they differ, and how meteorologists verify wind extremes.

What If HAARP Could Really Control the Weather? What Atmospheric Physics Says
HAARP is a real research facility studying the upper atmosphere. Conspiracy theorists claim it can control hurricanes, cause earthquakes, and modify weather. Here's why physics says no.

Why Do We See Our Breath When It's Cold? The Science
Exhaled air is warm and close to saturated with water vapor. When it mixes into cold air, the mixture cannot hold all of that vapor, and a small cloud of liquid droplets appears.

How Tornadoes Form — Tornado Science Explained
How tornadoes form: supercells, wind shear, mesocyclones, Tornado Alley, EF scale, deadliest tornadoes, warning systems, and what to do during one.