Water Scarcity: The Growing Global Crisis Explained
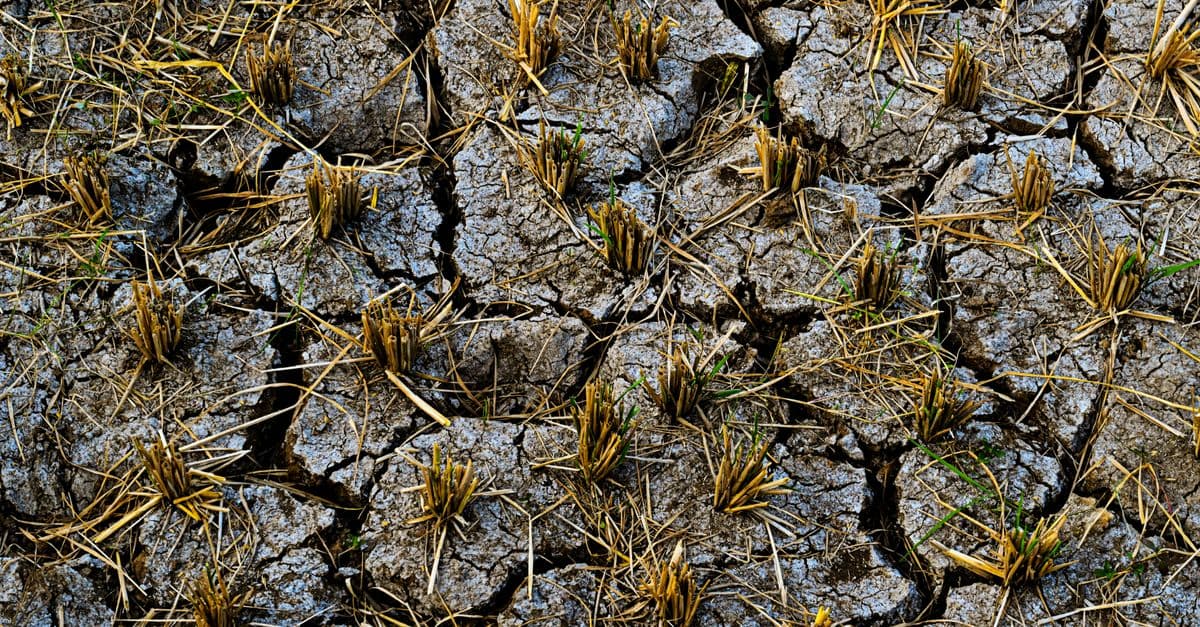
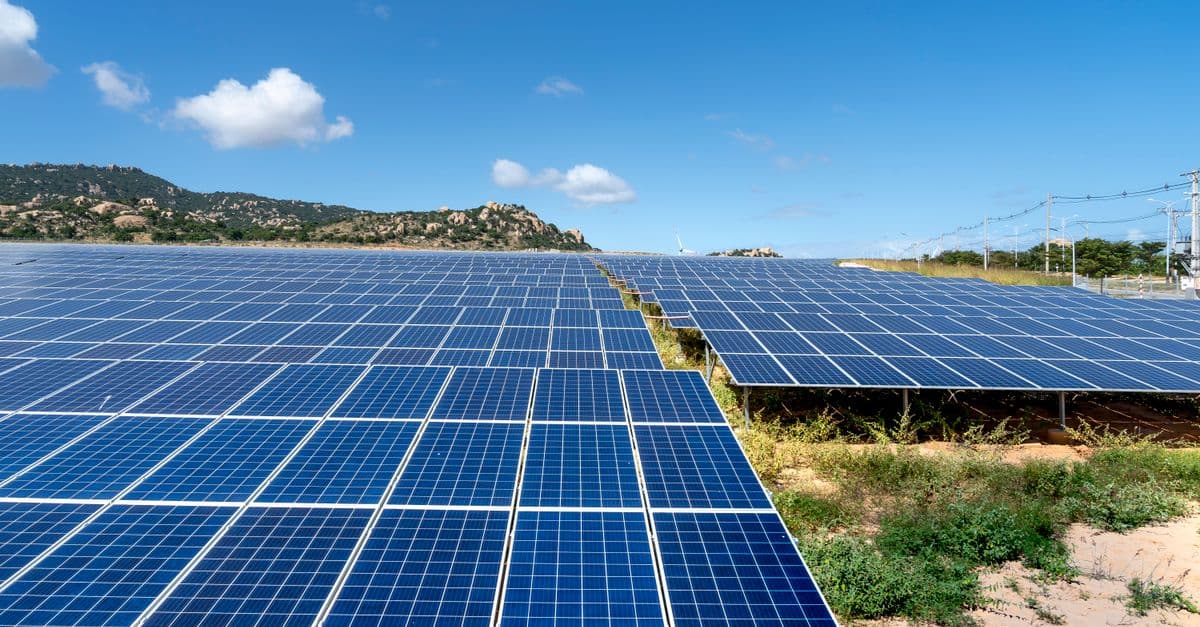
Photo: kevin yung / Pexels
Water covers 71 percent of Earth's surface, yet less than 3 percent of it is fresh, and two-thirds of that is locked in glaciers and ice caps. The accessible fraction — groundwater, lakes, rivers, and surface moisture — is the entire freshwater budget on which terrestrial life, agriculture, and industrial civilization depend. It is renewable, in the sense that rainfall replenishes it; but replenishment rates are fixed by geography and climate, while withdrawal rates are determined by population, economy, and technology. In an increasing number of regions, the withdrawal rate has exceeded the replenishment rate for decades. The result is a slow but accelerating liquidation of water capital that had been accumulating underground since the last ice age.
Physical vs. Economic Water Scarcity: A Necessary Distinction
Physical water scarcity — a condition in which a region's water demand exceeds the available supply, regardless of infrastructure or economic capacity. Water physically does not exist in sufficient quantity to meet all uses.
Economic water scarcity — a condition in which water physically exists in a region but cannot be accessed by the population that needs it, due to lack of infrastructure, financial resources, institutional capacity, or political barriers.
This distinction matters because it points to different solutions. Physical scarcity requires reducing demand, developing new sources (desalination, wastewater recycling), or large-scale redistribution. Economic scarcity requires investment in infrastructure and institution-building — pipes, treatment plants, governance systems — in regions where the engineering problem is solvable but the political and financial will is absent.
The same population can face both simultaneously. Sub-Saharan Africa provides the clearest example: many countries in the region have substantial surface water and groundwater resources in absolute terms, but those resources are inaccessible to large parts of the population because of inadequate infrastructure and lack of institutional capacity to manage and distribute water safely. Meanwhile, in other regions — the Arabian Peninsula, parts of northern Africa and southwestern North America — physical scarcity is the primary constraint, and no amount of infrastructure investment can create water that the hydrological cycle does not deliver.
A 2024 study in Nature Communications found that for the first time, global water demand exceeded sustainable supply at a global level — what the researchers called "unprecedented global water scarcity in the Anthropocene." This does not mean the world is running out of water in aggregate. It means the distribution of demand and supply has reached a point where, across all regions summed, withdrawals exceed sustainable renewable supply.
Source: Doell, P. et al. (2024), "The first emergence of unprecedented global water scarcity in the Anthropocene," Nature Communications — modeling study estimating global freshwater stress for the first time exceeds sustainable supply thresholds.
Source: FAO (2021), "Aquastat: Global Water Resources," Food and Agriculture Organization of the United Nations — the authoritative database on global freshwater availability, use by sector, and national water stress indicators.
Agriculture's 70 Percent Share: Where the Water Actually Goes
The dominant fact of global freshwater use is agriculture. Globally, approximately 70 percent of all freshwater withdrawals from surface and groundwater sources go to irrigated agriculture. In some countries and regions the figure is higher: in parts of Central Asia, the figure exceeds 90 percent.
The scale of irrigated agriculture is a 20th-century phenomenon. In 1900, global irrigated area was approximately 50 million hectares. By 2020, it had expanded to approximately 340 million hectares. This expansion, enabled by groundwater pumping technology, was the physical basis for the Green Revolution — the dramatic increase in crop yields from the 1960s to 1980s that fed a doubling world population. The same technology that enabled the Green Revolution is now depleting the aquifers that made it possible.
| Sector | Global freshwater withdrawal share |
|---|---|
| Agriculture (primarily irrigation) | ~70% |
| Industry (power generation, manufacturing) | ~19% |
| Municipal (drinking water, sanitation) | ~11% |
Irrigation efficiency is the key variable. Flood irrigation — the oldest and most common method, in which water is simply released onto a field — delivers approximately 35–40 percent of water to crops; the rest evaporates, runs off, or percolates below the root zone. Drip irrigation, which delivers water directly to root zones through a network of pipes and emitters, achieves efficiencies of 70–90 percent. Sprinkler systems fall between. The gap between average current efficiency and achievable efficiency with existing technology represents a large potential reduction in agricultural water demand without reducing food production.
Israel is the most cited example of agricultural water efficiency at national scale. Drip irrigation was developed in Israel (by Simcha Blass in the 1960s), and the country now recycles approximately 87 percent of its treated wastewater for agricultural reuse — the highest rate in the world. These practices have enabled Israel to maintain a productive agricultural sector despite being located in a semi-arid climate with minimal river systems.
Source: FAO (2020), "The State of Food and Agriculture 2020: Overcoming Water Challenges in Agriculture," Food and Agriculture Organization of the United Nations — comprehensive analysis of agricultural water use, efficiency gaps, and irrigation technology options.
Source: Gleick, P.H. (2014), "Water, Drought, Climate Change, and Conflict in Syria," Weather, Climate, and Society, Vol. 6 — analysis of the role of agricultural water stress in contributing to social instability.
The Aquifer Depletion Problem
An aquifer is a geological formation — typically sedimentary rock, gravel, or sand — that holds groundwater and allows water to flow through it. Aquifers are recharged by rainfall percolating down through the soil; the recharge rate depends on rainfall, soil type, land cover, and the geometry of the geological formation.
The critical distinction is between confined aquifers and unconfined (phreatic) aquifers. Unconfined aquifers sit at the top of the saturated zone and are directly recharged by rainfall. Confined aquifers are bounded above and below by impermeable rock layers; they may have recharge zones far from where they are pumped, and their recharge times can be measured in thousands of years. When confined aquifer water is pumped out, it is for most practical purposes a nonrenewable resource.
Several of the world's most agriculturally important aquifers are now in measurable long-term decline.
The Ogallala (High Plains) Aquifer, underlying eight U.S. states from South Dakota to Texas, irrigates approximately 30 percent of U.S. groundwater irrigation. It supports production of about $20 billion worth of food per year. The aquifer's average recharge rate is measured in millimeters per year; pumping rates are measured in centimeters per day in some areas. Southern portions of the Ogallala — particularly in Kansas and Texas — have already declined by more than 30 meters in some locations, and wells are being abandoned. USGS projections indicate that continued pumping will exhaust the accessible portion of the southern Ogallala within 50–150 years, depending on extraction rates and climate.
The Central Valley Aquifer in California, which underlies the most productive agricultural region in North America, has experienced sustained overdraft since at least the 1920s. GRACE satellite data (NASA's Gravity Recovery and Climate Experiment, which measures groundwater changes from space through tiny gravitational anomalies) found that California's Central Valley lost approximately 30 km³ of groundwater between 2003 and 2010 — a rate substantially exceeding recharge. The Sustainable Groundwater Management Act of 2014 established a framework for bringing all California groundwater basins to sustainable yield by 2040, requiring significant reductions in pumping.
The North China Plain Aquifer underlies one of the most densely populated and agriculturally intensive regions in the world. Studies published in Geophysical Research Letters estimated depletion rates of 8.3 km³ per year in the shallow aquifer and 2.5 km³ per year in the deeper confined aquifer beneath the plain. The region grows roughly 40 percent of China's wheat and 25 percent of its maize; the water enabling that production is being drawn from a resource that recharges over geological timescales.
Source: Gleeson, T. et al. (2012), "Water Balance of Global Aquifers Revealed by Groundwater Footprint," Nature, Vol. 488 — global assessment of groundwater depletion rates using a "groundwater footprint" approach, identifying regions where consumption exceeds sustainable yield.
Source: Scanlon, B.R. et al. (2012), "Groundwater depletion and sustainability of irrigation in the US High Plains and Central Valley," PNAS, Vol. 109 — quantitative analysis of Ogallala and Central Valley aquifer depletion using well data and GRACE satellite observations.
Cape Town's Day Zero: A Case Study in Urban Water Scarcity
Cape Town, South Africa's second-largest city with approximately 4.6 million people, came closer to exhausting its municipal water supply than any large city in a developed country in recent history. The crisis unfolded over three consecutive years of below-average rainfall (2015–2017) that progressively drew down the system of six reservoirs supplying the city.
Day Zero — the projected date on which dam levels would drop below 13.5 percent capacity, the threshold at which the municipality planned to shut off household taps and distribute water from collection points. At its closest approach in early 2018, Day Zero was projected for April 12, 2018, with reservoirs at approximately 22 percent.
The crisis response combined demand restriction and structural changes. In January 2018, the city reduced per-person water allocations to 50 liters per day — roughly one-fifth the average daily consumption in the United States. Enforcement included naming and shaming high consumers, tiered pricing that made heavy use extremely expensive, and inspections of agricultural users. Simultaneously, the city accelerated planning for emergency desalination plants and aquifer extraction from previously unused coastal aquifer systems.
Day Zero was avoided: a combination of rainfall improvement in mid-2018, dramatic demand reduction (from approximately 1.2 billion liters per day in 2015 to around 500 million liters per day by early 2018), and groundwater augmentation brought reservoir levels back to safe ranges by September 2018. The demand reduction — roughly 60 percent — exceeded what most water managers believed achievable under voluntary and price-based mechanisms.
The Cape Town experience carries several lessons. The city's water system was almost entirely surface-water-dependent and highly vulnerable to multi-year droughts. The absence of diversified supply sources (desalination, groundwater, recycled water) meant that the system had no buffer. The demand reduction that saved the city required months of extreme restrictions that would have been politically unsustainable for much longer. And climate change is projected to make Southern Africa drier on average, increasing the probability of recurrence.
Source: Muller, M. (2018), "Cape Town's drought: Don't blame climate change," Nature, Vol. 559 — analysis of the institutional and management failures contributing to the Cape Town crisis, in addition to the drought itself.
Source: Wolski, P. (2018), "How severe is Cape Town's 'Day Zero' drought?" Significance, Vol. 15 — statistical analysis of the drought's severity in historical context and the attribution of responsibility among rainfall reduction, population growth, and demand management failure.
Cities on the Edge: Who Is Next?
Cape Town is not unique. Multiple major cities globally face water supply vulnerabilities that share similar structural features: dependence on rainfall or snowmelt, rapid population growth, underinvestment in supply diversification, and increasing climate variability.
Chennai, India — In June 2019, four of Chennai's main reservoirs dried up completely, forcing the city of 7 million to rely on water trucked in from rural areas. The government deployed hundreds of tanker trucks daily. Groundwater in Chennai's suburbs had been depleted over decades by unregulated extraction; the crisis exposed the full extent of that depletion under drought conditions.
Mexico City, Mexico — The city of approximately 22 million people sits in a basin at 2,240 meters elevation. Its historic lakes were drained for development centuries ago. About 70 percent of its water supply comes from groundwater, and the aquifer has been declining for decades — the city is literally sinking, in some areas by 30–40 cm per year, as the water-bearing sediments compact. A 2024 dry season brought the city to severe water rationing.
Tehran, Iran — The capital and surrounding province face acute water stress. The Zayandeh River, historically the main surface water source for central Iran, has run dry in its lower reaches for most years since 2010. Groundwater depletion is severe and accelerating.
São Paulo, Brazil — In 2015, São Paulo's Cantareira reservoir system — supplying roughly 9 million people — fell to 4 percent of capacity. Emergency "dead volume" extraction, water rationing, and unusually heavy rainfall later in the year averted the worst outcomes.
The pattern across these cases is consistent: rapid urban growth, infrastructure that was not designed for current demand, heavy dependence on a single source type, and insufficient investment in supply diversification or demand management before a crisis forces the issue.
Source: Council on Foreign Relations (2023), "Water Stress: A Global Problem That's Getting Worse," cfr.org — comprehensive overview of global water stress, case studies of cities under stress, and geopolitical implications.
Source: World Resources Institute (2023), Aqueduct Water Risk Atlas — global database of water risk indicators by watershed, used by governments and businesses to assess and manage water-related risks.
Desalination: Promise and Limits
Desalination — removing salt from seawater or brackish water to produce fresh water — is the most reliable technology for generating new fresh water in coastal regions facing physical scarcity. The global desalination capacity has grown substantially: as of 2023, approximately 21,000 desalination plants operate worldwide, producing around 100 million cubic meters of fresh water per day, serving approximately 400 million people.
The two main technologies are thermal desalination (heating seawater to evaporate it, then condensing the fresh water vapor) and reverse osmosis (RO) (forcing seawater under pressure through a semi-permeable membrane that allows water to pass but blocks salt ions). Reverse osmosis now dominates new capacity, accounting for approximately 69 percent of global desalination output, because its energy requirements have dropped substantially as membrane technology has improved.
| Technology | Energy use | Typical application |
|---|---|---|
| Reverse osmosis (RO) | 3–10 kWh per m³ | Seawater and brackish water; most new plants |
| Multi-stage flash (MSF) | 10–25 kWh per m³ | Seawater; common in Gulf states |
| Multi-effect distillation (MED) | 6–12 kWh per m³ | Seawater; combined with thermal power plants |
The Saudi Arabian city of Riyadh — located approximately 400 km from the coast and 600 meters above sea level — is served almost entirely by desalinated water pumped from the Red Sea. The energy required for this (desalination plus pumping elevation) makes it one of the most energy-intensive urban water supplies in the world, running predominantly on fossil fuels. This underscores the core challenge with desalination: it is energy-intensive, and its carbon footprint depends entirely on the energy source.
Solar-powered desalination is technically proven at small and medium scales and is being deployed in some regions. Large-scale solar desalination would require substantial upfront investment in both the renewable energy and desalination infrastructure. In energy-abundant and water-scarce regions (the Arabian Peninsula, North Africa, parts of Australia and California), the economics are increasingly favorable as solar costs fall.
Brine disposal is the underappreciated challenge of desalination. For every cubic meter of fresh water produced, desalination generates roughly 1.5 cubic meters of highly concentrated saltwater brine. Disposed at low concentration in well-mixed coastal waters, brine is manageable. Disposed at high rates in shallow, low-circulation coastal environments, it raises salinity and temperature, damaging benthic ecosystems. The environmental impact of brine disposal at scale is not fully characterized and varies substantially by location and dilution conditions.
Source: Jones, E. et al. (2019), "The state of desalination and brine production: A global outlook," Science of the Total Environment, Vol. 657 — comprehensive survey of global desalination capacity, technology distribution, and brine production rates.
Wastewater Reuse and the Circular Water Model
The most water-efficient societies close the loop: treated wastewater is reused for agricultural irrigation, industrial processes, and (with additional treatment) drinking water. This approach — sometimes called "water recycling" or, for drinking water applications, "indirect potable reuse" — dramatically reduces net freshwater consumption.
Singapore's NEWater program is the most mature example of potable water reuse at city scale. Singapore imports approximately 50 percent of its water from Malaysia and is seeking energy independence from water imports. NEWater — highly purified reclaimed water — now meets about 40 percent of Singapore's total water demand and up to 55 percent during dry months. The water undergoes microfiltration, reverse osmosis, and UV disinfection before being blended into the reservoir system. Independent testing consistently finds NEWater exceeds WHO drinking water standards.
The "toilet-to-tap" framing that has created public resistance to potable reuse in some U.S. jurisdictions is a perceptual rather than a scientific objection. The treatment processes used in potable reuse produce water that meets or exceeds standards for conventional drinking water sources, which themselves often receive significant inputs from agricultural runoff, urban stormwater, and upstream wastewater discharges. The difference is in the directness of the cycle, not in the quality of the output.
California has moved to authorize direct potable reuse — bypassing the indirect step of blending into a reservoir — with regulations finalized in 2023. Several utilities are expected to have direct potable reuse operational by 2028.
Source: Tortajada, C. (2016), "Towards Non-Conventional Water Resources Usage in Singapore," International Journal of Water Resources Development, Vol. 32 — analysis of Singapore's integrated water management approach, including NEWater's role.
Source: California State Water Resources Control Board (2023), "Potable Reuse Regulations," swrcb.ca.gov — official regulatory framework for direct and indirect potable reuse in California.
Solutions That Work at Scale
The water crisis is a problem of collective action, institutional design, and political prioritization rather than fundamental technological limitation. Proven solutions exist. The barriers to implementation are primarily economic and political.
Demand management — pricing water to reflect its true cost of supply (including infrastructure, energy, and environmental externalities), combined with efficiency standards for agricultural and industrial users — consistently produces large demand reductions. Cape Town's crisis demonstrated that even extreme demand reduction is achievable under sufficient price and regulatory pressure. The same principles applied less dramatically produce substantial savings without crisis.
Agricultural efficiency — transitioning from flood to drip irrigation in the highest-water-use crops in the most water-stressed regions — is technically proven and would reduce agricultural water demand in those regions by 30–50 percent. The barrier is upfront cost (drip systems cost more to install than flood irrigation infrastructure) and the institutional capacity to provide technical assistance to smallholder farmers.
Groundwater governance — mandatory metering, licensing, and enforcement of pumping limits in depleting aquifers — is politically contentious because it requires reducing the economic activity of existing users. California's Sustainable Groundwater Management Act (2014) is the first attempt at this in a major U.S. agricultural state, and implementation has been slow and contested.
Wastewater reuse — with appropriate treatment and regulatory oversight — can close the loop in many urban water systems, essentially creating a supply that grows with population rather than shrinking with climate variability.
Desalination powered by renewable energy addresses physical scarcity in coastal regions and is becoming economically competitive as solar costs fall below $0.03/kWh in sunny regions.
No single intervention is sufficient. The cities and regions that have managed water sustainably — Singapore, Israel, some Dutch water boards — have combined multiple approaches across decades, with strong institutional frameworks and consistent investment.
Source: Gleick, P.H. & Palaniappan, M. (2010), "Peak water limits to freshwater withdrawal and use," PNAS, Vol. 107 — the concept of "peak water" applied to surface water, groundwater, and ecological flow requirements, with implications for sustainable supply limits.
Source: United Nations University (2023), "World Enters Era of Global Water Bankruptcy," unu.edu/inweh — the UNU-INWEH report formally defining the transition to a condition of water deficit at global aggregate scale.
The Takeaway
Water scarcity is the product of specific, measurable decisions: where to plant crops, how to build cities, how to price and govern water use, and how to invest in infrastructure that was designed for a different climate than the one arriving. The physics is not complicated: the aquifer that feeds the Central Valley produces food today and will be dry in a generation if current extraction rates continue. The chemistry is not complicated: desalination can produce drinking water from seawater at a cost that is rising to economic viability in an increasing number of settings. The biology is not complicated: more efficient irrigation produces the same crops with a fraction of the water. What is complicated — and what distinguishes regions that are managing water from those that are depleting it — is institutional: who has the authority to allocate water, at what price, to whom, and on what timeline. The technology to solve the water crisis exists. Whether it will be deployed at the necessary scale is a question about governance, not about science.
Frequently Asked Questions
Q: What is the difference between physical and economic water scarcity?
A: Physical water scarcity means a region's demand exceeds available water supply regardless of investment. Economic water scarcity means water exists but cannot be accessed due to lack of infrastructure, financial resources, or governance. Both conditions affect billions of people, but they require different solutions: supply development for physical scarcity, infrastructure and institutional investment for economic scarcity.
Q: Why does agriculture use 70 percent of freshwater?
A: Growing food requires large amounts of water because crops transpire water through their leaves as part of photosynthesis, and surface irrigation systems lose additional water to evaporation. The 70 percent figure reflects the combination of irrigated agriculture's large scale (340 million hectares globally) and the relatively low efficiency of common irrigation methods. Transitioning from flood to drip irrigation could substantially reduce this share without reducing food production.
Q: What happened during Cape Town's Day Zero crisis?
A: After three consecutive years of below-average rainfall (2015–2017), Cape Town's reservoir system fell to approximately 22 percent capacity by early 2018. Day Zero — when taps were to be turned off — was projected for April 2018. The city implemented 50-liter-per-person daily limits. Demand fell by about 60 percent, reservoir levels recovered with improved rainfall, and Day Zero was averted. The crisis exposed Cape Town's dependence on surface water without backup supply sources.
Q: Is desalinated water safe to drink?
A: Yes. Properly operated desalination plants, using reverse osmosis or thermal methods, produce water that meets or exceeds WHO and national drinking water standards. Energy use (3–10 kWh per cubic meter for RO) and brine disposal are the main environmental concerns, not water safety. Singapore's NEWater program and numerous Gulf state cities have operated desalination as a primary water source for decades.
Q: Which aquifers are most at risk of depletion?
A: The Ogallala (High Plains) Aquifer in the United States, the Central Valley Aquifer in California, the North China Plain Aquifer, and aquifers underlying parts of India, Pakistan, and Iran are among those showing the most severe long-term depletion according to GRACE satellite data and well-level monitoring. These aquifers have recharge rates far below current extraction rates in many areas.
Q: How many people currently face water scarcity?
A: According to the United Nations, approximately 2 billion people live in countries experiencing high water stress — where annual withdrawals exceed 40 percent of available renewable freshwater. The number experiencing acute seasonal scarcity (even in countries not classified as stressed annually) is estimated at 4 billion for at least one month per year, based on research published in Science Advances in 2016.
Read next:
Follow new articles
Add SciHub101 to your feed reader to see new science and technology stories.
About the Author
SciHub101 is an independent science and technology publication founded and edited by Buğra Sözeri, a software engineer and app developer based in Türkiye. AI tools assist with drafting and research. Source documentation in the existing archive is uneven, and articles are being reviewed and corrected. The Editorial Team byline identifies editorial responsibility; it does not certify specialist or independent human review. Where we compare products, anything built by our own team is labelled as such — see the editorial guidelines and About page for how corrections and disclosures work.
Related Articles
Countries That Consume the Most Electricity (Ranked)
China consumes more electricity than any other country — approximately 9,794 TWh in 2024, nearly 33 percent of global demand and more than the United States, India, Russia, and Japan combined. The United States ranks second at roughly 4,194 TWh. India is third and the fastest-growing major consumer. But total consumption obscures vast per-capita differences: Iceland, Norway, and Canada use far more electricity per person than China or India. This ranking covers total and per-capita electricity consumption with IEA and Ember data, methodology notes, and analysis of what drives the gaps.

How to Start a Sustainable Garden at Home: Composting, Native Plants, Soil Health, and No-Dig Methods
Starting a sustainable home garden requires understanding five core practices: composting organic waste (reducing landfill methane emissions and creating nutrient-rich soil amendment), selecting native plants adapted to local climate and water (reducing irrigation by 50–70% compared to exotic plants), building healthy soil through no-dig and mulching methods (improving water retention, reducing chemical inputs), water-wise gardening via mulch and irrigation optimization (cutting water use by 30–50%), and avoiding synthetic pesticides and fertilizers. A typical backyard garden (400–600 sq ft) requires 3–6 months to establish, costs $200–$500 for initial soil amendments and plants, and produces 50–150 lbs of vegetables or fruit annually depending on crop selection, reducing household food costs by $300–$600/year and offsetting 200–400 lbs of CO2 emissions from avoided food transport.

Direct Air Capture: How It Works, What It Costs, and Where It Fits
Direct air capture (DAC) machines pull carbon dioxide out of ambient air through chemical reactions, compress it, and either store it underground or use it in industrial processes. The technology works. The problem is energy and cost: today's plants spend between $400 and $1,000 per tonne of CO₂ removed, while nature-based alternatives cost $5–50 per tonne. DAC's role in climate strategy depends on whether those costs can fall by an order of magnitude — and how quickly.
How to Reduce Your Carbon Footprint: 20 High-Impact Actions (Ranked by Real Data)
The average person in a high-income country produces 16 metric tons of CO2-equivalent emissions annually. Half of this comes from four categories: transportation (27 percent), energy (home heating/cooling and electricity, 25 percent), food (14 percent), and consumption (goods and packaging, 14 percent). Reducing your carbon footprint requires action in these four areas. However, the impact varies dramatically. Flying four times per year generates 2 metric tons (12 percent of your footprint); driving 10,000 miles generates 2 metric tons; eating meat 5 times weekly for a year generates 0.5 metric tons. A household reducing driving 50 percent saves 1.5 metric tons per year; switching to a renewable-energy grid saves 2–4 metric tons annually; adopting a plant-dominant diet saves 0.3–1 metric ton per year. This guide ranks reduction actions by real-world impact (based on life-cycle assessment studies and carbon accounting data), separates high-impact actions from feel-good gestures, and addresses the systemic limitations of individual action. The highest-impact step is also the most difficult: reduce air travel. The second-highest is home energy efficiency. The third is dietary shift. Together, these three actions can reduce emissions by 40–60 percent; the remaining 20 actions add incremental improvements.
Countries with the Most Freshwater Resources (Ranked)
Brazil has the world's largest total renewable freshwater resources — approximately 8,647 cubic kilometers per year, more than any other country and roughly 20 percent of the global total. Russia is second at 4,525 km³/year, Canada third at 2,860 km³/year. But total volume is only part of the story: Canada's per-capita freshwater availability is 36 times higher than China's. And water stress — not total availability — is the defining water challenge of the twenty-first century. This ranking covers the top 20 countries by total renewable freshwater resources, sourced from FAO AQUASTAT, with per-capita comparison and analysis of global water scarcity.
Countries That Produce the Most Solar Power (Ranked)
China installed 278 GW of new solar capacity in 2024 alone — more than the entire installed base of the United States. With 888 GW of total solar PV capacity, China now hosts nearly half of all solar power on Earth. This article ranks the top solar nations by installed capacity and explains how the global solar revolution became so geographically concentrated.