Climate Change Explained — The Science, Causes, and Consequences
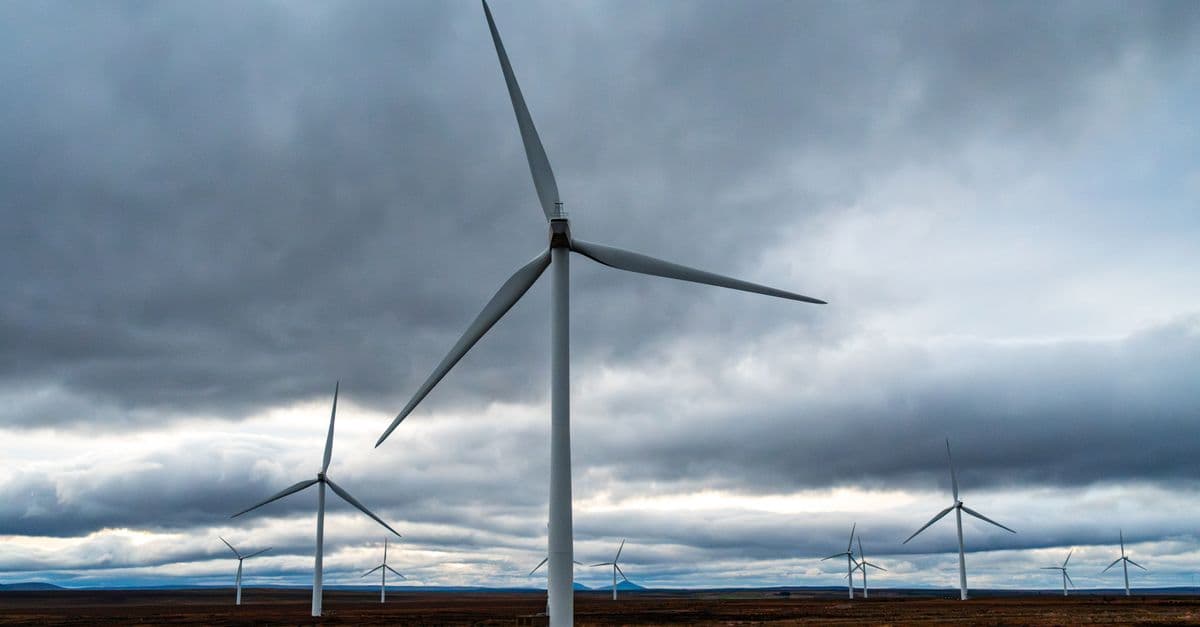
Photo: Michał Robak / Pexels
Climate change is the most consequential environmental challenge of our time. The basic science was settled in the 19th century, the human contribution was confirmed by mid-20th century, and every scientific institution on Earth now agrees on the broad picture. The questions today aren't "is it real?" but "how bad will it get?" and "what do we do about it?"
Here's the science — and what science actually predicts about the next century.
Key takeaways
- The greenhouse effect was discovered in 1859; the role of CO₂ has been understood for over a century.
- Earth has warmed about 1.2°C since the late 1800s, with more than half of that since 1980.
- Human emissions of CO₂, methane, and other gases are the dominant cause.
- Effects include sea level rise, extreme weather, ecosystem disruption, and water/food insecurity.
- Limiting warming to below 2°C is possible but requires rapid, large-scale changes.
The basic science
The greenhouse effect
Earth radiates heat back into space as infrared light. Some atmospheric gases — water vapour, CO₂, methane, nitrous oxide — absorb this infrared radiation, trapping heat near the surface. This is called the greenhouse effect.
It's a good thing, in moderation. Without any greenhouse effect, Earth's average temperature would be -18°C. With the natural greenhouse effect, it's +15°C. Most of life depends on this warming.
The problem: when greenhouse gas concentrations rise, more heat gets trapped, and average temperature rises.
Why CO₂ matters most
CO₂ is the dominant human-emitted greenhouse gas because:
- We emit a lot of it (35+ billion tonnes/year).
- It stays in the atmosphere for hundreds to thousands of years.
- It's directly tied to fossil fuel combustion — the energy source of modern civilisation.
Methane is more potent per molecule but breaks down in ~12 years. CO₂ is the long-term driver.
Pre-industrial vs today
Atmospheric CO₂ has been measured precisely since 1958 (Keeling curve at Mauna Loa). It was 280 ppm before industrialisation, ~424 ppm in 2024. That's a 50% increase in less than 200 years.
Ice cores tell us the prior 800,000 years stayed between 180 and 300 ppm. The current level is the highest in at least 3 million years, possibly 15 million.
How we know it's human-caused
Multiple independent lines of evidence converge:
Isotope signatures
Carbon has multiple isotopes (¹²C, ¹³C, ¹⁴C). Fossil fuels are enriched in ¹²C and depleted in ¹⁴C. The atmosphere shows exactly the isotope shift expected from burning fossil fuels.
Pattern of warming
If the Sun caused warming, all atmospheric layers should warm. Greenhouse warming has a specific signature: surface and lower atmosphere warm, upper stratosphere cools. We observe exactly this.
Match with predicted patterns
Greenhouse warming is greater at night than day, greater in winter than summer, greater at high latitudes. Observed warming matches all these signatures.
Match with emissions
The acceleration of warming matches the acceleration of emissions over the past century, with appropriate lag for thermal inertia.
Failure of alternatives
Solar variation, natural cycles, volcanic activity, internal variability — all measurable, none sufficient to explain observed warming.
This is why the IPCC says human influence is "unequivocal" — the strongest possible scientific language for a causal claim.
What's already happening
Temperature
Global average temperature has risen 1.2°C since 1850. Land has warmed ~2x faster than ocean. The Arctic ~3-4x faster than global average.
Ice
- Greenland ice sheet losing 270 billion tonnes/year.
- Antarctic ice sheet losing 150 billion tonnes/year.
- Arctic sea ice extent declining 13% per decade in summer.
- Glaciers worldwide losing mass.
Sea level
Risen ~22 cm since 1880. Currently rising 4.5 mm/year and accelerating. Projected to rise 30-100 cm by 2100, depending on emissions.
Extreme weather
Heat waves, intense rainfall, droughts, and wildfires are all increasing in frequency and intensity. Hurricanes are intensifying faster on average.
Ecosystems
- Coral reef bleaching events increasing.
- Species shifting poleward and to higher elevations.
- Mismatched timing in food chains (e.g. plant flowering before pollinators emerge).
- Increasing extinctions linked to rapid environmental change.
Future projections
The IPCC's most recent assessment uses scenarios ranging from rapid emissions cuts to continued growth:
1.5°C scenario (rapid action)
- Net zero emissions by ~2050.
- Sea level rise: ~30-60 cm by 2100.
- Most coral reefs lost.
- Manageable adaptation for most regions.
2°C scenario (significant action)
- Net zero by ~2070.
- Sea level rise: ~40-70 cm.
- Severe ecosystem stress.
- Many regions face significant climate adaptation costs.
3°C+ scenario (current trajectory)
- Sea level rise: 60-100+ cm.
- Major regional impacts: collapse of food production in some regions, mass displacement.
- Risk of triggering tipping points (Amazon dieback, Arctic methane release, ice sheet collapse).
The current pledged-policy path is around 2.5-2.8°C — better than projected a decade ago, but still well above safe levels.
Feedback Loops: Why Warming Accelerates Itself
A critical mechanism that amplifies climate change is positive feedback loops — changes that trigger further warming:
Ice-albedo feedback
Albedo is reflectivity. Ice and snow are highly reflective; they reflect solar heat back to space. As ice melts, darker ocean or land is exposed, which absorbs more heat, causing more ice melt. This is why Arctic regions warm 3–4× faster than the global average.
Water vapor feedback
Warmer air holds more moisture. Water vapor is itself a greenhouse gas. As temperatures rise, atmospheric water vapor increases, trapping more heat. This feedback amplifies warming by roughly 50% on top of the direct CO₂ effect.
Carbon cycle feedback
Warming can release carbon stored in soils, permafrost, and oceans — releasing further CO₂ and methane. Permafrost contains roughly twice as much carbon as currently in the atmosphere; even 5–10% thaw releases significant greenhouse gases.
Source: IPCC (Intergovernmental Panel on Climate Change). (2021). "Climate Change 2021: The Physical Science Basis." Sixth Assessment Report. — Comprehensive synthesis of feedback loops and amplification mechanisms.
These feedback loops don't make warming unstoppable, but they do make it harder to control. They're why 1.5°C and 2°C aren't arbitrary targets — they represent thresholds where certain feedback loops become more active and harder to reverse.
Regional Impacts: Where Climate Change Hits Hardest
Climate change is not uniform. Some regions face far greater risks:
Small island states
Sea level rise directly threatens existence. Tuvalu, Marshall Islands, Maldives face inundation within decades at current trajectory.
Sub-Saharan Africa
Expected to see largest temperature increases (3–4°C by 2100 in 3°C scenario), with water stress and crop production disruption in regions already vulnerable to drought.
South Asia
Monsoon timing and intensity changes threaten agricultural production for ~3 billion people. Glacial melt in Himalayas threatens water supplies for 2 billion+.
North America and Europe
Yield challenges for wheat, corn in current production regions; heat stress in cities; shifting disease vectors. Wealthier regions adapt more easily but still face significant costs.
Source: UNEP (United Nations Environment Programme). (2023). "Regional Climate Change Impacts." — Summary of differential regional vulnerabilities.
Arctic communities
Thawing permafrost undermines infrastructure. Indigenous communities face disruption of traditional hunting and food systems.
The Ocean's Role: The World's Largest Carbon Sink and Climate Stabilizer
The oceans cover 71% of Earth's surface and play a dual role in climate: they absorb and store enormous amounts of CO₂ and heat, and they are simultaneously the most vulnerable system to climate change.
Ocean carbon absorption: The ocean absorbs about 25–30% of human CO₂ emissions. This sounds beneficial — it reduces atmospheric CO₂ — but it has consequences. When CO₂ dissolves in seawater, it forms carbonic acid, lowering pH. This process is called ocean acidification — the pH of ocean surface waters has dropped 0.1 units since industrialisation (a 30% increase in acidity). Shells and skeletons of organisms made from calcium carbonate (pteropods, corals, plankton) become harder to build in acidified water.
Thermal inertia: The ocean has enormous heat capacity — it absorbs 90% of excess heat from greenhouse warming. This has a paradoxical effect: it slows surface warming (buffering the climate system) but stores heat that will cause continued warming even if emissions stop. This is why we're committed to further warming even under zero-emission scenarios.
Ocean circulation and nutrient cycling: Warmer waters are less dense and less likely to sink, which disrupts the thermohaline circulation — the global ocean "conveyor belt" that transports nutrients and regulates regional climates. Disruption of this circulation could have severe impacts on fish populations and regional weather patterns. The Atlantic Meridional Overturning Circulation (AMOC), which includes the Gulf Stream, has weakened ~15% since the mid-20th century.
Sea level rise mechanics: Rising seas result from two mechanisms: thermal expansion (water expands as it warms, accounting for ~50% of rise) and mass loss from ice sheets and glaciers (the other ~50%). Greenland's ice sheet contains enough ice to raise sea level ~7 meters if fully melted; Antarctica contains enough for ~58 meters. Current loss rates are accelerating due to feedback loops (darker water exposed by melting ice absorbs more heat).
Source: NOAA (National Oceanic and Atmospheric Administration). (2023). "Ocean Acidification and Warming: Impacts on Marine Life." — Synthesis of ocean chemistry and circulation changes.
Source: Slangen, A. B. A., et al. (2016). "Anthropogenic influence on sea level rise around the United States." Nature Climate Change 6(6): 563–566 — Attribution of sea level rise to human activities.
Tipping Points: When Climate Changes Become Irreversible
Climate scientists have identified several tipping points — thresholds beyond which climate changes accelerate or become self-sustaining and difficult to reverse.
The West Antarctic Ice Sheet collapse: If ocean warming reaches critical levels around West Antarctica, the ice sheet could collapse in 100–1000 years, raising sea level by ~3–4 meters. Once started, this process may be unstoppable regardless of emissions reductions because it's driven by internal ice-ocean dynamics.
Amazon rainforest dieback: The Amazon generates much of its own rainfall through evapotranspiration. Deforestation and warming could push it past a threshold where it transitions from tropical forest to savanna. This would release 150–200 billion tonnes of CO₂, further accelerating warming. Recent research suggests 20–25% deforestation (current level is ~17–20%) could trigger this transition.
Permafrost methane release: Frozen soils contain organic matter that produces methane when thawed. Permafrost warming has already begun releasing significant methane; large-scale thaw could create a self-sustaining feedback loop of warming driving methane release driving further warming.
Atlantic Meridional Overturning Circulation shutdown: This could reduce heat transport to Europe, potentially causing regional cooling even as the globe warms. Evidence suggests it has weakened 15% already; collapse is possible (though debated) in a 2–3°C warming scenario.
The challenge with tipping points is uncertainty. We don't know the exact thresholds, and once crossed, they're costly or impossible to reverse. This is why climate targets focus on limiting warming below critical levels rather than betting on recovery.
Source: Lenton, T. M., et al. (2008). "Tipping elements in the Earth's climate system." Proceedings of the National Academy of Sciences 105(6): 1786–1793 — Identification and analysis of climate tipping points.
Source: Boulton, C. A., et al. (2022). "Assessing the proximity of the Amazon to the tipping point of the dieback." Science Advances 8(47): eabm6339 — Evidence on Amazon forest resilience.
Climate Sensitivity and Why Predictions Vary
Climate sensitivity is the amount of warming expected from a doubling of atmospheric CO₂. Understanding this is critical to predicting future warming.
If CO₂ doubles from 280 ppm to 560 ppm without any feedback loops, the direct warming would be ~1.2°C (this is well-understood physics). But feedback loops amplify this:
- Ice-albedo feedback (melting ice reflects less sunlight): +20–25% amplification
- Water vapor feedback (warmer air holds more moisture, a greenhouse gas): +50% amplification
- Cloud feedbacks (uncertain): +20% to −10% depending on cloud type and altitude
- Carbon cycle feedback (warming releases soil carbon): +10–15% amplification
These feedbacks combine to multiply the warming. The IPCC estimates climate sensitivity at 2.5–4°C per doubling of CO₂, most likely ~3°C. This uncertainty (2.5–4°C) propagates into future projections. The difference between 2.5°C and 4°C sensitivity means the difference between managing climate change and facing cascading tipping points.
Recent estimates based on paleoclimate data, instrumental records, and modeling narrowed the range to 2.6–4.1°C, still spanning uncertainty. This is why projections for 2100 range from 1.5–4°C+ depending on both emissions scenarios and climate sensitivity.
Source: Sherwood, S. C., et al. (2020). "An assessment of Earth's climate sensitivity using multiple lines of evidence." Reviews of Geophysics 58(4): e2019RG000678 — Comprehensive synthesis of climate sensitivity estimates.
Economic Costs and Benefits of Action
The economic case for climate action is straightforward but often misunderstood:
Costs of inaction: Damage estimates range from 5–20% of global GDP by 2100 in a 3°C+ scenario (agricultural losses, infrastructure damage, health costs, displacement, conflict). Some single events (Hurricane Katrina, 2023 Pakistan floods, Australian bushfires) already cost tens of billions.
Costs of action: Transitioning to net zero energy is estimated at 1–3% of global GDP annually through 2050 — large but manageable, especially if spread across decades. Moreover, renewable energy is now often cheaper than fossil fuels operationally.
Net calculation: Action costs ~1–2% annually to avoid ~5–20% of GDP in damage. The math strongly favors action.
Source: Stern, N. (2007). "The Stern Review on the Economics of Climate Change." — Landmark economic analysis of climate costs and benefits of mitigation.
However, costs and benefits are unevenly distributed. Wealthy nations can afford to adapt; poor nations cannot. This creates a major equity problem: those least responsible for emissions face the largest impacts.
What Can Be Done
Energy transition
Replace fossil fuels with renewables (solar, wind), nuclear, hydroelectric. Wind and solar are now cheaper than fossil fuels in most markets. The challenge is speed of deployment and grid integration. Projections suggest renewable energy can be 80%+ of global electricity by 2050 with existing technologies.
Electrification
Electrify transport (EVs replacing combustion vehicles), heating (heat pumps), and industry. Combined with a clean grid, this drives major emissions cuts. Transportation accounts for 27% of global emissions; shifting to EVs is the single largest opportunity.
Energy efficiency
Better insulation, more efficient appliances, smarter grids. Often the cheapest emissions reductions. Efficiency improvements alone could cut 40%+ of global energy demand with existing technology.
Land use and agriculture
Stop deforestation (accounts for ~10% of global emissions). Restore forests and wetlands (carbon sinks). Reduce methane from livestock (methane is 28–36x more potent than CO₂ over 100 years) and rice. Shift toward sustainable agriculture and reduced meat consumption.
Carbon removal
Direct air capture, bioenergy with carbon capture, enhanced weathering. Currently expensive (100–300+ USD/tonne) but likely necessary at scale by mid-century to reach net zero. Technology is improving and costs are falling.
Adaptation
Sea walls, drought-resistant crops, water management, climate-resilient infrastructure. Increasingly important regardless of emissions trajectory. Adaptation alone cannot limit warming, but it reduces damage.
Scientific Consensus and Why It Matters
The scientific consensus on human-caused climate change is exceptionally strong: 97%+ of actively publishing climate scientists, every major scientific organisation (NASA, NOAA, National Academy of Sciences, Royal Society, etc.), and the IPCC all agree on the core facts.
This consensus doesn't mean there's no uncertainty — there is (regional impacts, exact tipping points, optimal policy responses are debated). But the basic picture is settled: warming is real, human-caused, and requires action.
Source: Cook, J., et al. (2016). "Consensus on consensus: A synthesis of consensus estimates on human-caused global warming." Environmental Research Letters 11(4): 048002 — Meta-analysis of scientific consensus.
Common misconceptions
"Climate has changed before"
True, but never this fast. Past natural changes happened over thousands or millions of years. Human-caused changes are happening over decades. Ecosystems can't adapt that fast.
"It's the Sun"
Solar activity has been measured precisely for decades. It hasn't increased in pattern that matches recent warming. Recent solar activity has actually been slightly declining.
"CO₂ is plant food"
True at the cell level, but the warming, water stress, and pest outbreaks caused by climate change generally outweigh CO₂ fertilisation effects in the field.
"It's natural cycles"
Studied and accounted for. None match the pattern, magnitude, or speed of recent warming.
"Scientists disagree"
The basic science is uncontested across virtually every climate scientist and scientific organisation. Genuine disagreements exist on details (regional impacts, exact tipping points, optimal policy responses) — not on whether climate change is real or human-caused.
"It's too late"
False. Each tenth of a degree avoided meaningfully reduces impacts. Even if 1.5°C is missed, 2°C is much better than 3°C, which is much better than 4°C.
The Takeaway
Climate change is real, human-caused, measurable, and already affecting every region on Earth. The science has been settled for decades; the primary obstacle is political will, not scientific uncertainty. We have the technologies needed to limit warming to 1.5–2°C, but we're currently on track for 2.5–2.8°C — still better than the 3–4°C we'd face under unchanged policy, but below the target needed to avoid severe impacts. Every tenth of a degree matters; every year of delay makes the required transition faster and more expensive. The next 10–30 years are critical — the choices made now determine the climate of the next century.
Frequently Asked Questions
Q: How much will sea level rise in my lifetime?
A: For someone aged 30 today, expect 15–50 cm of additional sea level rise by 2070, depending on emissions scenario. Far more in some regions due to subsidence, land sinking, and ocean dynamics. Some coastal cities could experience permanent flooding much sooner.
Q: Are individual actions worth it, or is the problem too big?
A: Individual actions matter but systemic change matters more. The biggest individual levers are reducing flying (1 trans-Atlantic flight ≈ 1 tonne CO₂), driving (EVs vs. gas cars), and high-emissions food choices (beef particularly). The biggest political lever is voting for climate-aware policies and supporting institutional change.
Q: Will technology save us from climate change?
A: Likely partly — solar, batteries, EVs, and emerging carbon capture all help. But scaling deployment is the challenge, not invention. Many needed technologies already exist. Technology alone cannot solve climate change; behavior and policy changes are equally critical.
Q: Is geoengineering (reflecting sunlight to cool Earth) a realistic option?
A: Solar geoengineering is technically possible but politically and ecologically risky. It doesn't address root causes (CO₂ stays in atmosphere), could alter weather patterns unpredictably, and raises governance questions. Most experts treat it as a last-resort measure if warming passes dangerous thresholds.
Q: How do I know what's true amid conflicting claims about climate?
A: Read the IPCC Summary for Policymakers — they synthesize thousands of peer-reviewed studies and represent the closest to scientific consensus available. NASA, NOAA, and major scientific organizations align on the core facts. Genuine scientific debates exist on details (regional impacts, tipping points), not on whether warming is real or human-caused.
Q: If we stopped emissions tomorrow, would warming stop?
A: No. Warming would slow dramatically but continue for decades due to thermal inertia — the oceans take time to warm and release stored heat. Even if emissions hit zero today, we'd see another 0.5–0.7°C of warming by 2100. This is why limiting current and future emissions is critical — it determines how much additional warming occurs.
Sources
Source: IPCC (Intergovernmental Panel on Climate Change). (2021). "Climate Change 2021: The Physical Science Basis." Sixth Assessment Report. — Authoritative synthesis of climate science across thousands of studies.
Source: Cook, J., et al. (2016). "Consensus on consensus: A synthesis of consensus estimates on human-caused global warming." Environmental Research Letters 11(4): 048002 — Meta-analysis confirming 97%+ scientific consensus.
Source: Stern, N. (2007). "The Stern Review on the Economics of Climate Change." Her Majesty's Treasury. — Landmark economic analysis showing action is cost-effective vs. inaction.
Source: UNEP (United Nations Environment Programme). (2023). "Regional Climate Change Impacts and Vulnerabilities." — Summary of differential regional climate impacts.
Source: Hansen, J., et al. (2016). "Ice melt, sea level rise and superstorms: Evidence from paleoclimate data, climate modeling, and modern observations that 2°C global warming could be dangerous." Atmospheric Chemistry and Physics 16(6): 3761–3812 — Analysis of feedback loops and tipping points.
Source: Rockström, J., et al. (2009). "Planetary boundaries: exploring the safe operating space for humanity." Ecology and Society 14(2): 32 — Planetary boundaries framework for climate and other systems.
Read next
Follow new articles
Add SciHub101 to your feed reader to see new science and technology stories.
About the Author
SciHub101 is an independent science and technology publication founded and edited by Buğra Sözeri, a software engineer and app developer based in Türkiye. AI tools assist with drafting and research. Source documentation in the existing archive is uneven, and articles are being reviewed and corrected. The Editorial Team byline identifies editorial responsibility; it does not certify specialist or independent human review. Where we compare products, anything built by our own team is labelled as such — see the editorial guidelines and About page for how corrections and disclosures work.
Related Articles
How Do Electric Cars Actually Work?
An EV is dramatically simpler than a petrol car — a battery, a motor, some software. Here's how the parts work together, the trade-offs versus combustion, and what's coming next.
Why Rare Earth Metals Are So Critical — The Hidden Cost of Clean Energy
Neodymium, dysprosium, cobalt, lithium — these obscure elements power every EV, wind turbine, and smartphone on the planet. But their supply chain is dangerously concentrated, environmentally destructive, and increasingly weaponized.
What If We Burned All Fossil Fuels on Earth?
Earth's proven fossil fuel reserves alone contain roughly three times more carbon than is compatible with keeping warming under 2°C. Here's what the physics, geology, and history say would actually happen if we burned it all.
Extreme Weather and Climate Change: What Science Says
How scientists link heat waves, floods, wildfires, and storms to climate change, how attribution studies work, and where the evidence is still weak.
Climate Change Science: How It Actually Works
From the greenhouse effect to tipping points — the peer-reviewed science behind climate change, carbon budgets, feedbacks, and 2100 scenarios.

Deforestation Explained — Causes, Effects, and Real Solutions
The world clears about 10.9 million hectares of forest a year, slightly more than the area of Iceland. Here is what drives it, what it costs the climate, and which fixes have measurable results.