Deforestation Explained — Causes, Effects, and Real Solutions
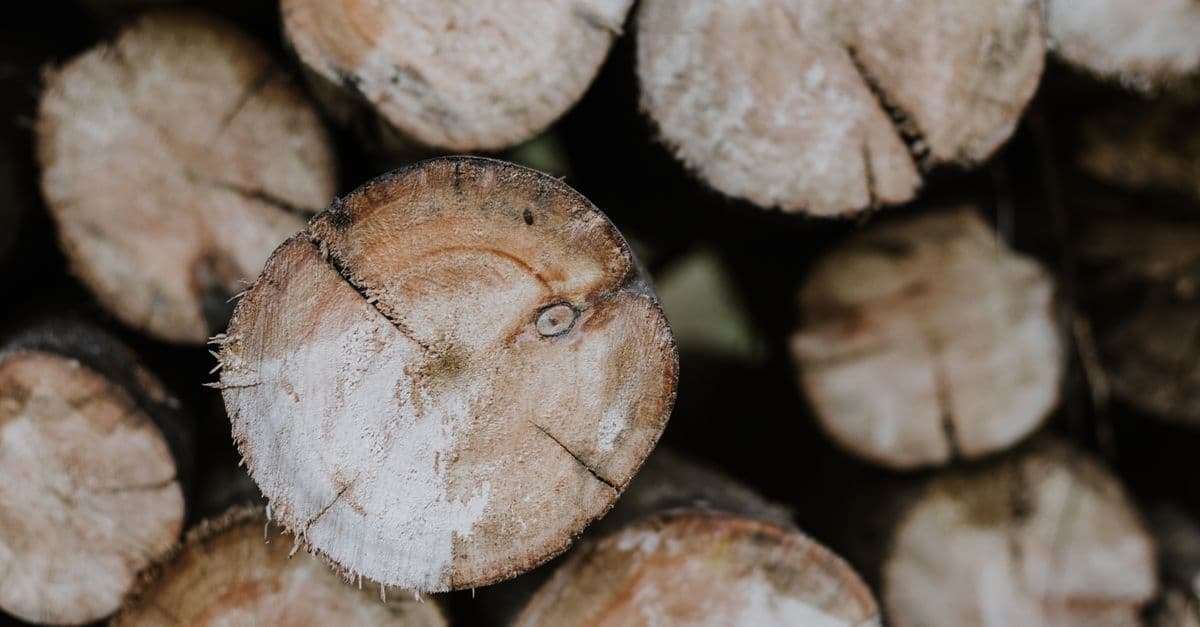
Photo: juliane Monari / Pexels
Every year the world converts about 10.9 million hectares of forest to something else, according to the UN Food and Agriculture Organization (FAO). That is slightly more than the land area of Iceland, and it works out to roughly 30 football pitches a minute. The number is lower than it was in the 1990s, but it is still large enough to matter for the climate, for wildlife, and for the people who live in and around forests. This article explains what actually drives deforestation, what it costs, and which interventions have measurable results.
Key takeaways
- FAO's 2025 assessment puts deforestation at 10.9 million hectares per year in 2015 to 2025, down from 17.6 million in 1990 to 2000. After regrowth and planting, the net loss was 4.12 million hectares per year.
- Agriculture drives 90 to 99 percent of tropical deforestation, according to a 2022 review in Science. Cattle pasture, soy, and oil palm are the biggest commodities.
- 2024 was the worst year on record for tropical primary forest loss, at 6.7 million hectares, because fire overtook agriculture as the leading cause.
- Forests are both a carbon store and a carbon sink. Stopping clearing cuts emissions faster than replanting can remove them.
- Titled Indigenous territories, satellite enforcement, and supply-chain rules have all cut clearing in measurable ways. None has held up without sustained political backing.
How much forest is left, and how fast is it going?
FAO's Global Forest Resources Assessment 2025, released October 21, 2025, covers 236 countries and areas. It finds 4.14 billion hectares of forest, about 32 percent of the planet's land area. That is roughly 0.5 hectares for every person alive, and nearly half of it sits in the tropics.
The headline trend is a slowdown. Deforestation (the permanent conversion of forest to another land use) averaged 17.6 million hectares a year in 1990 to 2000 and 10.9 million hectares a year in 2015 to 2025. FAO still calls the current rate "too high."
The difference between gross and net loss trips up a lot of coverage. Forest also grows back or gets planted elsewhere, so the net figure is smaller: 4.12 million hectares a year in 2015 to 2025, against 10.7 million in the 1990s. Expansion itself has slowed, from 9.88 million hectares a year in 2000 to 2015 to 6.78 million in 2015 to 2025.
| Measure | Value | Source and period |
|---|---|---|
| Global forest area | 4.14 billion ha (32% of land) | FAO FRA 2025 |
| Deforestation, gross | 10.9 million ha/yr | FAO FRA 2025, 2015-2025 |
| Deforestation, gross, earlier | 17.6 million ha/yr | FAO FRA 2025, 1990-2000 |
| Net forest loss | 4.12 million ha/yr | FAO FRA 2025, 2015-2025 |
| Forest expansion | 6.78 million ha/yr | FAO FRA 2025, 2015-2025 |
| Primary forest (never logged or cleared) | at least 1.18 billion ha | FAO FRA 2025 |
| Forest inside protected areas | 813 million ha (about 20%) | FAO FRA 2025 |
Source: FAO newsroom release on the Global Forest Resources Assessment 2025.
For scale, 10.9 million hectares a year works out to about 30,000 hectares a day, or roughly 1,200 hectares an hour. A standard football pitch covers about 0.7 hectares, which is where the "30 pitches a minute" comparison comes from.
Not all forest is equal
A hectare of regrowing plantation is not interchangeable with a hectare of old rainforest. Primary forest, the kind that has never been industrially logged or cleared, holds more carbon and more species per hectare than the same area planted by people. FAO counts at least 1.18 billion hectares of it, more than a quarter of all forest. Naturally regenerating forest makes up 92 percent of the total, but it shrank by 324 million hectares between 1990 and 2025.
That is why the University of Maryland and Global Forest Watch track tropical primary forest loss separately. It is the category where damage is hardest to undo within a human lifetime. Countries with the most forest cover are covered in our ranking of countries by forest area.
What drives deforestation?
Deforestation has a proximate cause (what actually clears the land) and underlying causes (prices, roads, land tenure, policy). The proximate causes are well mapped.
A 2022 review in Science led by Florence Pendrill and 21 co-authors found that agriculture drove 90 to 99 percent of tropical deforestation from 2011 to 2015. The same paper found that only 45 to 65 percent of the cleared land became productive agriculture within a few years. In plain terms, a lot of forest gets cleared and then sits idle or is used only lightly before anything productive is grown there.
An earlier global classification by Philip Curtis and colleagues, also in Science, attributed about 27 percent of forest loss from 2001 to 2015 to permanent conversion for commodities such as beef, soy, palm oil, and wood fiber. Forestry accounted for 26 percent, shifting agriculture for 24 percent, and wildfire for 23 percent. Those categories include temporary loss, such as a logged stand that regrows, which is why the two studies give different headline shares.
The main drivers, region by region
| Driver | What happens | Example from the sources above |
|---|---|---|
| Cattle pasture | Forest cleared for grazing, sometimes followed by crops | Brazilian Amazon |
| Soy | Often planted on land that was cleared earlier | Brazilian Amazon, before and after the 2006 Soy Moratorium |
| Oil palm | Plantations replace forest | 13% of Indonesia's 2024 primary forest loss |
| Pulpwood and timber plantations | Natural forest replaced by tree crops | 6% of Indonesia's 2024 primary forest loss |
| Shifting and subsistence agriculture | Small plots cleared by farm households | 24% of global forest loss, 2001-2015 (Curtis et al.) |
| Logging | Often degrades rather than clears, but opens roads | 18% of Indonesia's 2024 primary forest loss |
| Mining | Direct clearing plus roads and settlement | Illegal mining behind Colombia's 2024 rise |
| Fire | Set for clearing or spread by drought | Nearly half of tropical primary forest loss in 2024 |
Shares vary sharply by country and year. Indonesia's Nusantara Atlas, for example, attributed 13 percent of the country's 2024 primary forest loss to industrial oil palm, 6 percent to pulpwood and timber plantations, 18 percent to logging, and about 5 percent to mining. Its authors could not explain about half of the loss, partly because smallholder clearing is hard to detect.
Roads are the multiplier
A road through intact forest does more than clear its own width. It gives loggers, ranchers, and land speculators access to land that was previously too far from a market. A common frontier sequence runs from a road to selective logging to pasture, and sometimes on to cropland.
Fire is changing the picture
For years, fire was a tool used mostly to finish clearing that chainsaws had started. In 2024 it became the main event. Global Forest Watch and the University of Maryland reported that fires caused nearly 50 percent of tropical primary forest loss, against an average of around 20 percent in recent years. Drought linked to El Niño dried out forests that rarely burn in normal years.
In 2024, the world lost 6.7 million hectares of tropical primary forest, nearly twice the 2023 total. Fires were the leading cause for the first time in the dataset and released an estimated 4.1 gigatons of greenhouse gases, more than four times the emissions from all air travel in 2023 (WRI and Global Forest Watch).
Where the losses are concentrated
The WRI release on the 2024 data gives a country-level picture. Brazil accounted for 42 percent of tropical primary forest loss. Fire caused 66 percent of Brazil's loss, an over sixfold increase from 2023, while loss from other causes rose 13 percent. Bolivia's primary forest loss rose 200 percent to 1.5 million hectares, second only to Brazil. Colombia's non-fire loss rose 53 percent, driven by illegal mining and coca production. The Democratic Republic of Congo and the Republic of Congo saw the highest levels of primary forest loss on record.
Indonesia moved the other way, with primary forest loss falling 11 percent in the same dataset, reversing a rise between 2021 and 2023. A separate analysis by Nusantara Atlas, using different methods, put the 2024 decline at about 13 percent, from roughly 279,000 to roughly 242,000 hectares. The two figures disagree because the datasets define primary forest and detect clearing differently, which is a recurring theme in this field.
Outside the tropics, boreal forests in Canada and Russia lose canopy mostly to fire and logging. That loss is often temporary because boreal forest regrows, but regrowth takes decades, and the carbon released in the meantime is not available for recapture until then.
Why the numbers rarely match
If you compare headline figures from FAO, Global Forest Watch, and national agencies, they will not agree. The reasons are mostly definitional.
- FAO counts land-use change. A clear-cut that is replanted is not deforestation, because the land stays forest.
- Global Forest Watch counts tree cover loss from satellites, which includes fire, logging, and plantation harvest, whether or not the land stays forest.
- National systems such as Brazil's PRODES use their own thresholds and cover specific biomes.
None of these is wrong. They answer different questions, and good reporting says which one is in use.
What forests do that is hard to replace
Carbon storage and uptake
Forests hold a lot of carbon and absorb a lot more each year. FAO reports forest carbon stocks of 714 gigatonnes. An older, widely cited estimate by Yude Pan and colleagues in Science (2011) put the carbon in the world's forests at 861 billion tonnes, with about 55 percent of it in tropical forests. The two figures use different accounting boundaries, such as soil depth and the pools counted, which is why they do not match.
The flows matter as much as the stocks. A 2021 study in Nature Climate Change by Nancy Harris and colleagues mapped forest carbon fluxes for 2001 to 2019. It found that forests removed 15.6 gigatonnes of CO₂ equivalent a year and emitted 8.1 gigatonnes a year through deforestation and other disturbances, leaving a net sink of 7.6 gigatonnes a year. The authors flag very large uncertainty around the removal estimate, so treat the net sink as an order of magnitude rather than a precise figure.
The Global Carbon Budget 2024 adds the emissions side. Net land-use change emissions averaged 4.1 gigatonnes of CO₂ a year from 2014 to 2023, with an uncertainty of plus or minus 2.6. Total human CO₂ emissions in 2024 were estimated at 41.6 gigatonnes, so land use is roughly a tenth of the total. Deforestation alone emitted about 1.7 gigatonnes of carbon a year over 2014 to 2023, equivalent to about 6.2 gigatonnes of CO₂. Regrowth and reforestation offset about two-thirds of that. Brazil, Indonesia, and the Democratic Republic of Congo together contribute more than half of global land-use CO₂ emissions.
A good way to think about it: a mature forest is like a savings account that took centuries to fill. Cutting it releases the balance in a few years. Planting a replacement is like opening a new account that earns slowly and takes decades to match the old one.
For the wider climate picture, see our explainer on the science of climate change. Forests also work alongside engineered options covered in how carbon capture works, but no engineered system yet removes carbon at the scale forests do.
The Amazon as a case in point
In 2021, a team led by Luciana Gatti published an aircraft-based study in Nature. It used 590 vertical profiles of CO₂ and carbon monoxide at four sites from 2010 to 2018. The southeastern Amazon, where deforestation, warming, and dry-season stress have been strongest, was a net source of carbon. Fire emissions there were about three times larger than the net biome exchange, according to Mongabay's summary of the paper. The authors link the shift to deforestation, fire, and climate stress.
That result is regional, not a statement about the whole Amazon. The western and central basin was closer to neutral or still absorbing. But it showed that a forest can flip from storing carbon to emitting it when clearing, fire, and drought stack up.
Biodiversity and water
Tropical forests hold a large share of terrestrial species. Clearing them is the biggest single threat to many of those species, because habitat loss strips away the places they live all at once. The wider extinction picture is covered in our piece on the biodiversity collapse, and the countries that hold the most species are ranked in our biodiversity country ranking.
Forests also recycle water. Trees pull water from soil and release it through their leaves (transpiration), which seeds clouds and returns moisture to the air. In large forests such as the Amazon, a meaningful part of the rainfall is recycled locally. That is why researchers worry about a tipping point: if enough forest is lost, the region could dry out and shift toward degraded forest or savanna. Carlos Nobre's group proposed a threshold of 20 to 25 percent deforestation in a 2016 study. A 2024 Nature paper by Bernardo Flores and colleagues estimated that by 2050, between 10 and 47 percent of Amazonian forests could be exposed to combined disturbances that might push them into unexpected states.
These thresholds differ because the studies use different models and assumptions. The honest summary is that the tipping point is uncertain in size and timing, and that both clearing and warming push the system toward it. The basics of the cycle are in how the water cycle works.
People and disease
Forests are home to many Indigenous and local communities, and Indigenous territories often hold some of the best-protected forest left. Where forests shrink, contact between people, livestock, and wildlife increases, which is one of the routes for new infections to reach humans. The mechanics are covered in how viruses jump from animals to humans. The link between clearing and any specific outbreak is usually hard to prove, so claims should be read with that caution.
Brazil: proof that policy moves the number
Brazil's Amazon is the clearest natural experiment in the field, because its deforestation has been tracked by satellite since 1988 and has swung widely.
| Period | What happened | Source |
|---|---|---|
| 2004 | About 27,772 km² cleared, the second-highest on record | PRODES figures reported by InfoAmazonia (2014) |
| 2012 | About 4,571 km², the lowest since monitoring began in 1988 | PRODES figures reported by InfoAmazonia (2014) |
| 2018 to 2019 | Alerts rose sharply (FAPESP Pesquisa reported an 88% jump between June 2018 and June 2019) | FAPESP Pesquisa |
| Aug 2023 to Jul 2024 | 6,288 km² cleared | PRODES, as cited by Imazon |
| Aug 2025 to Jul 2026 | About 2,874 km² of alerts, down roughly 36% from 4,495 km² | INPE DETER, via Agência Brasil |
A caution on the last row. DETER is a rapid alert system, not the official annual PRODES rate, and the two are measured differently. A fall in alerts is a strong signal but not the final number.
The 2004 to 2012 drop, from about 27,700 km² to about 4,500 km², is attributed to a mix of protected areas, satellite monitoring, enforcement against illegal clearing, and pressure on supply chains. In the soy sector, a 2015 Science study by Holly Gibbs and colleagues found that before the 2006 Soy Moratorium, about 30 percent of soy expansion in the Amazon came through deforestation, and afterward about 1 percent. Soy area still grew, because farmers planted land that had already been cleared.
The reversal after 2018 shows the other side. Enforcement is a political choice, and when it weakens, clearing responds quickly. FAPESP Pesquisa reported that fines issued by Brazil's environmental agency IBAMA fell 29.4 percent in the first seven months of 2019 compared with 2018.
What actually works
Evidence on solutions is better than the public debate suggests. Some approaches have strong data behind them, others are promising but patchy.
Titled Indigenous territories
A 2021 FAO and FILAC report reviewed the research literature. It found that in the Bolivian, Brazilian, and Colombian Amazon from 2000 to 2012, titled Indigenous territories had deforestation rates roughly one-third to one-half those of comparable forests outside them. In Brazil from 1982 to 2016, territories with full collective property rights had 66 percent lower deforestation. In the Amazon Basin from 2003 to 2016, Indigenous territories lost less than 0.3 percent of their forest carbon, compared with 0.6 percent in other protected areas and 3.6 percent in unprotected land.
Two caveats. Security of tenure matters more than a line on a map, and the same report notes that deforestation in Brazil's Indigenous territories rose 150 percent from 2016 to 2018 when enforcement weakened.
Satellite monitoring and enforcement
Global Forest Watch, INPE's DETER and PRODES, and similar systems turn a hidden activity into a dated, mapped record. Remote sensing technologies such as LiDAR add measurements of canopy height and structure that help estimate carbon stocks. Monitoring is only useful if somebody acts on it, which is why Brazil's drop after 2004 is credited to alerts paired with protected lands and federal enforcement against organized crime.
Protected areas
FAO counts 813 million hectares of forest in protected areas, about 20 percent of the total, up 251 million hectares since 1990. Protection on paper is not protection in practice. Parks without funding, staff, or legal backing can still lose forest, but where enforcement exists the effect is clear.
Supply-chain rules
Corporate pledges have a mixed record. Curtis and colleagues noted that the rate of commodity-driven deforestation had not slowed despite corporate pledges to end deforestation in supply chains. Binding rules are a newer tool.
The European Union's Deforestation Regulation requires companies that place commodities such as soy, palm oil, cattle products, wood, cocoa, and coffee on the EU market to show they did not come from land deforested after a cutoff date. Its start date has been pushed back. Under the revision agreed in December 2025, large and medium companies must comply from December 30, 2026, and small and micro firms from June 30, 2027. The regulation's effect on forest cover is still to be measured.
One weakness is leakage. Agreements that bind only some buyers let ranchers sell to those that have not signed zero-deforestation commitments. Rules that cover only one buyer or one market push clearing toward another.
Payments for forest protection
Programs under REDD+ (Reducing Emissions from Deforestation and forest Degradation) pay countries or communities for verified reductions in clearing. Results vary with how well baselines are set and whether the reductions would have happened anyway. This is a field where credible claims need independent verification, and carbon credits from forest projects have faced scrutiny over exactly that.
Restoration
Planting trees helps, but it has a different timescale. A new forest takes decades to build the carbon stock of an old one, and the wrong species planted in the wrong biome can do harm. FAO notes that planted forest makes up about 312 million hectares, around 8 percent of forest area. The general finding in the carbon literature is that keeping existing forest is more reliable than replacing it later.
| Intervention | Evidence strength | Main limitation |
|---|---|---|
| Titled Indigenous territories | Strong in Latin America | Needs secure tenure and enforcement |
| Satellite alerts plus enforcement | Strong (Brazil 2004-2012) | Depends on political will |
| Protected areas | Moderate to strong | Paper parks lose forest anyway |
| Binding import rules | Early | Leakage to other markets; delayed start |
| Voluntary corporate pledges | Weak overall | Gaps in coverage and verification |
| REDD+ payments | Mixed | Baselines and additionality |
| Replanting | Real but slow | Decades to match old forest |
What individuals can and cannot do
A single household has little direct influence on a policy such as the EU regulation, but consumption still shapes demand. Beef from deforested pasture, palm oil in packaged food, and paper and timber products are the usual links between a shopping basket and forest loss. Choosing certified products helps a little, since certification is imperfect and does not cover every producer. For a data-driven look at which personal actions move the needle, see our ranking of high-impact carbon footprint actions.
Some of the effects reach the supermarket directly. Climate stress on tropical crops is one example, covered in why coffee could disappear.
Common misconceptions
"Trees alone can offset fossil fuel emissions"
Forests absorb a large amount of CO₂, but not enough to cancel fossil emissions. The Global Carbon Budget's 2024 total of 41.6 gigatonnes of CO₂, less about 4.2 gigatonnes from land use, leaves roughly 37 gigatonnes from fossil sources in a single year. That is a number forests cannot match even at maximum restoration, which is why forest protection works alongside emissions cuts rather than replacing them.
"All deforestation is illegal"
Much of it is legal under national land laws, and some illegal clearing is later legalized or goes unpunished. Fixing the problem means changing incentives and rules as well as policing.
"Recycling paper saves rainforest"
Recycling reduces demand for virgin fiber, which helps, but most commercial paper comes from managed plantations rather than primary tropical forest. Primary-forest loss in the tropics is driven mainly by agriculture, not paper.
"It is too late"
Most tropical forest still stands, and the data from Brazil and Indonesia show that clearing rates can fall quickly when policy changes. The same data show they can rise again.
"Forest cover is shrinking everywhere"
Regional trends diverge. FAO reports declines in naturally regenerating forest in Africa and South America and an increase in Europe. A country can also gain forest at home while importing goods tied to clearing elsewhere, which is a reason to look at consumption as well as territory.
Frequently asked questions
Q: How much forest is lost each year? A: FAO estimates 10.9 million hectares of deforestation per year for 2015 to 2025, down from 17.6 million in 1990 to 2000. After regrowth and planting, net loss was 4.12 million hectares a year. Global Forest Watch's separate satellite series, which counts tree cover loss from any cause, recorded 6.7 million hectares of tropical primary forest loss in 2024 alone.
Q: What is the biggest cause of deforestation? A: Agriculture. A 2022 review in Science found it drove 90 to 99 percent of tropical deforestation from 2011 to 2015, with cattle pasture, soy, and oil palm among the leading commodities. Fire became the leading cause of tropical primary forest loss in 2024, according to Global Forest Watch.
Q: Is deforestation the same as forest loss? A: No. Deforestation means a permanent change of land use, such as forest to pasture. Forest loss or tree cover loss can include temporary losses from logging, plantation harvest, or fire, where trees regrow. FAO and Global Forest Watch use different definitions, so their numbers differ.
Q: How much do forests contribute to climate change? A: Net land-use change emissions averaged about 4.1 gigatonnes of CO₂ a year from 2014 to 2023, roughly a tenth of total human CO₂ emissions in 2024, according to the Global Carbon Budget. Forests also absorb carbon: Harris and colleagues estimated a net sink of 7.6 gigatonnes of CO₂ equivalent a year in 2001 to 2019, with wide uncertainty.
Q: Is the Amazon still a carbon sink? A: Mostly, but not everywhere. A 2021 Nature study found the southeastern Amazon was a net carbon source in 2010 to 2018, driven by fire, deforestation, and drier conditions. Other parts of the basin were close to neutral or still absorbing, and the picture changes with drought years.
Q: Does tree planting solve deforestation? A: Not by itself. Replanted forest takes decades to match the carbon stock and habitat of old forest, and planting the wrong species in the wrong place can harm ecosystems. Evidence in the carbon literature favors protecting existing forest first and restoring second.
Q: Which solutions have the best evidence? A: Titled Indigenous territories and satellite-backed enforcement have the strongest evidence. FAO and FILAC found deforestation rates in titled Indigenous territories in the Amazon were one-third to one-half those of comparable forests, and Brazil's 2004 to 2012 decline coincided with enforcement and monitoring.
The takeaway
Deforestation is falling in the long run and rising in bad years. The FAO's gross figure has dropped by more than a third since the 1990s, yet 2024 showed how drought and fire can undo a decade of progress in a single season. The drivers are economic, mostly beef, soy, palm oil, timber, and mining, and the interventions that work are the ones that change the economics: secure land rights, enforced rules, and supply chains that can be traced. Forest loss is also reversible in policy terms, but not in ecological terms, because an old forest cannot be rebuilt on any timescale that matters to the climate this century.
Sources
- FAO, Global Forest Resources Assessment 2025 release
- WRI, Global forest loss shatters records in 2024
- Pendrill et al. 2022, Science, Disentangling the numbers behind agriculture-driven tropical deforestation
- Friedlingstein et al., Global Carbon Budget 2024, Earth System Science Data
- Harris et al. 2021, Nature Climate Change, forest carbon fluxes
- FAO and FILAC, Forest governance by Indigenous and Tribal Peoples, main findings
- Agência Brasil, Amazon deforestation alerts fall 36.87%
- FAPESP Pesquisa, Deforestation at a crossroads
- Nusantara Atlas, Indonesia's primary forest loss slows in 2024
Related Reading
Follow new articles
Add SciHub101 to your feed reader to see new science and technology stories.
About the Author
SciHub101 is an independent science and technology publication founded and edited by Buğra Sözeri, a software engineer and app developer based in Türkiye. AI tools assist with drafting and research. Source documentation in the existing archive is uneven, and articles are being reviewed and corrected. The Editorial Team byline identifies editorial responsibility; it does not certify specialist or independent human review. Where we compare products, anything built by our own team is labelled as such — see the editorial guidelines and About page for how corrections and disclosures work.
Related Articles
Is Nuclear Power Safe? The Real Risks and Benefits
Nuclear power has the lowest death rate per kWh of any major energy source. It's also the most feared. Here's what the data actually says — beyond Chernobyl, beyond Fukushima.

How Do Solar Panels Work — and Are They Worth It?
Solar panels turn sunlight directly into electricity using the photoelectric effect. They're now the cheapest form of new power generation in most of the world. Here's how they work and whether they pay off.
The Amazon Rainforest: Earth's Lungs Explained by Science
The Amazon is not Earth's oxygen factory, but it stores vast carbon and recycles rain across a continent. Here is what the evidence says about deforestation, drought, and tipping points.
Countries With the Most Forest Cover (2025)
Forests cover 4.14 billion hectares, about 32% of the world's land, per FAO's 2025 assessment. Russia, Brazil, Canada, the United States and China hold more than half. Ranked by area and by share of land, with what the numbers miss.
The Biodiversity Collapse: Why Species Are Vanishing Faster
Species are disappearing tens to hundreds of times faster than the long-run average, and monitored wildlife populations have fallen by about three-quarters since 1970. Here is what the numbers mean, what drives the loss, and what has worked.
AI & Biodiversity: Satellite Monitoring Protects Endangered Species
How neural networks detect endangered animals, track population decline, predict extinction.