Countries With the Most Biodiversity (2025)
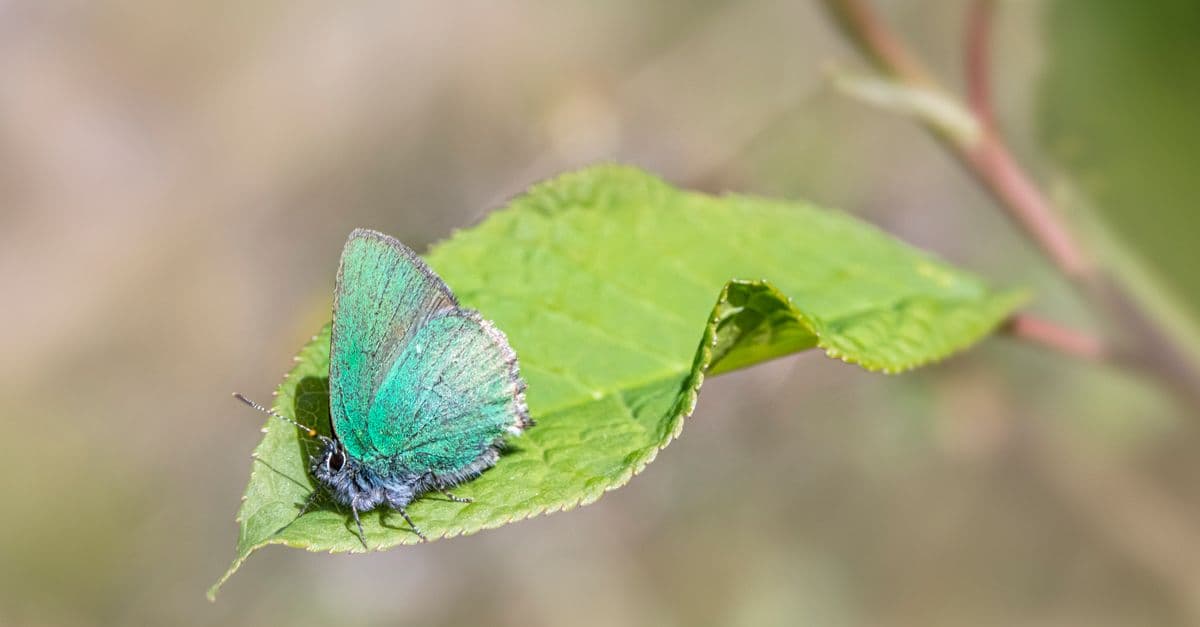
Photo: Erik Karits / Pexels
Biodiversity, the variety of life at the level of genes, species and ecosystems, is concentrated in a small number of countries. In 1998 Conservation International named 17 "megadiverse" countries, all of them at least partly tropical or subtropical: Australia, Brazil, China, Colombia, the Democratic Republic of the Congo, Ecuador, India, Indonesia, Madagascar, Malaysia, Mexico, Papua New Guinea, Peru, the Philippines, South Africa, the United States and Venezuela. To make the list, a country needed at least 5,000 endemic plant species and a coastline on a marine ecosystem.
That list is a useful starting point, but it is not a ranking. Ask "which country has the most species?" and you run straight into a measurement problem that is worth understanding before you look at any table: nobody knows how many species most countries have. This article ranks countries on the most comparable number that does exist, explains what it can and cannot tell you, and looks at the countries at the top of it.
Key Takeaways
- On IUCN Red List data for 2025, Brazil has the most endemic mammal, bird and amphibian species combined (1,258), followed by Indonesia (1,081) and Australia (862).
- Raw national species totals cannot be compared fairly. Brazil's national animal catalogue lists 124,438 valid species; Colombia's biodiversity information system has records for 83,725 species, while estimating the true figure at 200,000 to 900,000.
- A 2011 study estimated about 8.7 million eukaryotic species on Earth, with roughly 86% still undescribed.
- Madagascar has more threatened plant species than any of the other megadiverse countries in World Bank data for 2022 (2,894), and Indonesia has the most threatened mammals (212).
- The often-repeated claim that megadiverse countries hold "over 70%" of the world's biodiversity is the countries' own 2002 estimate, not an independent measurement.
Top 20 Countries by Endemic Vertebrate Species (IUCN, 2025)
The table counts species that occur naturally in one country only, across three groups that the IUCN has comprehensively assessed: mammals, birds and amphibians. Endemism is used because it is what makes a country irreplaceable. If a species lives only in Madagascar, Madagascar's choices decide whether it survives.
| Rank | Country | Endemic mammals | Endemic birds | Endemic amphibians | Total | Source, year |
|---|---|---|---|---|---|---|
| 1 | Brazil | 211 | 260 | 787 | 1,258 | IUCN Red List via OWID, 2025 |
| 2 | Indonesia | 316 | 541 | 224 | 1,081 | IUCN Red List via OWID, 2025 |
| 3 | Australia | 271 | 359 | 232 | 862 | IUCN Red List via OWID, 2025 |
| 4 | Madagascar | 212 | 118 | 342 | 672 | IUCN Red List via OWID, 2025 |
| 5 | Mexico | 153 | 121 | 290 | 564 | IUCN Red List via OWID, 2025 |
| 6 | Colombia | 46 | 91 | 380 | 517 | IUCN Red List via OWID, 2025 |
| 7 | Peru | 60 | 132 | 309 | 501 | IUCN Red List via OWID, 2025 |
| 8 | Philippines | 136 | 259 | 95 | 490 | IUCN Red List via OWID, 2025 |
| 9 | Papua New Guinea | 85 | 110 | 287 | 482 | IUCN Red List via OWID, 2025 |
| 10 | India | 55 | 76 | 304 | 435 | IUCN Red List via OWID, 2025 |
| 11 | United States | 110 | 79 | 231 | 420 | IUCN Red List via OWID, 2025 |
| 12 | China | 94 | 67 | 258 | 419 | IUCN Red List via OWID, 2025 |
| 13 | Ecuador | 37 | 40 | 258 | 335 | IUCN Red List via OWID, 2025 |
| 14 | Venezuela | 35 | 52 | 179 | 266 | IUCN Red List via OWID, 2025 |
| 15 | Tanzania | 36 | 36 | 92 | 164 | IUCN Red List via OWID, 2025 |
| 16 | Japan | 48 | 24 | 82 | 154 | IUCN Red List via OWID, 2025 |
| 17 | Sri Lanka | 18 | 31 | 100 | 149 | IUCN Red List via OWID, 2025 |
| 18 | Malaysia | 27 | 9 | 109 | 145 | IUCN Red List via OWID, 2025 |
| 19 | Argentina | 86 | 14 | 44 | 144 | IUCN Red List via OWID, 2025 |
| 20 | South Africa | 41 | 18 | 56 | 115 | IUCN Red List via OWID, 2025 |
Source: IUCN Red List Summary Statistics, "Total, threatened and extinct vertebrate species in each country" (2025), as processed and published by Our World in Data. Totals are our sum of the three columns. Overseas territories are excluded.
Three of the 17 megadiverse countries fall outside this top 20 or near its bottom, and that is informative. The Democratic Republic of the Congo is on the megadiverse list mostly for its plants and its share of the Congo Basin forest, which spills across borders, so few of its vertebrates are confined to the DRC alone. Malaysia and South Africa qualify largely on plants, which this table does not count. A ranking based on reptiles, fish, insects or plants would reorder the list.
Why Counting Species by Country Is So Hard
Every biodiversity ranking you see online depends on a choice of what to count, and most do not say which choice they made. Here are the main problems.
Most species have never been named
In 2011 Camilo Mora and colleagues estimated that Earth holds about 8.7 million eukaryotic species (plants, animals, fungi and protists), of which about 2.2 million live in the ocean. About 1.2 million had been catalogued in a central database at the time, which led the authors to conclude that roughly 86% of species on Earth and 91% of ocean species were still undescribed. Later studies have produced different estimates, but none suggests the gap is small.
That gap is not evenly spread. Unnamed species are concentrated in insects, mites, fungi, nematodes and marine invertebrates, and in tropical places where few taxonomists work. A "known species" count therefore measures two things at once: how much life a country holds, and how much effort has gone into describing it. Our piece on why the ocean is still mostly unexplored shows the same pattern at sea.
National checklists use different rules
Countries compile their own species lists, and they do not use one method. Brazil's Catálogo Taxonômico da Fauna do Brasil, built since 2013 by more than 500 zoologists, listed 124,438 taxonomically valid animal species in the version registered on GBIF; 81.2% of them, more than 102,000 species, are arthropods. That is animals only. Plants and fungi sit in a separate national list, the Flora e Funga do Brasil.
Colombia's Biodiversity Information System (SiB Colombia) takes a different approach. It counts species for which it holds records. Its December 2025 summary reported 83,725 species, up 4.2% from 80,346 at the end of 2024, and it states plainly that there is no exact figure and that the real number is estimated at 200,000 to 900,000 (SiB Colombia, Cifras sobre Biodiversidad de Colombia, cut-off 31 December 2025). A rise of 3,000 species in a year mostly reflects new records being shared, not new animals arriving.
Put those two numbers next to each other and Brazil looks far ahead. But one is a curated checklist of described animals, and the other is a count of species with data in a portal. Neither is wrong, and they cannot be ranked against each other. This is why the table above uses a single, centrally assessed source instead of national totals.
Data reflects where scientists look
The Global Biodiversity Information Facility (GBIF) aggregates occurrence records, each one a documented sighting or specimen. A query of the GBIF occurrence API on 19 October 2026 returned the following totals:
| Country | GBIF occurrence records | Source, date |
|---|---|---|
| United States | 1,322,875,903 | GBIF API, 19 Oct 2026 |
| Australia | 260,254,858 | GBIF API, 19 Oct 2026 |
| India | 66,159,274 | GBIF API, 19 Oct 2026 |
| South Africa | 49,036,683 | GBIF API, 19 Oct 2026 |
| Brazil | 45,794,324 | GBIF API, 19 Oct 2026 |
| Colombia | 40,824,814 | GBIF API, 19 Oct 2026 |
| Mexico | 39,853,200 | GBIF API, 19 Oct 2026 |
| China | 15,604,250 | GBIF API, 19 Oct 2026 |
| Ecuador | 15,084,147 | GBIF API, 19 Oct 2026 |
| Peru | 12,501,914 | GBIF API, 19 Oct 2026 |
| Indonesia | 5,570,104 | GBIF API, 19 Oct 2026 |
| Madagascar | 3,795,257 | GBIF API, 19 Oct 2026 |
| Papua New Guinea | 2,728,899 | GBIF API, 19 Oct 2026 |
| DR Congo | 1,589,052 | GBIF API, 19 Oct 2026 |
The United States has roughly 240 times as many records as Indonesia, though Indonesia has far more endemic mammals and birds. Much of the American total comes from birdwatchers submitting checklists through citizen-science apps. Data density follows wealth, roads, universities and hobbyists, not species. Any ranking built on raw record counts or "species observed" will tilt toward rich, well-surveyed countries.
New tools are starting to narrow the gap. Environmental DNA sampling, where scientists sequence genetic traces in water or soil, can detect species that no one has seen; we cover the method in AI and metagenomics for ecosystem monitoring. Satellite and acoustic monitoring help too, as described in how AI and satellites track endangered species.
Borders are not biological units
The Amazon spans nine countries. The island of New Guinea is split between Indonesia and Papua New Guinea. Borneo is shared by Indonesia, Malaysia and Brunei. A species living on both sides of a border counts toward two national totals but is endemic to neither. That is why endemism counts favour large countries and islands: Brazil and Indonesia because they are vast, Madagascar and the Philippines because they are isolated.
Size versus density
Large countries naturally contain more habitats and more species. Ecuador covers a small fraction of Brazil's area but still ranks 13th, with 258 endemic amphibians packed into a much smaller territory. A per-area ranking would put small Andean and island nations much higher. Neither view is "correct". Total endemism tells you where the most irreplaceable species are. Density tells you where a single protected area can save the most.
Where the "70%" Figure Comes From
Many articles say megadiverse countries contain "more than 70%" of the world's biodiversity. The figure traces to the Meeting of Like-Minded Megadiverse Countries, hosted by Mexico in Cancún from 16 to 18 February 2002. In a letter later circulated at the United Nations, the participating governments described themselves as home to over 70 per cent of the world's biological diversity.
That is a self-description in a diplomatic document, not the output of a census. The group was formed to coordinate positions on access to genetic resources and benefit-sharing under the Convention on Biological Diversity, so its members had good reason to stress their importance. The number may be roughly right for well-studied groups such as vertebrates and flowering plants, but no one can verify it for life as a whole when most species are undescribed. We have dropped the claim from our own ranking for that reason.
Threatened Species in the Megadiverse Countries
Richness and risk are linked. Countries with many endemic species are also the countries where the most species could disappear for good. The World Bank publishes threatened-species counts from the IUCN Red List in its World Development Indicators; the latest year is 2022.
| Country | Threatened mammals | Threatened birds | Threatened fish | Threatened higher plants | Source, year |
|---|---|---|---|---|---|
| Indonesia | 212 | 161 | 366 | 977 | World Bank WDI (IUCN), 2022 |
| Madagascar | 133 | 37 | 127 | 2,894 | World Bank WDI (IUCN), 2022 |
| India | 99 | 92 | 290 | 527 | World Bank WDI (IUCN), 2022 |
| Brazil | 97 | 155 | 360 | 1,346 | World Bank WDI (IUCN), 2022 |
| Mexico | 97 | 68 | 308 | 1,426 | World Bank WDI (IUCN), 2022 |
| Malaysia | 80 | 67 | 183 | 1,317 | World Bank WDI (IUCN), 2022 |
| China | 78 | 94 | 207 | 713 | World Bank WDI (IUCN), 2022 |
| Australia | 69 | 66 | 214 | 766 | World Bank WDI (IUCN), 2022 |
| Colombia | 63 | 102 | 183 | 918 | World Bank WDI (IUCN), 2022 |
| Peru | 51 | 93 | 90 | 568 | World Bank WDI (IUCN), 2022 |
| Papua New Guinea | 51 | 38 | 132 | 641 | World Bank WDI (IUCN), 2022 |
| Ecuador | 49 | 86 | 99 | 2,029 | World Bank WDI (IUCN), 2022 |
| DR Congo | 48 | 40 | 128 | 440 | World Bank WDI (IUCN), 2022 |
| United States | 43 | 87 | 283 | 688 | World Bank WDI (IUCN), 2022 |
| Philippines | 42 | 91 | 143 | 903 | World Bank WDI (IUCN), 2022 |
| Venezuela | 37 | 43 | 105 | 463 | World Bank WDI (IUCN), 2022 |
| South Africa | 33 | 54 | 153 | 428 | World Bank WDI (IUCN), 2022 |
Source: World Bank, World Development Indicators series EN.MAM.THRD.NO, EN.BIR.THRD.NO, EN.FSH.THRD.NO and EN.HPT.THRD.NO, all citing the IUCN Red List; accessed October 2026 via the World Bank data API.
Two things stand out. Madagascar and Ecuador have very large plant counts because botanists have assessed many of their plants, not only because their flora is in worse shape. And the plant column, like every column here, only counts species that have been assessed. Our ranking of countries with the most endangered species looks at this list from the threat side.
At global scale, the IUCN Red List passed 48,000 threatened species in its October 2025 update, which listed 48,646 of 172,620 assessed species as threatened, about 28% of the species it has evaluated. The 2019 Global Assessment by IPBES estimated that around 1 million animal and plant species are threatened with extinction, including more than 40% of amphibian species and almost a third of reef-forming corals. The IPBES figure is a modelled estimate that extends beyond the species the Red List has assessed.
Brazil: The Largest Share of Endemic Vertebrates
Brazil leads the endemism ranking mainly because of its amphibians. Its 787 endemic amphibian species are more than twice as many as any other country in the table. Many of them live in the Atlantic Forest along the eastern coast, a biome that has been heavily cleared for farms and cities and now survives largely as fragments. Small, isolated forest patches suit amphibians that have tiny ranges, which helps explain both the high endemism and the high risk.
Brazil also contains most of the Amazon basin, the Cerrado savanna, the Pantanal wetland, the semi-arid Caatinga and the Pampa grasslands. Its national animal catalogue of 124,438 valid species, overwhelmingly arthropods, gives a sense of what lies below the vertebrate line. Brazil's place in forest cover rankings is closely tied to its place here: losing forest means losing endemic species that live nowhere else.
Indonesia: Two Faunas Meet
Indonesia has the most endemic mammals (316) and the most endemic birds (541) of any country in IUCN data. Its geography explains why. The archipelago stretches across the boundary between Asian and Australasian fauna, the line the naturalist Alfred Russel Wallace described in the 19th century. West of it, islands such as Sumatra and Borneo share animals with mainland Asia. East of it, New Guinea carries marsupials and birds-of-paradise with Australian affinities. In between lie thousands of islands where populations have evolved in isolation.
Island isolation is the engine Darwin and Wallace each recognised, and it is still the clearest way to see how natural selection produces new species. Indonesia also tops the threatened lists for mammals and fish, so the same isolation that produced its endemics leaves them with nowhere else to go when forests are cleared.
Australia: Ancient Isolation
Australia ranks third, with 271 endemic mammals and 359 endemic birds. The continent separated from Antarctica tens of millions of years ago, and its mammals evolved mostly as marsupials and monotremes, groups that are rare or absent elsewhere. Australia is also an unusual member of the list: along with the United States, it is one of only two high-income countries among the 17 megadiverse nations.
Wealth shows up in the data. Australia has the second-largest number of GBIF occurrence records in the table, which means its species are relatively well documented. It also has one of the world's worst records of recent mammal extinctions, driven largely by introduced predators such as foxes and feral cats. Good data does not by itself prevent losses.
Madagascar: Small Island, Deep Endemism
Madagascar has about 212 endemic mammals, more than Brazil, in an area that is a small fraction of Brazil's size. Most of them are lemurs, tenrecs and other groups found nowhere else. The island also has 342 endemic amphibians, nearly all frogs.
Madagascar shows why endemism and threat move together. It has 127 threatened endemic mammal species in the IUCN 2025 data, second only to Indonesia, and the highest number of threatened higher plants of any country in the World Bank table. Its forests have been cut heavily for farming and charcoal. Because these species have no populations elsewhere, every hectare lost on the island is a global loss.
Colombia, Peru and Ecuador: The Andes Effect
Colombia, Peru and Ecuador sit close together in the ranking, and they share one driver: the Andes. A mountain range creates bands of climate stacked on top of one another, from hot lowland forest to cold páramo grassland, within a short distance. Valleys and ridges cut populations off from each other, and over time they diverge into separate species. Amphibians, which disperse poorly, respond most strongly. Colombia has 380 endemic amphibians, Peru 309 and Ecuador 258.
Colombia is often said to have more bird species than any other country, and SiB Colombia lists it first in the world for birds, orchids and butterflies. Yet it has only 91 endemic birds in the IUCN data, fewer than the Philippines. That is not a contradiction. Many of Colombia's birds also live in neighbouring Ecuador, Venezuela or Peru, so they add to Colombia's total but not to its endemism. Colombia's government lists about 2,100 threatened species under Resolution 0126 of 2024, a national list that differs from the IUCN's global one.
Mexico, China, India and the United States
The northern-hemisphere members of the list rank lower on endemic vertebrates but still reach the top 12. Mexico (564) benefits from sitting where North and Central American faunas meet, with deserts in the north and rainforest in the south. China (419) and India (435) both span huge ranges of latitude and altitude, from tropical forest to the Himalaya, and India's Western Ghats are a well-known centre of endemic amphibians. The United States (420) owes much of its endemism to Hawaii and to the freshwater and desert species of the southwest.
These four countries also have the scientific capacity to survey their own species, which raises their counts relative to less-studied countries. That is another reason not to read small differences in the table as real biological differences.
Islands, Mountains and Time: What Drives Megadiversity
The countries at the top of the ranking share a few features:
- Tropical position. Warm, wet climates support more species per area than cold or dry ones, for reasons ecologists still debate, including higher energy input and longer, more stable evolutionary history.
- Mountains. Altitude gradients produce many distinct climates close together, so populations split and diverge. The Andes, the Himalaya and the mountains of New Guinea are all endemism hotspots.
- Islands. Isolation cuts off gene flow. Madagascar, the Philippines, New Guinea and the Indonesian islands all rank highly for this reason.
- Time without disruption. Regions that escaped repeated glaciation have had longer to accumulate species. Mass extinctions show the reverse, as in the end of the Cretaceous; our article on why the Cretaceous extinction was so devastating explains how long recovery took.
- Marine coastlines. The megadiverse criterion requires a coastline because coral reefs and coastal waters add a separate layer of diversity. Indonesia and the Philippines sit within the reef region often called the Coral Triangle; how coral reefs work covers why reefs hold so many species.
Common Misconceptions
"Brazil has 100,000 species, Colombia 54,000, Costa Rica 94,000." Numbers like these circulate without sources and mix checklists, record counts and estimates. They should not be compared, which is why this ranking relies on a single assessed dataset instead.
"Most biodiverse" means "most species of everything." In practice, every ranking measures a subset. Rankings based on birds favour Colombia; rankings based on mammals favour Indonesia; rankings based on plants favour Brazil and the Andean countries. Always check which groups were counted.
"A higher threatened count means worse conservation." Partly, but it also means more species have been assessed. A country where few species have been studied can look safer than it is.
"Biodiversity loss is only about charismatic animals." Pollinators, soil organisms and fungi underpin farming and forests. Our thought experiment on what would happen if all bees went extinct shows how losses among small species spread through food systems.
How This Ranking Could Change
The ranking will move as data improves, and several changes are likely:
- Reptiles and plants. As the IUCN completes more groups, adding them would raise countries such as Australia (reptiles) and South Africa (plants).
- Taxonomic splits. Genetic studies often show that one "species" is several. Splits tend to raise endemism in mountainous and island countries, because the hidden species usually have smaller ranges.
- Survey effort in the least-studied countries. Indonesia, Papua New Guinea and the DR Congo have the fewest records relative to their likely richness. More survey work there would probably raise their counts.
- Extinction. The ranking can also fall. Every species lost from an endemic list is permanent.
Frequently Asked Questions
Q: Which country has the most biodiversity in the world? A: On the most comparable measure available, Brazil. It has 1,258 endemic mammal, bird and amphibian species in IUCN Red List data for 2025, ahead of Indonesia with 1,081 and Australia with 862. Other measures give other answers, such as Colombia for total bird species and Indonesia for endemic mammals and birds.
Q: What are the 17 megadiverse countries? A: Conservation International's 1998 list is Australia, Brazil, China, Colombia, the Democratic Republic of the Congo, Ecuador, India, Indonesia, Madagascar, Malaysia, Mexico, Papua New Guinea, Peru, the Philippines, South Africa, the United States and Venezuela. The criteria were at least 5,000 endemic plant species and a marine coastline.
Q: Why can't we simply count every species in each country? A: Most species have not been described. A 2011 study estimated about 8.7 million eukaryotic species on Earth, with roughly 86% unnamed. National lists also use different methods, and survey effort is far higher in rich countries, so raw totals partly measure how hard scientists have looked.
Q: What is endemism and why does it matter? A: An endemic species occurs naturally in only one place. If its habitat there is destroyed, the species goes extinct worldwide. That makes endemism a better guide than total species counts to where conservation decisions have global consequences.
Q: Do megadiverse countries really hold 70% of all species? A: The figure comes from the Like-Minded Megadiverse Countries, which described themselves that way after meeting in Cancún in February 2002. It is a self-reported estimate, not a measured share, and it cannot be checked for life as a whole while most species remain undescribed.
Q: Which country has the most threatened species? A: It depends on the group. In World Bank data for 2022, Indonesia had the most threatened mammals (212) and fish (366), while Madagascar had the most threatened higher plants (2,894). These figures only include species that have been formally assessed.
Q: Is the IUCN Red List complete? A: No. In its October 2025 update it listed about 48,600 threatened species, roughly 28% of those evaluated, but evaluated species are a small fraction of all life. Groups such as insects and fungi are barely covered, so the Red List understates total risk.
The Bottom Line
The countries richest in endemic life are Brazil, Indonesia and Australia, followed by Madagascar, Mexico and the Andean nations. That conclusion holds across most reasonable measures. The precise order does not, because species counts depend on which groups are counted and how hard each country has been surveyed. The more useful lesson from the data is where life is irreplaceable: islands, tropical mountains and the few large forests that remain. Those places carry species that exist nowhere else, which is why the decisions made there matter for the whole planet. For historical context on how naturalists first noticed these patterns, see our profile of Charles Darwin.
Related Reading
- Countries With the Most Forest Cover (2025)
- Countries With the Most Oil Reserves in the World (2025)
- Countries That Run on the Most Renewable Energy (2025)
- Countries Most Affected by Natural Disasters (2025)
Sources
- IUCN Red List Summary Statistics (2025), via Our World in Data: endemic mammal species, with companion datasets for endemic birds and amphibians and threatened endemic mammals and birds.
- Mora, C. et al. (2011). How Many Species Are There on Earth and in the Ocean? PLOS Biology.
- Catálogo Taxonômico da Fauna do Brasil, GBIF dataset record.
- SiB Colombia, Cifras sobre Biodiversidad de Colombia press kit, cut-off 31 December 2025 (cifras.biodiversidad.co).
- GBIF occurrence API, country record counts queried 19 October 2026.
- World Bank, World Development Indicators, threatened species series (IUCN source), 2022.
- IPBES (2019). Global Assessment media release.
- Megadiverse countries, for the 1998 Conservation International list and criteria.
Follow new articles
Add SciHub101 to your feed reader to see new science and technology stories.
About the Author
SciHub101 is an independent science and technology publication founded and edited by Buğra Sözeri, a software engineer and app developer based in Türkiye. AI tools assist with drafting and research. Source documentation in the existing archive is uneven, and articles are being reviewed and corrected. The Editorial Team byline identifies editorial responsibility; it does not certify specialist or independent human review. Where we compare products, anything built by our own team is labelled as such — see the editorial guidelines and About page for how corrections and disclosures work.
Related Articles

Countries With the Most Electric Buses (2025)
China had more than 680,000 electric buses at the end of 2024, far ahead of any other country. This ranking compares fleets, 2024 sales, and market shares across China, India, Latin America, Europe, and the United States, and explains why the numbers are hard to line up.
Countries With the Most Active Volcanoes (2025)
Which countries host the most active volcanoes depends on how you define active. This ranking compares the Smithsonian's Holocene counts with recent-eruption counts, and explains why the United States, Japan, Indonesia, Russia, and Chile keep swapping places.
Countries With the Most Endangered Species (2025)
Madagascar now tops recent IUCN-based tallies, with Ecuador, Indonesia, Mexico, and Brazil close behind. This article shows which counts can be trusted, why rankings keep changing, and what the numbers hide.
AI & Biodiversity: Satellite Monitoring Protects Endangered Species
How neural networks detect endangered animals, track population decline, predict extinction.
Countries With the Most Forest Cover (2025)
Forests cover 4.14 billion hectares, about 32% of the world's land, per FAO's 2025 assessment. Russia, Brazil, Canada, the United States and China hold more than half. Ranked by area and by share of land, with what the numbers miss.
Countries with the Most National Parks and Protected Land (2025)
Nobody can rank countries by national park count fairly, because 'national park' means different things in different legal systems. Here is what the protected-area data actually shows, from Zambia's 41% to the 63 US parks, and what protection achieves.