Countries With the Most Forest Cover (2025)
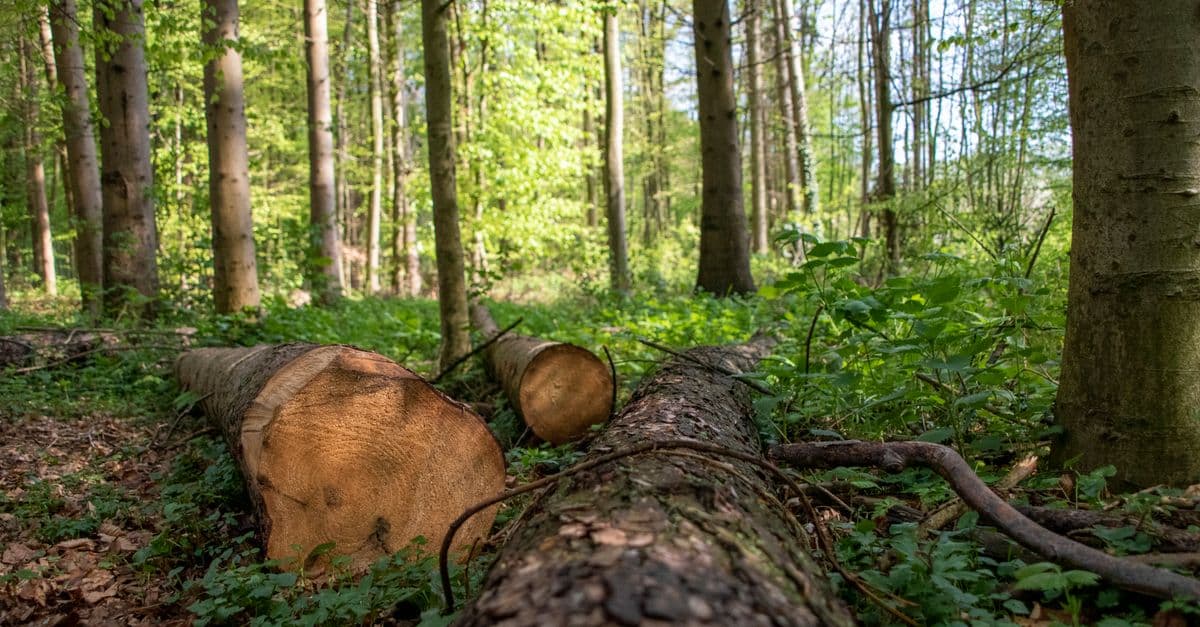
Photo: Frank Rietsch / Pexels
Forests are the largest store of living carbon on land, the habitat of most land-dwelling species and a regulator of rainfall and river flow far beyond their own borders. According to the UN Food and Agriculture Organization's Global Forest Resources Assessment 2025 (FRA 2025, released in October 2025), forests cover 4.14 billion hectares — about 32% of the world's land area, or roughly half a hectare per person. Nearly half of that forest is in the tropics.
That forest is distributed very unevenly. Five countries — Russia, Brazil, Canada, the United States and China — hold more than half of it. This page ranks countries two ways, by total forest area and by forest as a share of land area, because the two lists answer different questions and contain almost entirely different countries. It also explains how "forest" is defined, why satellite tree-cover-loss figures do not match FAO deforestation figures, and which trends matter most.
Key Takeaways
- Russia has the most forest of any country: about 833 million hectares in 2025, more than Australia's entire land area.
- Brazil (486 million ha), Canada (369 million ha), the United States (309 million ha) and China (227 million ha) complete the top five. Together the five account for more than half of global forest area.
- By share of land, small tropical countries lead: Micronesia (92%), Suriname (92%), Gabon (91%), Palau (91%) and the Solomon Islands (90%), per 2024 data.
- Global gross deforestation slowed to 10.9 million hectares a year in 2015–2025, down from 17.6 million a year in 1990–2000, according to FAO. Net loss, after counting forest expansion, was 4.12 million hectares a year.
- Satellite monitoring tells a harsher story for recent years: Global Forest Watch reported a record 6.7 million hectares of tropical primary forest loss in 2024, nearly double 2023, with fire the leading cause for the first time.
Where this data comes from
FAO's Global Forest Resources Assessment. FAO has published global forest assessments at intervals since 1948; the modern series is updated every five years. FRA 2025 covers 236 countries and areas, built on national reports from 197 of them. Countries report forest area, forest type, ownership, management, growing stock and carbon, using a common FAO definition and methodology, and FAO reviews and compiles those reports. This makes FRA the standard reference for forest area by country.
The World Bank's forest indicators republish FAO's country figures as Forest area (sq. km) and Forest area (% of land area). The tables below use those series, with the data year shown on every row. Area figures are for 2025; the share-of-land figures for small countries are for 2024, the latest year the series lists for them.
Satellite tree-cover data from the University of Maryland's GLAD lab, published through Global Forest Watch, measure something different: where tree canopy disappears in a given year, at roughly 30 × 30-metre resolution. That data is excellent for spotting where and when loss happens, but it is not a measure of deforestation in FAO's sense — see the section on why the numbers disagree below.
Earlier versions of this page cited an "FAO assessment 2024" and figures such as 815 million hectares for Russia. Those numbers came from the previous FRA 2020 cycle and have been replaced with FRA 2025 values.
How FAO defines a forest
FAO's definition is the reason forest figures can look surprising. In FRA terms, forest is land spanning more than 0.5 hectares, with trees taller than 5 metres and a canopy cover of more than 10%, or trees able to reach those thresholds in place. Crucially, it is a land-use definition: land predominantly used for agriculture or urban purposes does not count as forest even if trees grow on it, while land that has been temporarily cleared by logging or fire but is expected to regrow still counts as forest.
Three consequences follow:
- Open woodlands count. A 10% canopy threshold includes savanna woodlands and sparse dry forests. That is why countries such as Angola, Zambia and Mozambique have large forest areas.
- Plantations count. A commercial eucalyptus or pine plantation is forest in FAO's statistics. FRA 2025 puts planted forests at about 312 million hectares, about 8% of the global total.
- Clear-cuts may not count as loss. A boreal forest that is harvested and replanted remains forest land throughout. Satellite canopy data, by contrast, records the harvest as tree-cover loss.
Most of the world's forest — about 3.83 billion hectares, or 92% — is naturally regenerating, per FRA 2025. Of that, at least 1.18 billion hectares is primary forest: native forest with no clearly visible signs of human activity and largely undisturbed ecological processes.
Top 20 countries by total forest area
| Rank | Country | Forest area (million ha) | % of land area | Data year |
|---|---|---|---|---|
| 1 | Russia | 832.6 | 50.8% | 2025 |
| 2 | Brazil | 486.1 | 58.5% | 2025 |
| 3 | Canada | 368.8 | 42.0% | 2025 |
| 4 | United States | 308.9 | 33.8% | 2025 |
| 5 | China | 227.2 | 24.0% | 2025 |
| 6 | DR Congo | 139.2 | 61.5% | 2025 |
| 7 | Australia | 133.6 | 17.4% | 2025 |
| 8 | Indonesia | 96.0 | 50.7% | 2025 |
| 9 | India | 72.7 | 24.4% | 2025 |
| 10 | Peru | 67.2 | 52.7% | 2025 |
| 11 | Mexico | 66.3 | 34.2% | 2025 |
| 12 | Angola | 63.3 | 51.2% | 2025 |
| 13 | Colombia | 59.5 | 53.7% | 2025 |
| 14 | Bolivia | 54.4 | 50.2% | 2025 |
| 15 | Venezuela | 47.1 | 53.4% | 2025 |
| 16 | Argentina | 46.6 | 17.1% | 2025 |
| 17 | Central African Republic | 45.1 | 72.5% | 2025 |
| 18 | Zambia | 44.9 | 60.5% | 2025 |
| 19 | Tanzania | 43.4 | 49.6% | 2025 |
| 20 | Papua New Guinea | 34.0 | 75.2% | 2025 |
Source: FAO Global Forest Resources Assessment 2025, via World Bank World Development Indicators (AG.LND.FRST.K2 and AG.LND.FRST.ZS). Converted from km² to million hectares. Forest area is the 2025 value; the "% of land area" column is the World Bank's latest published value (2024).
Against FAO's global total of 4.14 billion hectares, the top five countries hold about 2.22 billion hectares (roughly 54%) and the top ten about 2.73 billion hectares (roughly 66%). Small differences in rounding and in the World Bank's global aggregate mean these shares are approximate.
Compared with the older FRA 2020-based table on this page, several positions changed. The DR Congo moved above Australia, Angola and Argentina rose, and the Central African Republic and Papua New Guinea entered the top 20 while Myanmar and Mozambique dropped out (Mozambique now sits just outside at 32.2 million ha). Some of these shifts reflect updated national inventories and mapping, not only real change on the ground.
Top countries by forest share of land
| Rank | Country | Forest (% of land area) | Region | Data year |
|---|---|---|---|---|
| 1 | Micronesia (Federated States) | 92.1% | Pacific | 2024 |
| 2 | Suriname | 91.5% | Guiana Shield, South America | 2024 |
| 3 | Gabon | 91.4% | Congo Basin, Central Africa | 2024 |
| 4 | Palau | 90.8% | Pacific | 2024 |
| 5 | Solomon Islands | 89.8% | Pacific (Melanesia) | 2024 |
| 6 | Guyana | 87.1% | Guiana Shield, South America | 2024 |
| 7 | Equatorial Guinea | 86.1% | Central Africa | 2024 |
| 8 | Dominica | 76.4% | Caribbean | 2024 |
| 9 | Papua New Guinea | 75.2% | Pacific (Melanesia) | 2024 |
| 10 | Guinea-Bissau | 74.8% | West Africa | 2024 |
| 11 | Vanuatu | 74.6% | Pacific | 2024 |
| 12 | Finland | 74.2% | Northern Europe | 2024 |
Source: FAO, via World Bank indicator AG.LND.FRST.ZS (Forest area, % of land area). American Samoa (79.6%), a US territory, is omitted from the numbered list.
The share-of-land list is dominated by small, humid tropical countries — Pacific islands, the Guiana Shield and the Congo Basin — plus one boreal outlier, Finland, the most forested country in Europe by share. Several of these countries also have very low population density; Suriname and Guyana are among the least densely populated countries in the world, as the ranking of countries with the highest population density shows from the other end.
Area versus percentage: two different questions
The two rankings almost do not overlap. Only Papua New Guinea appears in both top 20 lists above. That is not a contradiction; each answers a different question.
Total area answers: where is the world's forest? It matters for the global carbon cycle, for biodiversity at continental scale and for international climate policy. A country with 300 million hectares of forest can affect global outcomes in a way a 90%-forested island cannot.
Share of land answers: how much of this country is forest? It matters for national economies, local water supply and the political weight of forestry. A country that is 90% forest cannot treat forest policy as a side issue.
Neither measures forest condition. A recently burned or heavily logged boreal stand and an intact old-growth rainforest are both counted as forest. Plantations and natural forests are added together. For biodiversity, the age, structure and continuity of a forest matter more than its extent — a point developed in our ranking of countries with the most biodiversity.
Why Russia dominates
Russia's 832.6 million hectares are more forest than any other country and, at about 8.3 million km², more than the entire land area of Australia (about 7.7 million km²). Most of it is boreal forest, or taiga: conifer-dominated forests of larch, pine, spruce and fir, along with birch, stretching across Siberia and the Russian Far East. Boreal forests grow slowly, and much of their carbon is stored in soils and, in the north, in permafrost rather than in trunks.
Russia's forests face pressures that differ from those in the tropics. Wildfire is the dominant disturbance across much of Siberia, and hot, dry summers can drive very large fire seasons. Global Forest Watch cited intense fire seasons in the boreal zone as a driver of the overall rise in global tree cover loss in 2024. Commercial logging, including timber exports, also affects accessible forests, particularly in the south and the Far East. Because burned and logged boreal land usually remains classified as forest, Russia's FAO forest area can stay stable even when large areas of canopy are lost in a given year.
Brazil and the Amazon
Brazil's 486.1 million hectares make it the leading tropical forest country, and about 58.5% of its land is forested. Most of that is in the Amazon, but Brazil also contains the Atlantic Forest along the coast, the Cerrado savanna-woodlands and the Pantanal wetlands, each with distinct ecosystems.
The Amazon's influence extends far beyond its edges. Through transpiration, trees return large volumes of water to the atmosphere, contributing to rainfall downwind — a process explained in more detail in how the water cycle works.
Brazilian deforestation has swung sharply with policy. Brazil's space agency, INPE, measures annual clearing in the Legal Amazon through its PRODES system. Clearing peaked in the early 2000s, fell sharply over the following decade, and rose again in the late 2010s and early 2020s. In the year from August 2024 to July 2025, PRODES recorded 5,796 km² of deforestation, an 11% fall from the previous year and the lowest level since 2014, according to Brazilian government data reported in October 2025.
At the same time, 2024 was a record fire year. Global Forest Watch found that Brazil accounted for 42% of all tropical primary forest loss in 2024, and that 66% of Brazil's loss that year was caused by fire. Fire and clearing are linked — fire is often used to clear land — but they respond to different drivers, including drought.
Canada and the United States
Canada's 368.8 million hectares are dominated by boreal forest, which stores large amounts of carbon in trees, soils and peatlands. Canada's forests are mostly publicly owned and much of the harvested area is regenerated, so FAO forest area changes little year to year. The main disturbances are wildfire and insect outbreaks; Canada's intense fire seasons were another driver of the 2024 rise in global tree cover loss reported by Global Forest Watch.
The United States, with 308.9 million hectares (33.8% of its land), has a wide range of forest types: the temperate rainforests of the Pacific Northwest, the mixed hardwoods of the East, the pine forests of the Southeast and the boreal forests of Alaska. A large share of US forest is privately owned, which is unusual — globally, FRA 2025 reports that 71% of forests are publicly owned and 24% privately owned.
The tropical belt: DR Congo, Indonesia, Peru, Colombia and Bolivia
DR Congo (139.2 million ha, 61.5% of land) holds the largest share of the Congo Basin rainforest, the second-largest tropical forest region after the Amazon. Its forest loss is driven mostly by small-scale agriculture and charcoal production rather than industrial commodity farming. Global Forest Watch reported that the DRC and the Republic of Congo both recorded their highest primary forest loss on record in 2024.
Indonesia (96.0 million ha) has some of the world's most carbon-dense forests, especially on peat soils, where drainage and fire release carbon stored over thousands of years. Commodity crops, including oil palm and pulpwood plantations, have been major historical drivers of clearing. Global Forest Watch reported an 11% fall in Indonesia's primary forest loss in 2024, against the global trend.
Bolivia (54.4 million ha) is the clearest example of the 2024 fire surge. Its primary forest loss rose about 200% to 1.5 million hectares, making it the second-largest source of tropical primary forest loss that year after Brazil; more than half was caused by fire.
Peru and Colombia together hold more than 125 million hectares of forest, mostly in the western Amazon. Both lose forest to cattle ranching, agriculture and illegal mining, and the pace of clearing has varied with security conditions and enforcement.
China, India and planted forests
China's 227.2 million hectares include very large planted forests from decades of state afforestation programmes. A 2019 study in Nature Sustainability, led by Chi Chen of Boston University and using NASA satellite data from 2000–2017, found that global green leaf area rose by about 5% since the early 2000s and that at least 25% of that gain came from China, even though China and India together hold only about 9% of the planet's vegetated land. In China, forests and croplands each drove much of the greening; in India, most came from croplands.
That distinction matters. Greening is not the same as new natural forest, and planted forests — often a single species — typically support less biodiversity than the native forests they sometimes replace. Planted forests can still store carbon, reduce erosion and supply timber, which lowers pressure on natural forests. The basics of how leaves turn light and CO₂ into growth are covered in how photosynthesis works.
Global trend: slowing loss, but still loss
FRA 2025 gives the longest consistent view of forest change by country. Its headline numbers:
| Indicator (FAO FRA 2025) | Value |
|---|---|
| Global forest area | 4.14 billion ha (about 32% of land) |
| Gross deforestation, 1990–2000 | 17.6 million ha per year |
| Gross deforestation, 2015–2025 | 10.9 million ha per year |
| Net forest loss, 1990s | 10.7 million ha per year |
| Net forest loss, 2015–2025 | 4.12 million ha per year |
| Forest expansion, 2015–2025 | 6.78 million ha per year |
| Primary forest | at least 1.18 billion ha |
| Planted forest | about 312 million ha |
| Forest in legally protected areas | 813 million ha (about 20%) |
| Forest carbon stock | 714 gigatonnes |
Source: FAO, October 2025.
Gross versus net. Deforestation is the conversion of forest to another land use, such as cropland or pasture. Forest expansion is new forest on land that was not forest, through planting or natural regrowth. Net change is expansion minus deforestation. A country can lose old-growth tropical forest and gain plantations elsewhere and report a modest net change — which is why gross deforestation is the better measure of what is being lost.
FAO reports that deforestation slowed in every region in the last decade and that the largest declines in forest area during that time occurred in Africa and South America. Fire affects an average of about 261 million hectares of land per year, nearly half of it forest, and pests and diseases affected about 41 million hectares of forest in 2020.
Why FAO and Global Forest Watch numbers disagree
Readers often see two sets of numbers that seem incompatible: FAO's net loss of about 4 million hectares a year, and Global Forest Watch's report that global tree cover loss reached about 30 million hectares in 2024 — roughly the size of Italy. Both can be right, because they measure different things.
| FAO FRA | Global Forest Watch (UMD GLAD) | |
|---|---|---|
| What it measures | Forest land use and its change | Loss of tree canopy detected by satellite |
| Source | National reports, reviewed by FAO | Landsat imagery, ~30 m resolution |
| Counts harvest and regrowth? | Harvested land usually stays "forest" | Harvest, fire and storms all count as loss |
| Counts gains? | Yes — net change includes expansion | Headline figures are gross loss only |
| Plantations | Counted as forest | Tree cover includes plantations and tree crops |
| Time step | Five-year assessments, annual rates | Annual, with near-real-time alerts |
Caveats to keep in mind when reading tree-cover-loss figures:
- Loss is not permanent deforestation. Forests can regrow after fire, logging or storms. A boreal fire year shows up as a spike in tree cover loss even if the land returns to forest.
- Fire is natural in some ecosystems. In the boreal zone, fire is part of the natural cycle; in tropical rainforests, fires are mostly human-caused, often linked to land clearing, according to WRI.
- Primary forest loss is a subset. The 6.7 million hectares of tropical primary forest loss in 2024 is part of, not in addition to, the 30 million hectares of total tree cover loss.
- Methods change. Improvements in satellite processing can make year-to-year comparisons imperfect; trends over several years are more reliable than any single year.
The two sources complement each other: FAO gives the official, internationally agreed land-use picture; satellite data shows where and when canopy disappears, often well before national statistics catch up. The same satellite approach is increasingly used to track wildlife habitat, as covered in AI and satellite biodiversity monitoring.
Common misconceptions
"The most forested countries are the most important for conservation." Total area matters for carbon, but some smaller countries hold irreplaceable biodiversity. Intact tropical and island forests can have far higher species richness per hectare than large boreal tracts.
"A stable forest area means no deforestation." Net figures can hide large gross losses of natural forest offset by plantation gains.
"Planting trees cancels out clearing." Young plantations store far less carbon than the mature forests they may replace and support fewer species. Protecting existing forest and restoring degraded native forest generally deliver more per hectare.
"Forest loss is a tropical problem." Most deforestation in the FAO sense occurs in the tropics, but boreal and temperate forests face growing pressure from fire, insects and drought, which satellite data increasingly shows.
Frequently Asked Questions
Q: Which country has the most forest in the world? A: Russia, with about 832.6 million hectares of forest in 2025 according to FAO data published through the World Bank. That is roughly half of Russia's land area and about one-fifth of the world's forest.
Q: Which country has the highest percentage of forest cover? A: In the World Bank's 2024 FAO-based data, the Federated States of Micronesia (92.1%), Suriname (91.5%) and Gabon (91.4%) lead, followed by Palau and the Solomon Islands. These are small countries, so their forests are modest in total area.
Q: How much of the Earth is covered by forest? A: About 4.14 billion hectares, or roughly 32% of global land area, according to FAO's Global Forest Resources Assessment 2025. That is about half a hectare of forest per person on Earth.
Q: Is global forest cover still shrinking? A: Yes, but more slowly. FAO estimates net forest loss of 4.12 million hectares a year in 2015–2025, down from 10.7 million a year in the 1990s. Gross deforestation was 10.9 million hectares a year over the same recent period.
Q: Why do FAO and Global Forest Watch report such different numbers? A: FAO measures forest land use and net change, counting regrowth and plantations. Global Forest Watch measures gross loss of tree canopy by satellite, including fire and harvesting that may later regrow. Both are valid; they answer different questions.
Q: Do tree plantations count as forest? A: In FAO statistics, yes. Planted forests cover about 312 million hectares, around 8% of global forest area. They provide timber and some carbon storage but usually support less biodiversity than natural forests.
Q: What caused the record forest loss in 2024? A: Fire. Global Forest Watch reported that fires were the leading cause of tropical primary forest loss in 2024 for the first time, accounting for nearly half of the 6.7 million hectares lost, amid extreme heat and drought.
The Bottom Line
The world's forest is concentrated in a small number of very large countries. Russia, Brazil, Canada, the United States and China hold more than half of it, and the policies of those five — along with the DR Congo, Indonesia and the other tropical forest nations — will shape global carbon and biodiversity outcomes more than those of every other country combined. FAO's 2025 assessment shows deforestation slowing in every region, while satellite data from 2024 shows how quickly fire and drought can reverse gains. Forest area alone is an incomplete measure: what kind of forest remains, how old it is and whether it is connected matter as much as how many hectares there are. For the climate side of the story, see climate change explained.
Sources
- FAO — Global deforestation slows, but forests remain under pressure (FRA 2025 release), October 2025
- World Bank, World Development Indicators — Forest area (sq. km), FAO data
- World Resources Institute / Global Forest Watch — Global forest loss shatters records in 2024, fueled by massive fires
- NASA Earth Observatory — China and India lead the way in greening
Related Reading
Follow new articles
Add SciHub101 to your feed reader to see new science and technology stories.
About the Author
SciHub101 is an independent science and technology publication founded and edited by Buğra Sözeri, a software engineer and app developer based in Türkiye. AI tools assist with drafting and research. Source documentation in the existing archive is uneven, and articles are being reviewed and corrected. The Editorial Team byline identifies editorial responsibility; it does not certify specialist or independent human review. Where we compare products, anything built by our own team is labelled as such — see the editorial guidelines and About page for how corrections and disclosures work.
Related Articles
Countries Most Affected by Natural Disasters (2025)
Natural disasters kill thousands and affect well over a hundred million people every year. But the burden is not spread evenly. A handful of countries experience recurring, devastating disasters — and the overlap between vulnerability and poverty is striking.

Countries With the Most Electric Buses (2025)
China had more than 680,000 electric buses at the end of 2024, far ahead of any other country. This ranking compares fleets, 2024 sales, and market shares across China, India, Latin America, Europe, and the United States, and explains why the numbers are hard to line up.
Deforestation Explained — Causes, Effects, and Real Solutions
The world clears about 10.9 million hectares of forest a year, slightly more than the area of Iceland. Here is what drives it, what it costs the climate, and which fixes have measurable results.
The Amazon Rainforest: Earth's Lungs Explained by Science
The Amazon is not Earth's oxygen factory, but it stores vast carbon and recycles rain across a continent. Here is what the evidence says about deforestation, drought, and tipping points.
AI & Biodiversity: Satellite Monitoring Protects Endangered Species
How neural networks detect endangered animals, track population decline, predict extinction.
Countries With the Cleanest Air in the World (2025)
Air quality is one of the most direct indicators of environmental health. This ranking shows which countries and territories breathe the cleanest air, which suffer the worst pollution, and why small islands keep beating industrial giants on the numbers.