Countries Most Affected by Natural Disasters (2025)
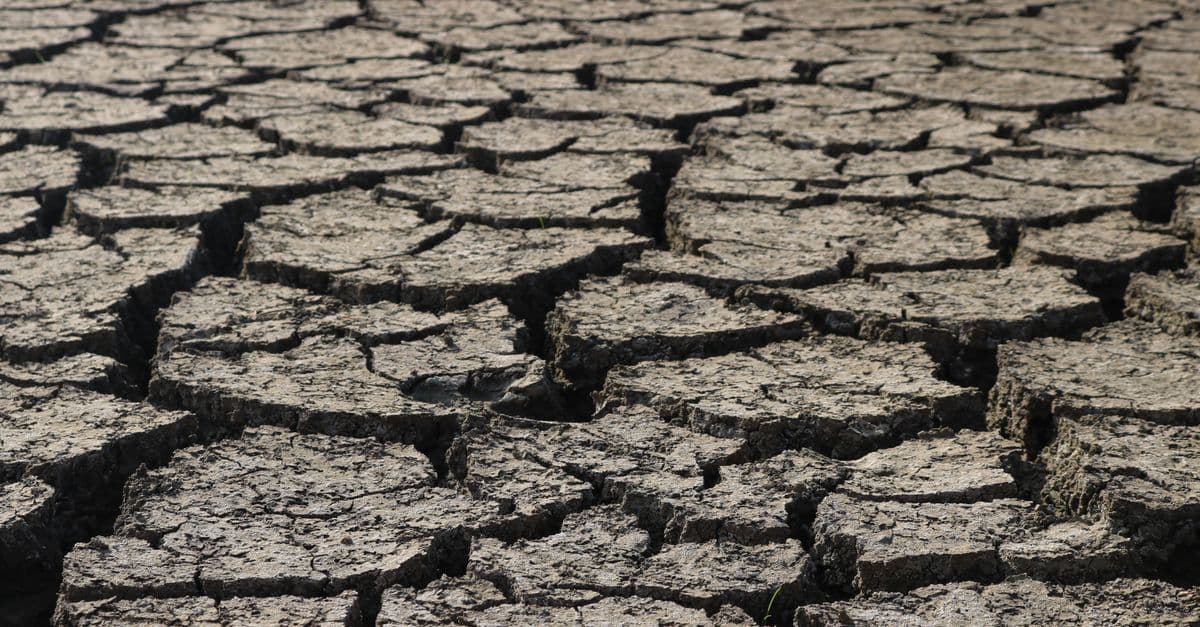
Photo: Feyza Daştan / Pexels
Natural disasters (floods, earthquakes, storms, droughts, landslides, heat waves and wildfires) are among the most powerful forces shaping human welfare. In 2024, the international Emergency Events Database (EM-DAT) recorded 393 disasters linked to natural hazards, which killed 16,753 people, affected 167.2 million and caused about US$242 billion in economic losses (CRED, 2024 Disasters in Numbers, PDF). But the geography of disaster is deeply uneven, and the answer to "which country is most affected?" depends entirely on what you measure.
A country can top the list for the number of events, the number of deaths, the size of its economic losses, or its underlying risk, and these are rarely the same country. This page sets out each measure separately, names the source and year for every figure, and explains why the rankings differ.
Four Ways to Rank "Most Affected"
Before any table, it helps to be clear about what each type of number captures.
| Measure | What it counts | Typical leaders | Main source used here |
|---|---|---|---|
| Frequency | Number of recorded disaster events per year | Large, hazard-diverse countries (USA, China, Indonesia, Philippines, India) | EM-DAT (CRED), 2024 |
| Deaths and people affected | Mortality, injuries, homelessness, displacement | Densely populated, lower-income countries | EM-DAT (CRED), 2024 |
| Economic loss | Damage to property and infrastructure in US dollars | High-income countries with valuable assets in harm's way (above all the USA) | Munich Re, 2025; EM-DAT, 2024 |
| Risk index | Exposure to hazards combined with social vulnerability | Countries that are both highly exposed and less able to cope (Philippines, India, Indonesia) | WorldRiskReport 2025 |
Frequency rewards size: a country as large as the United States or China will log more separate events than a small island state, even if each event is less devastating per person. Economic loss rewards wealth: a hurricane that destroys expensive coastal property in Florida generates a bigger dollar figure than a cyclone that destroys far more homes in a poorer country. Deaths and risk indexes capture vulnerability better, and they point to a different set of countries.
Where this data comes from
- EM-DAT (Emergency Events Database). Maintained by the Centre for Research on the Epidemiology of Disasters (CRED) at UCLouvain in Belgium, EM-DAT is the most widely used global disaster database. It records events from 1900 onward that meet thresholds such as 10 or more deaths, 100 or more people affected, or a declaration of emergency or call for international assistance. CRED publishes an annual "Disasters in Numbers" report.
- WorldRiskReport. Published annually since 2011 by Bündnis Entwicklung Hilft, a German alliance of aid organisations, with the Institute for International Law of Peace and Armed Conflict (IFHV) at Ruhr University Bochum. Its WorldRiskIndex covers 193 countries and combines exposure to earthquakes, tsunamis, floods, cyclones, droughts and sea-level rise with vulnerability, made up of susceptibility, lack of coping capacity and lack of adaptive capacity (WorldRiskReport 2025, PDF).
- Reinsurers' catastrophe reports. Munich Re and Swiss Re publish annual estimates of overall and insured losses. These are the standard references for economic impact (Munich Re, natural disaster figures 2025).
- UNDRR. The UN Office for Disaster Risk Reduction tracks progress under the Sendai Framework for Disaster Risk Reduction 2015–2030 and publishes the Global Assessment Report (GAR); the 2025 edition focused on the financial case for investing in resilience.
Limitations. Reporting quality varies. Wealthy countries document losses systematically, while deaths from drought and heat are often unrecorded; CRED itself warns that drought mortality "is usually not reported" in EM-DAT. A single storm crossing several countries may appear as several entries. Economic losses for informal economies are underestimated. Treat every figure below as the best available estimate for its year, not an exact count.
Key Takeaways
- In 2024, EM-DAT recorded the most disasters in the United States (29), followed by Indonesia (20), China (18), the Philippines (18) and India (15).
- The WorldRiskIndex 2025 ranks the Philippines as the highest-risk country (score 46.56), followed by India (40.73) and Indonesia (39.80).
- Economic losses are dominated by the United States: in 2024, US hurricanes Helene and Milton were the two costliest disasters worldwide in EM-DAT's tally.
- Global disaster losses in 2025 were about US$224 billion, of which about US$108 billion was insured, according to Munich Re.
- Deaths have fallen sharply in countries that invested in warnings and shelters, Bangladesh being the best-known example, but the most vulnerable countries still carry a disproportionate share of the human toll.
Ranking 1: Most Disaster Events (EM-DAT, 2024)
This is the most literal answer to "which countries have the most natural disasters?". It counts how many separate events were recorded in each country during 2024.
| Rank | Country | Disasters recorded in 2024 | Main hazards (2024 and typical) |
|---|---|---|---|
| 1 | United States | 29 | Hurricanes, severe convective storms, floods, wildfires, heat |
| 2 | Indonesia | 20 | Floods, landslides, earthquakes, volcanic activity |
| 3 (tie) | China | 18 | Floods, typhoons, earthquakes, drought |
| 3 (tie) | Philippines | 18 | Typhoons, floods, landslides, volcanic activity |
| 5 | India | 15 | Monsoon floods, heat waves, cyclones, landslides |
| 6 | Brazil | 11 | Floods, landslides, drought |
| 7 | Vietnam | 10 | Typhoons, floods |
| 8 (tie) | Afghanistan | 8 | Floods, severe winter conditions, earthquakes |
| 8 (tie) | Mexico | 8 | Hurricanes, floods, drought |
| 10 (tie) | Canada | 7 | Wildfires, floods, storms |
| 10 (tie) | Thailand | 7 | Floods, storms |
Source: CRED, "2024 Disasters in Numbers" (EM-DAT, preliminary data as of 8 April 2025), Figure 1. Two countries share 10th place with seven disasters, so 11 are listed.
By continent, Asia recorded 167 of the 393 disasters in 2024, the Americas 118, Africa 75, Europe 24 and Oceania 9. Floods (142 events) and storms (147) made up three-quarters of the total. Storms were well above their 2004–2023 annual average of 106, while earthquakes (14 against an average of 26) were well below.
Single-year counts bounce around. A quiet typhoon season or a run of severe US storms can reshuffle the middle of the table. Over longer periods, however, the same handful of large, hazard-diverse countries (China, the United States, India, Indonesia and the Philippines) dominate EM-DAT's event counts year after year.
Ranking 2: Highest Disaster Risk (WorldRiskIndex 2025)
Counting events says nothing about how well a country can cope. The WorldRiskIndex tries to capture that. Each country's score is the geometric mean of its exposure (how many people face severe natural hazards) and its vulnerability (how susceptible society is, and how much capacity it has to cope and adapt). Higher means riskier.
| Rank | Country | WorldRiskIndex | Exposure | Vulnerability |
|---|---|---|---|---|
| 1 | Philippines | 46.56 | 39.99 | 54.20 |
| 2 | India | 40.73 | 35.99 | 46.10 |
| 3 | Indonesia | 39.80 | 39.89 | 39.71 |
| 4 | Colombia | 39.26 | 31.54 | 48.86 |
| 5 | Mexico | 38.96 | 50.08 | 30.31 |
| 6 | Myanmar | 36.91 | 22.43 | 60.74 |
| 7 | Mozambique | 34.39 | 18.10 | 65.33 |
| 8 | Russian Federation | 31.22 | 28.35 | 34.38 |
| 9 | China | 30.62 | 64.59 | 14.52 |
| 10 | Pakistan | 26.82 | 13.11 | 54.85 |
| 11 | Bangladesh | 26.71 | 16.57 | 43.07 |
| 12 | Papua New Guinea | 26.51 | 18.84 | 37.29 |
| 13 | Vietnam | 25.92 | 26.73 | 25.14 |
| 14 | Peru | 25.81 | 16.65 | 40.02 |
| 15 | Somalia | 24.89 | 8.55 | 72.45 |
Source: Bündnis Entwicklung Hilft / IFHV, WorldRiskReport 2025 (focus: floods), WorldRiskIndex table. Scores range from 0 to 100.
The two columns on the right explain a lot. China has the highest exposure score in the world (64.59) but low vulnerability (14.52), so it lands ninth. Somalia has relatively low exposure but one of the highest vulnerability scores, which still puts it in the top 15. Japan, often held up as the model of disaster preparedness, has very high exposure (43.67, third in the world) but low vulnerability, and ranks 17th overall. The United States ranks 21st. Germany, for comparison, ranks 95th with a score of 4.28.
Note that earlier versions of this page used an older WorldRiskIndex table that ranked several small Pacific islands near the top. In the 2025 edition, large countries such as India and Indonesia rank at the top, while small islands such as Vanuatu (44th) and Tonga (104th) rank much lower.
Ranking 3: Deadliest and Costliest Recent Events
Deaths and dollars point to different countries again.
Deadliest disasters of 2024 (EM-DAT)
| Country | Event | Deaths |
|---|---|---|
| Saudi Arabia | Heat wave (Hajj pilgrimage) | 1,301 |
| Afghanistan | Severe winter conditions | 1,197 |
| United States | Heat wave | 1,006 |
| India | Heat wave | 733 |
| Papua New Guinea | Landslide | 670 |
| Chad | Flood | 576 |
| Pakistan | Heat wave | 568 |
| Japan | Earthquake (1 January) | 551 |
| Myanmar | Typhoon Yagi | 460 |
| Niger | Flood | 396 |
Source: CRED, 2024 Disasters in Numbers, Table 1. Deaths include missing persons presumed dead. Heat deaths are widely undercounted; the US figure covers only Phoenix and Las Vegas.
The 2024 total of 16,753 deaths was far below the 2004–2023 average of 65,566 a year. CRED attributes that mainly to the absence of a mass-casualty event such as a major earthquake in a densely populated area, not to a sudden improvement in safety. Averages are dominated by rare catastrophes: the 2004 Indian Ocean tsunami alone killed more than 226,000 people.
Costliest disasters of 2024 (EM-DAT)
| Country | Event | Economic loss (US$) |
|---|---|---|
| United States | Hurricane Helene | 56 billion |
| United States | Hurricane Milton | 38 billion |
| Japan | Noto earthquake | 15 billion |
| Spain | Valencia floods | 11 billion |
| United States | Hurricane Beryl | 7.2 billion |
| Brazil | Rio Grande do Sul floods | 7 billion |
Source: CRED, 2024 Disasters in Numbers, Table 3.
The Americas accounted for 77.1% of all 2024 economic losses in EM-DAT's data (about US$187 billion), yet only 13.7% of deaths. Asia accounted for 58.6% of deaths but 13.3% of losses. That contrast is the clearest single illustration of how "most affected" changes with the yardstick.
Global losses in 2025 (Munich Re)
Munich Re's annual review, published in January 2026, put overall natural disaster losses in 2025 at about US$224 billion, down from US$368 billion in 2024 (inflation-adjusted) and below the 10-year average of US$266 billion. Insured losses were about US$108 billion, the second year running above US$100 billion. About 17,200 people died, below the 10-year average of 17,800. The costliest event was the January 2025 Los Angeles wildfires (about US$53 billion overall, US$40 billion insured); the deadliest was the March 2025 magnitude 7.7 Myanmar earthquake, which killed about 4,500 people and caused about US$12 billion in losses, very little of it insured.
Roughly half of 2025's losses were uninsured, compared with a 10-year average of about 60%. That "protection gap" is far larger in lower-income countries, where most losses are borne directly by households and governments.
The Philippines: The Highest-Risk Country on Earth
No country of significant population faces a more intense multi-hazard environment than the Philippines, which topped the WorldRiskIndex again in 2025. The archipelago sits in the path of the western Pacific typhoon belt, the most active tropical cyclone basin in the world, and on the Pacific Ring of Fire, with active volcanoes and multiple fault systems. The mechanics of those storms are explained in how hurricanes and typhoons form.
Typhoon Haiyan (known locally as Yolanda) in November 2013 was one of the most powerful tropical cyclones ever to make landfall. By mid-December 2013 the country's disaster agency, the NDRRMC, had confirmed more than 6,000 deaths, with about 1,800 more people missing. In 2024, EM-DAT recorded 18 disasters in the Philippines, and Typhoon Trami (Kristine) alone affected an estimated 9.7 million people.
The Philippines has substantially improved forecasting, warnings and pre-emptive evacuation since Haiyan. The country's high WorldRiskIndex score reflects not only exposure but also vulnerability: its vulnerability score of 54.20 is far above that of Japan, which faces broadly similar hazards.
India and Bangladesh: Monsoon, Cyclone and Heat
India's rise to second place in the WorldRiskIndex reflects its huge exposed population: hundreds of millions of people live in flood plains, along cyclone-prone coasts and in regions of extreme heat. In 2024, EM-DAT recorded 15 disasters in India, including heat waves between March and June that reportedly killed 733 people, and floods in late August that affected 8 million.
Bangladesh, ranked 11th in the WorldRiskIndex 2025, is the world's most famous disaster-risk success story. It occupies the delta of the Ganges, Brahmaputra and Meghna rivers, and much of it lies only a few metres above sea level. The 1970 Bhola cyclone is estimated to have killed between 300,000 and 500,000 people. Cyclone Sidr in 2007, a comparably powerful storm, killed roughly 3,400. The difference came from a national network of cyclone shelters, community volunteer warning systems and organised evacuations built up over decades.
Bangladesh's risk has not disappeared. In 2024 it accounted for four of EM-DAT's ten disasters affecting the most people: a heat wave linked to school closures affecting 33 million children, two separate floods affecting 5.8 million and 5.1 million, and Cyclone Remal, which affected 4.6 million. Saltwater intrusion and rising sea levels are long-term pressures, covered in more detail in the countries most vulnerable to climate change.
China: High Exposure, Falling Vulnerability
China's position near the top of event counts reflects its size and geographic range. It spans subtropical to subarctic climates, has major earthquake zones in Sichuan, Yunnan and Tibet, is struck by typhoons on its southeastern coast, and has great rivers (the Yangtze, Yellow and Pearl) with long histories of catastrophic flooding. Its WorldRiskIndex exposure score is the highest in the world.
Its history includes some of the deadliest disasters ever recorded. The 1976 Tangshan earthquake killed 242,000 people according to the official toll, with some outside estimates far higher. The 2008 Sichuan earthquake left more than 87,000 people dead or missing, including thousands of schoolchildren in collapsed school buildings, which led to tighter seismic construction standards. How these quakes are generated and measured is covered in how earthquakes work.
Flood control and early warning have improved enormously, yet extreme rainfall still exposes gaps. In July 2021, record rainfall in Henan province flooded Zhengzhou's subway and streets. A State Council investigation later set the toll at 398 dead or missing, most of them in Zhengzhou, up from the 302 deaths and 50 missing that local officials had reported, and found that Zhengzhou officials had concealed or delayed reporting of 139 cases.
Indonesia: Ring of Fire and Monsoon Floods
Indonesia ranked third in the WorldRiskIndex 2025 and second in EM-DAT's 2024 event count, with 20 recorded disasters. It sits on the junction of several tectonic plates, making it one of the most earthquake- and volcano-prone countries on Earth; our guide to how volcanoes work explains why subduction zones like Indonesia's produce such explosive eruptions. On 26 December 2004, a magnitude 9.1 earthquake off Sumatra triggered the Indian Ocean tsunami, the deadliest in modern history, which killed about 226,000 people across a dozen countries.
The United States: Disaster's Richest Victim
The United States topped EM-DAT's 2024 event count with 29 disasters and dominates every ranking of economic loss. In 2024, hurricanes Helene (US$56 billion) and Milton (US$38 billion) were the two costliest disasters in the world, and EM-DAT recorded cumulative US tropical storm damage above US$100 billion.
US disaster geography is notably varied:
- Gulf and Atlantic coasts: The hurricane season runs from June to November, and major hurricane landfalls produce the most expensive disasters on Earth.
- The central plains: The United States records more tornadoes than any other country, a product of its geography explained in how tornadoes form.
- California and the West: Wildfire, drought and earthquake risk; the January 2025 Los Angeles wildfires were the costliest insured event of 2025.
- Pacific Northwest and Alaska: The Cascadia Subduction Zone is capable of a magnitude 9 earthquake and tsunami.
The country's long-running count of "billion-dollar disasters", maintained by NOAA's National Centers for Environmental Information, recorded a record 28 such events in 2023. NOAA stopped updating that product in May 2025, with no updates beyond calendar year 2024; its archive remains available.
Despite this exposure, the United States ranks only 21st on the WorldRiskIndex, because its capacity to warn, respond, insure and rebuild is high. Its losses are huge in dollars precisely because so much expensive property sits in harm's way.
Japan: The Preparedness Benchmark
Japan has the third-highest hazard exposure in the WorldRiskIndex 2025 (43.67) but ranks only 17th overall because its vulnerability is low. Decades of investment in seismic building codes, a national earthquake early warning system, tsunami defences, public drills and a highly functional emergency management system all reduce the impact of events that would be catastrophic elsewhere. The country's 1 January 2024 Noto Peninsula earthquake still killed 551 people and caused about US$15 billion in damage, but that is a fraction of what an earthquake of comparable strength has caused in less prepared regions. Monitoring networks are the foundation of that system, as described in how the seismograph made earthquakes measurable.
Climate Change and Escalating Disaster Risk
Not all hazards are affected by climate change. Earthquakes, tsunamis and volcanic eruptions are geological. But weather-related hazards, which in Munich Re's 2025 tally made up 92% of all losses, are shifting:
- Heavy rainfall and floods: Warmer air holds more moisture, so the heaviest downpours are becoming more intense in most regions.
- Tropical cyclones: The total number may not rise, but the proportion of the most intense storms is expected to increase, and rainfall rates in them are rising.
- Heat waves: Longer and more intense, and particularly dangerous in South Asia, the Middle East and the Sahel. Four of EM-DAT's ten deadliest 2024 events were heat waves.
- Wildfires: Longer dry seasons and higher temperatures increase fire weather in many regions; wildfire events in EM-DAT almost doubled in 2024 (21) compared with the 2004–2023 annual average (11).
- Drought: Prolonged drying in parts of southern and eastern Africa, the Mediterranean and the southwestern United States. In 2024, drought affected about 9.8 million people in Zambia, 7.6 million in Zimbabwe and 6.1 million in Malawi.
Rising losses also reflect growing exposure: more people and more valuable property in flood plains, on coasts and at the wildland-urban edge. Disentangling the climate signal from the exposure signal is an active area of research. The underlying physics is covered in how climate change science works.
The Inequity of Disaster Burden
The countries with the highest risk scores are, in many cases, those least able to absorb a disaster. In 2024, the Americas suffered most of the world's economic losses but a small share of its deaths, while Asia and Africa together accounted for about 80% of deaths. Earthquakes illustrate the gap most sharply. The January 2010 Haiti earthquake, with estimates of the death toll ranging widely, from well under 100,000 in some studies to the Haitian government's figure of about 316,000, struck a capital city with very little seismic construction. Earthquakes of comparable magnitude in well-prepared countries routinely kill far fewer people.
Preparedness pays. Bangladesh's cyclone shelters, Japan's building codes and the Philippines' improved evacuations all show that deaths can fall dramatically even when hazards do not. What remains is the protection gap: in 2025, about half of all disaster losses worldwide were uninsured, and that share is much higher in low-income countries, where a single flood or drought can wipe out years of household savings and public investment.
Frequently Asked Questions
Q: Which country has the most natural disasters? A: By recorded events in 2024, the United States, with 29 disasters in EM-DAT, followed by Indonesia (20), China and the Philippines (18 each) and India (15). By overall risk, which combines exposure and vulnerability, the WorldRiskIndex 2025 ranks the Philippines first, ahead of India and Indonesia.
Q: What is the deadliest natural disaster type? A: Over the 2004–2023 period, earthquakes caused the most deaths on average in EM-DAT's data, about 36,900 a year, driven by rare mass-casualty events. Storms, extreme temperatures and floods follow. Heat deaths are heavily undercounted, so their real share is probably larger.
Q: Which country has the best disaster preparedness? A: Japan is widely regarded as a global benchmark. It has the third-highest hazard exposure in the WorldRiskIndex 2025 but low vulnerability, thanks to strict seismic building codes, a national earthquake early warning system, regular public drills and strong emergency management. The Netherlands is a comparable benchmark for flood defence.
Q: Do richer countries experience less disaster mortality? A: Generally, yes. Wealthier countries can afford stronger buildings, warning systems, emergency services and insurance. In 2024, the Americas accounted for about 77% of global economic losses but only about 14% of deaths, while Asia accounted for about 59% of deaths but only 13% of losses.
Q: Why do the United States and China rank so high on event counts? A: Both are very large countries spanning many climate zones and hazard types, so they record many separate events. Their per-person risk is lower than their raw counts suggest, which is why they rank 21st and 9th respectively on the WorldRiskIndex 2025.
Q: How much do natural disasters cost each year? A: Munich Re estimated overall global losses at about US$224 billion in 2025, with about US$108 billion insured, against a 10-year average of US$266 billion. EM-DAT recorded about US$242 billion in economic losses in 2024.
The Bottom Line
There is no single list of "the countries with the most natural disasters", and anyone who offers one should say which measure they used. The United States, China, Indonesia, the Philippines and India record the most events. The Philippines, India and Indonesia carry the highest combined risk. The United States suffers by far the largest economic losses, while lower-income countries in Asia and Africa bear most of the deaths. Climate change is not creating disasters from nothing, but it is loading the dice for weather-related hazards. The evidence from Bangladesh and Japan is that the gap between hazard and catastrophe is something societies can narrow.
Sources
- CRED / EM-DAT, "2024 Disasters in Numbers" (2025): https://files.emdat.be/reports/2024_EMDAT_report.pdf
- CRED Crunch No. 78, Disaster Year in Review 2024 (May 2025): https://files.emdat.be/2025/05/CredCrunch78.pdf
- Bündnis Entwicklung Hilft / IFHV, WorldRiskReport 2025: https://www.welthungerhilfe.org/fileadmin/pictures/publications/en/studies_analysis/2025-worldriskreport-beh.pdf
- Munich Re, "Natural disaster figures 2025" (January 2026): https://munichre.com/en/company/media-relations/media-information-and-corporate-news/media-information/2026/natural-disaster-figures-2025.html
Related Reading
Follow new articles
Add SciHub101 to your feed reader to see new science and technology stories.
About the Author
SciHub101 is an independent science and technology publication founded and edited by Buğra Sözeri, a software engineer and app developer based in Türkiye. AI tools assist with drafting and research. Source documentation in the existing archive is uneven, and articles are being reviewed and corrected. The Editorial Team byline identifies editorial responsibility; it does not certify specialist or independent human review. Where we compare products, anything built by our own team is labelled as such — see the editorial guidelines and About page for how corrections and disclosures work.
Related Articles

Countries With the Most Oil Reserves in the World (2025)
Proven oil reserves are the foundation of petrostate power and the lifeblood of the global energy economy. This ranking reveals which countries hold the most oil underground — and why those reserves are simultaneously an enormous economic asset and a geopolitical liability in an era of energy transition.

Countries With the Most Forest Cover (2025)
Forests cover 4.14 billion hectares, about 32% of the world's land, per FAO's 2025 assessment. Russia, Brazil, Canada, the United States and China hold more than half. Ranked by area and by share of land, with what the numbers miss.
Countries With the Most Active Volcanoes (2025)
Which countries host the most active volcanoes depends on how you define active. This ranking compares the Smithsonian's Holocene counts with recent-eruption counts, and explains why the United States, Japan, Indonesia, Russia, and Chile keep swapping places.
What If AI Could Predict Every Natural Disaster?
Perfect earthquake warnings. Hurricane paths known weeks in advance. Volcanic eruptions predicted to the day. What would a world with perfect disaster prediction actually look like?
Countries With the Most Earthquakes (USGS Data, 2000-2024)
Indonesia, Japan, and Papua New Guinea lead USGS counts of magnitude 5+ earthquakes since 2000. This ranking shows the numbers, the plate tectonics behind them, the strongest and deadliest events, and why shaking frequency and death tolls rarely line up.
Countries That Produce the Most Food (Ranked, 2026 Update)
China leads almost every broad measure of food output, but the ranking changes with the metric. Here is who leads by value added, by staple crop tonnage, and by meat and milk, with sources and caveats.