Countries With the Most Earthquakes (USGS Data, 2000-2024)
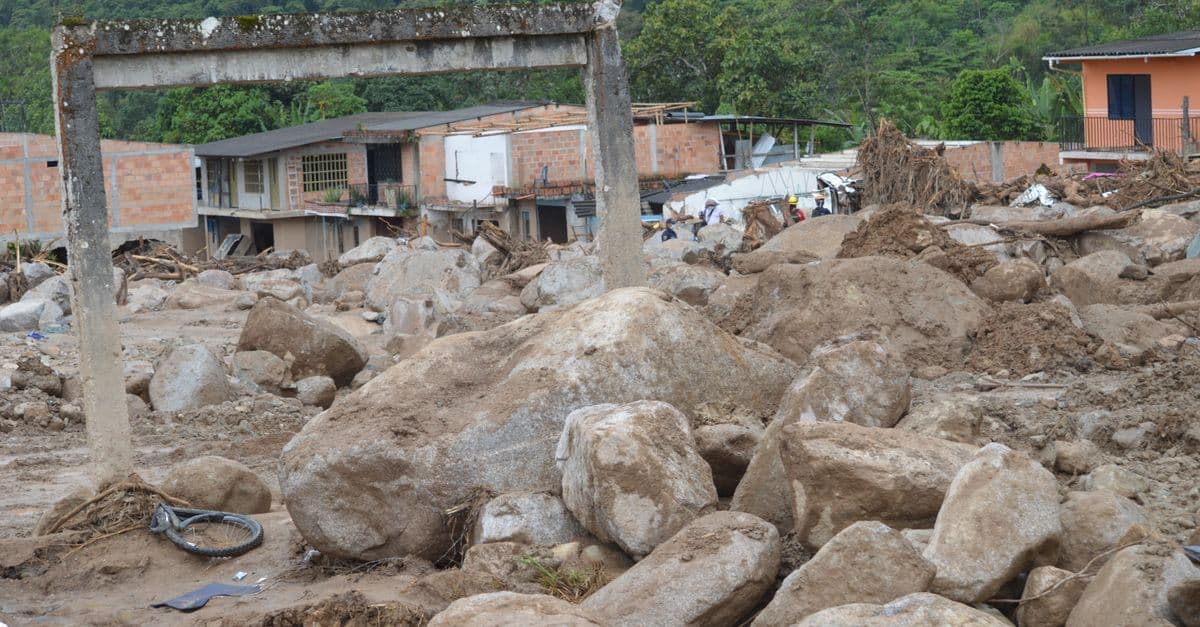
Photo: Franklin Peña Gutierrez / Pexels
Which countries have the most earthquakes? Counting every magnitude 5.0 or larger event in the US Geological Survey (USGS) catalog from 2000 through 2024, a rectangle around Indonesia holds about 5,900, more than Japan (about 3,500) or Papua New Guinea (about 2,800). Those numbers follow plate boundaries, not national borders, and they say little about danger: some of the deadliest earthquakes in recent decades struck places far down the frequency list. This ranking lays out the counts, explains the tectonics behind them, and separates how often the ground shakes from how much harm it does.
Key takeaways
- In USGS counts of magnitude 5.0+ earthquakes (2000 to 2024), the Indonesian region leads by a wide margin, followed by Japan, Papua New Guinea, Chile, Vanuatu, and the Philippines.
- Roughly 90 percent of the world's earthquakes occur along the Pacific Ring of Fire, which is why the top of the list is dominated by subduction-zone countries.
- The largest earthquake ever instrumentally recorded is the 1960 Valdivia, Chile, event, estimated at magnitude 9.4 to 9.6 (USGS lists 9.5).
- Death tolls track building quality, warning systems, and population exposure more than they track magnitude or frequency. The 2023 Turkey-Syria earthquakes killed more than 59,000 people, while the 1964 magnitude 9.2 Alaska earthquake killed 131.
- No reliable method exists for predicting when a specific earthquake will strike.
How many earthquakes does the world have?
The USGS earthquake catalog (called ComCat) lists 44,390 earthquakes of magnitude 5.0 or larger between January 1, 2000 and December 31, 2024. That is about 1,776 a year, or almost five a day. Of those, 3,730 reached magnitude 6.0, 371 reached magnitude 7.0, and 27 reached magnitude 8.0, which works out to roughly 149, 15, and one per year. Counts come from the USGS FDSN event web service, queried for this article in October 2026.
Those figures only make sense with a feel for the magnitude scale. Modern catalogs report moment magnitude (Mw), a scale tied to the seismic moment, a measure of how much rock slipped over how large a fault area. It replaced the older Richter-style scales for large events because those scales saturate. The surface-wave scale, for example, levels off around 8.0, which gave the 1960 Chilean earthquake a value of 8.5 even though its moment magnitude is far higher.
Each whole step on the moment magnitude scale corresponds to about 32 times more energy released. Two steps means about 1,000 times more. A magnitude 7.0 therefore releases roughly 1,000 times the energy of a magnitude 5.0, a fact that matters in a later section on why small earthquakes do not "let off steam."
The ranking: magnitude 5+ earthquakes by country, 2000 to 2024
Ranking countries by earthquake count sounds simple and is not. Borders do not follow faults, the USGS catalog does not tag events by country, and smaller earthquakes are recorded far more thoroughly where seismometer networks are dense, which would reward wealthy countries. To reduce that bias, this ranking counts only magnitude 5.0 and larger events.
To get a country-level number, I queried the USGS catalog using a latitude and longitude rectangle around each country. These boxes are approximate. They capture offshore events, which is where most subduction earthquakes occur, but they also pick up some neighboring territory. The Indonesia box includes Timor-Leste and part of Malaysian Borneo, the Chile box takes in the Argentine and Bolivian border, and the Turkey box includes part of the eastern Aegean. Read the table as "the region around the country" and do not add the rows together, because some boxes overlap.
| Rank | Region (rectangle around) | M5.0+ events, 2000-2024 | Approx. per year | M7.0+ events | Main tectonic setting |
|---|---|---|---|---|---|
| 1 | Indonesia | 5,881 | 235 | 57 | Subduction (Sunda arc) |
| 2 | Japan | 3,458 | 138 | 31 | Subduction |
| 3 | Papua New Guinea | 2,819 | 113 | 25 | Subduction, microplates |
| 4 | Chile | 2,044 | 82 | 15 | Subduction (Nazca plate) |
| 5 | Vanuatu | 1,462 | 58 | 21 | Subduction |
| 6 | Philippines | 1,397 | 56 | 13 | Subduction, strike-slip faults |
| 7 | Alaska (USA) | 1,092 | 44 | 13 | Subduction (Aleutian arc) |
| 8 | Mexico | 907 | 36 | 12 | Subduction |
| 9 | Peru | 877 | 35 | 18 | Subduction (Nazca plate) |
| 10 | Solomon Islands | 768 | 31 | 7 | Subduction |
| 11 | Iran | 427 | 17 | 3 | Continental collision |
| 12 | Taiwan | 369 | 15 | 3 | Collision and subduction |
| 13 | New Zealand | 355 | 14 | 4 | Subduction, Alpine Fault |
| 14 | Turkey | 251 | 10 | 4 | Strike-slip, collision |
| 15 | Nepal | 119 | 5 | 2 | Continental collision |
Source: USGS Earthquake Catalog (ComCat), FDSN event count service, events of magnitude 5.0 and above, January 1, 2000 to December 31, 2024. Each region is a latitude-longitude rectangle around the country, so counts include some offshore and cross-border events. Global total for the same period: 44,390 events of M5.0+. Tectonic settings are broad classifications consistent with the plate descriptions in the sources listed at the end.
Two things stand out. First, the top ten are almost all subduction zones, places where one tectonic plate dives beneath another. Second, several island arcs that rarely make headlines, Papua New Guinea, Vanuatu, and the Solomon Islands, outrank famous earthquake countries such as Mexico, Iran, and Turkey, mostly because few people live there to report on them. The list includes no row for China, because its irregular borders run up against some of the most active ground in Asia, including Myanmar, Taiwan, and Nepal, and a rectangle cannot separate them cleanly.
Where this data comes from and what it misses
The USGS catalog compiles data from seismometer networks run by national agencies and international consortia. It uses moment magnitude for large events, and magnitudes are sometimes revised after the fact. USGS upgraded the 2011 Tōhoku earthquake to Mw 9.1 in 2016, for instance, so a single event can appear in different sources with slightly different values.
Three limits are worth stating. The 25-year window includes unusually energetic sequences, such as the aftershocks of the 2004 Sumatra and 2011 Tōhoku earthquakes, which likely inflate Indonesia's and Japan's totals. Counts say nothing about hazard, which also depends on how often the largest earthquakes recur. And the box method is crude; a count built from true national boundaries could shift individual rows, especially for countries with long shared borders.
Why the Ring of Fire dominates the top of the list
The Ring of Fire is a belt of earthquakes and volcanoes surrounding most of the Pacific Ocean. It is about 40,000 km (25,000 miles) long and up to about 500 km (310 miles) wide, and it contains between 750 and 915 active or dormant volcanoes, roughly two-thirds of the world total depending on how the count is made. About 90 percent of the world's earthquakes, including most of the largest, occur within it. It formed through subduction involving the Antarctic, Nazca, Cocos, Pacific, Juan de Fuca, Philippine, and Australian plates.
What subduction does
Think of two conveyor belts of rock colliding. The denser oceanic plate slides beneath the lighter plate above it, but the contact between them is rough and sticks for decades or centuries. Stress builds like a stretched rubber band, and when the locked section finally slips, it can rupture hundreds of kilometers of fault in minutes. These boundary faults are called megathrusts, and they produce the largest earthquakes on Earth.
A second analogy helps with the volcano connection. A subducting plate is like a wet sponge being squeezed into a hot oven. The water driven out of it lowers the melting point of the mantle above, magma forms, and volcanoes appear in a chain behind the trench. That is why the same countries top both the earthquake and volcano rankings. For a companion list, see countries with the most active volcanoes, and for the mechanics of how rocks, heat, and pressure combine, see how volcanoes work.
Indonesia: the world's busiest seismic region
Indonesia sits along the Sunda Arc, a chain of volcanoes about 3,000 km long produced by the subduction of Indian Ocean crust beneath the Asian plate. The archipelago also meets other plates to the east, which is why a rectangle around it picks up so many events. The count of 5,881 magnitude 5+ earthquakes in 25 years is almost 235 a year.
Counting its volcanoes is a lesson in definitions. Published figures range from 76 volcanoes with historical eruptions to 141 entries in the Smithsonian Institution's database, with "around 130" often quoted for active ones. The number depends on what "active" means, a caution worth carrying to any ranking of volcanoes.
The 2004 Sumatra earthquake and tsunami
The most consequential event in the Indonesian record struck on December 26, 2004. The USGS puts it at Mw 9.1, though other estimates range up to 9.3. The rupture ran roughly 1,200 to 1,300 km (750 to 810 miles) along the plate boundary. The tsunami it generated killed about 227,898 people in 14 countries, which makes it one of the deadliest earthquakes on record.
The quake also nudged the planet. Models suggest it shortened the length of a day by about 2.68 microseconds, and Earth wobbled on its axis by roughly 25 millimeters. Those are tiny changes, but they show that a fault rupture can change how the whole planet spins.
Japan: counting a lot and surviving a lot
Japan ranks second with 3,458 magnitude 5+ events in the box and 31 of magnitude 7 or more. Part of that tally is the long aftershock sequence of the 2011 Tōhoku earthquake, which struck on March 11, 2011 at Mw 9.0 to 9.1. Official 2021 figures list 19,759 deaths and 2,553 missing. The tsunami reached a maximum run-up of 40.5 m (133 ft) at Miyako in Iwate Prefecture and knocked out power and cooling at the Fukushima Daiichi nuclear plant, causing meltdowns in three reactors.
Tōhoku was not the deadliest earthquake in Japanese history. The Great Kantō earthquake of September 1, 1923 killed about 105,385 people, with estimates running up to about 140,000. Fires caused roughly 90 percent of the deaths, spreading through wooden neighborhoods with help from a typhoon's winds. Japan designated September 1 as Disaster Prevention Day in 1960, and the nationwide drills held on that date are one of the best-known examples of institutional memory shaping public behavior.
The early warning system
Japan's public earthquake early warning service began on October 1, 2007. It works because radio and electrical signals outrun seismic waves. When the fast but gentle P-waves are detected by two or more of the country's 4,235 seismometers, the Japan Meteorological Agency estimates the epicenter and issues alerts for expected shaking of intensity 4 or higher on the Japanese seismic scale. During Tōhoku, the system issued alerts about a minute before the shaking reached Tokyo, and it is believed to have saved many lives. It does not help people near the epicenter, who may feel strong shaking before any warning arrives.
Warning is only one layer. Japanese building codes, drills, and coastal defenses carry much of the load, which is one reason a country with so many earthquakes can keep casualties relatively low in many of them.
Papua New Guinea, Vanuatu, and the Solomon Islands
Three Melanesian island groups together hold nearly as many magnitude 5+ events as Japan. Papua New Guinea alone has 2,819, 25 of them magnitude 7 or larger. The reason is structure rather than any single megaquake. The region sits where the Pacific and Australian plates meet a patchwork of smaller microplates, and subduction zones with different orientations lie close together.
These places rarely feature in rankings of earthquake disasters because the population exposed to the strongest shaking is smaller, buildings are often lightweight, and reporting is thinner. That is a reasoned observation from the data, not a measured finding. It does illustrate that the most active ground and the most dangerous ground are not the same thing.
The Americas: Chile, Peru, Alaska, and Mexico
The Peru-Chile Trench, where the Nazca Plate slides beneath South America, is the setting for the largest earthquake in instrumental history. The Valdivia earthquake struck on May 22, 1960. Most studies place it at Mw 9.4 to 9.6, and the USGS lists 9.5. It ruptured about 800 km (500 miles) of fault between 37°S and 44°S. Waves reached up to 25 m along the Chilean coast, and the tsunami crossed the Pacific, devastating Hilo, Hawaii, where waves reached 10.7 m (35 ft) and 61 people died. Death toll estimates for the event range from about 1,000 to 6,000.
Alaska's contribution is the 1964 Good Friday earthquake, which struck on March 27, 1964 and is the second largest on record at magnitude 9.2 to 9.3. Its death toll of 131 is low for such a large event, a gap usually attributed in part to the thin population of the affected coast. The Alaska box in the table shows 13 magnitude 7+ events in 25 years, more than four times as many as the Iran box.
Chile, Peru, and Mexico each have between 12 and 18 magnitude 7+ events in the same period, a reminder that rare megaquakes grow out of a steady background of large ones.
Collision zones: Turkey, Iran, and Nepal
Not every dangerous region is a subduction zone. Where two continents collide, neither plate can easily sink, so the crust crumples and cracks. The results are fewer earthquakes than in the Pacific, spread over huge land areas, and often more lethal because they strike inland cities directly.
Turkey
Turkey's box shows just 251 magnitude 5+ events in 25 years, about 10 a year, which ranks it 14th. Yet on February 6, 2023, two earthquakes of Mw 7.8 and Mw 7.7 hit within nine hours along the East Anatolian Fault, together with the Dead Sea Transform and the Sürgü-Çardak Fault. They killed 53,537 people in Turkey and an estimated 5,951 to 8,476 in Syria. At least 61,722 buildings in Turkey had to be demolished.
A New York Times investigation published in May 2023 found that inadequate design and safety lapses may have contributed to the collapse of the Rönesans Rezidans apartment block, which killed at least 269 people. Contractors said they followed regulations, a reminder that the rules themselves can fall short of what the ground demands.
Iran
Iran has about 17 magnitude 5+ events a year in its box, and a long record of deadly ones. The Bam earthquake of December 26, 2003 had a moment magnitude of 6.6, modest by global standards. Mud brick was the standard construction medium, and many structures did not meet the 1989 Iranian seismic code. Heavy roofs collapsed onto occupants. The death toll was revised from an early figure of 56,230 to 26,271 by the Statistical Center of Iran, although Iran's Crisis Management Organization later cited 34,000. The spread of those numbers is itself a data point, because counts of the dead after a disaster are often uncertain.
Nepal
Nepal's box counts only 119 magnitude 5+ events in 25 years, about five a year. The count is small, but the earthquakes behind it are rare and severe. India is converging with Eurasia at about 45 mm (1.8 inches) a year in central Nepal, the collision that built the Himalayas.
The Gorkha earthquake of April 25, 2015 (Mw 7.8 to 7.9) killed about 8,964 people across Nepal, India, China, and Bangladesh. Damage was estimated at about $10 billion, roughly half of Nepal's nominal gross domestic product (GDP) at the time. At least 19 people died in avalanches on Mount Everest, and the quake left an estimated 3.5 million people homeless.
The strongest earthquakes on record
Ranking earthquakes by magnitude is a different exercise than ranking countries by frequency. The Wikipedia list of largest earthquakes, which draws on the USGS and the research literature, gives ranges for many events because estimates differ.
| Rank | Date | Location | Magnitude (Mw) | Deaths (where listed) |
|---|---|---|---|---|
| 1 | May 22, 1960 | Valdivia, Chile | 9.4 to 9.6 | about 1,000 to 6,000 |
| 2 | March 27, 1964 | Prince William Sound, Alaska | 9.2 to 9.3 | 131 |
| 3 | December 26, 2004 | Sumatra, Indonesia | 9.2 to 9.3 (USGS 9.1) | 227,898 |
| 4 | March 11, 2011 | Tōhoku, Japan | 9.0 to 9.1 | 19,759 |
| 5 | November 4, 1952 | Kamchatka, USSR | 8.8 to 9.0 | 2,336 |
| 6 | February 27, 2010 | Maule, Chile | 8.8 | not listed |
| 7 | July 30, 2025 | Kamchatka, Russia | 8.8 | not listed |
| 8 | January 31, 1906 | Esmeraldas, Ecuador-Colombia | 8.5 to 8.8 | not listed |
| 9 | February 3, 1965 | Rat Islands, Alaska | 8.7 | not listed |
| 10 | August 15, 1950 | Assam, India-Tibet | 8.7 | 4,800 |
Source: Wikipedia, "List of largest earthquakes," with figures for individual events cross-checked against the event articles listed in the sources. Where authorities disagree, the range is shown. The 1952 death toll is attributed to the Severo-Kurilsk tsunami.
The two events at the top illustrate how large the range of outcomes can be. Valdivia and Alaska are close in size, yet one killed thousands and the other 131. For a longer treatment of record-setting events, see the strongest earthquakes ever recorded.
The deadliest earthquakes: a different ranking
If you order earthquakes by deaths instead of magnitude, the list looks very different.
| Event | Year | Magnitude | Highest listed deaths |
|---|---|---|---|
| Haiyuan, China | 1920 | 8.6 (Ms) | 273,407 |
| Sumatra and Indian Ocean tsunami | 2004 | 9.1 (USGS) | 227,898 |
| Gulang, China | 1927 | 7.9 (Ms) | 200,000 |
| Great Kantō, Japan | 1923 | about 8.0 (Mw) | 105,385 to about 143,000 |
| Ashgabat, Turkmenistan | 1948 | 7.2 (Mw) | 110,000 |
| Messina, Italy | 1908 | 7.2 (Ms) | 82,000 |
| Quetta, Pakistan | 1935 | 8.1 (Mw) | 60,000 |
| Turkey-Syria | 2023 | 7.8 and 7.7 (Mw) | 53,537 (Turkey) plus 5,951 to 8,476 (Syria) |
Source: Wikipedia, "List of deadly earthquakes since 1900" (which notes that death tolls "vary widely in quality and in many cases are estimates only"), and the event articles for 2004 and 2023. Rows are ordered by highest figure with the 2023 sequence placed by its combined toll.
Most of these events happened on land, near cities, with older construction. The pattern is consistent with the broader point of the next section: casualty counts follow exposure and buildings.
Frequency is not risk: why more earthquakes can mean fewer deaths
Seismologists separate hazard from risk. Seismic hazard is the probability that shaking above a given level will strike a place within a given time window. Seismic risk adds what is exposed to that shaking, such as buildings, infrastructure, and people. Building codes, land-use planning, and insurance all depend on risk, not on raw earthquake counts.
The table below compares five events to show how weakly magnitude predicts human loss.
| Event | Magnitude (Mw) | Deaths | What stands out |
|---|---|---|---|
| Alaska, 1964 | 9.2 to 9.3 | 131 | Huge quake, sparse population |
| Tōhoku, Japan, 2011 | 9.0 to 9.1 | 19,759 (plus 2,553 missing) | Strict building codes; deaths mostly from the tsunami |
| Bam, Iran, 2003 | 6.6 | 26,271 (official revision) | Moderate quake, mud-brick buildings |
| Gorkha, Nepal, 2015 | 7.8 to 7.9 | about 8,964 | Mountain terrain, landslides, vulnerable housing |
| Turkey-Syria, 2023 | 7.8 and 7.7 | 59,000+ | Two large shocks, widespread building collapse |
A countries-with-the-most-earthquakes ranking therefore answers one question, how often the ground moves, and leaves a second one open: what happens to the people when it does. The question of who suffers most from hazards in general is covered in countries most affected by natural disasters and in the deadliest natural disasters in history.
Preparedness works, with limits
Japan is the standard example of preparedness: drills, strict codes, dense monitoring, and early warning. Even so, Tōhoku showed the limits. Tsunami run-up reached 40.5 m, and the earthquake early warning system underestimated shaking intensity in some regions. Preparedness lowers the toll. It cannot erase it.
The comparison with Turkey is not a claim that one country is careless and another careful. Turkey also has building codes, and the 2023 investigation found that following the rules was not always enough. It is a reminder that enforcement, soil conditions, and the age of the building stock matter as much as the text of a regulation.
Can earthquakes be predicted?
The answer is no, not in the way people mean it. Forecasting estimates the probability of earthquake hazard over long periods, such as decades. Prediction would specify the time, place, and size of a future earthquake within stated limits. After decades of research, no reliable method of short-term prediction has been found, and many scientists doubt it is possible.
The best-known test was at Parkfield, California. Based on a regular pattern of magnitude 6 earthquakes, scientists predicted one around 1988, or by 1993 at the latest. It did not arrive until September 28, 2004, and it came without a warning signal. Many scientists still considered the monitoring experiment a success because of the data it produced.
Prediction can also go wrong in the other direction. After the 2009 L'Aquila earthquake, which killed about 300 people, seven scientists and technicians were convicted of manslaughter. The conviction was less about failing to predict the quake than about giving the public undue assurance that a serious earthquake would not occur.
Earthquakes do cluster in space and time. In southern California, about 6 percent of magnitude 3.0+ quakes are followed by a larger one within five days and 10 km. A system that warned after every such quake would produce ten to twenty false alarms for each correct one. Machine learning is being tried on seismic data, and readers curious about where that research stands can start with AI in seismology. For the underlying mechanics of faults and waves, see how earthquakes work and, for the instrument that made them measurable, the seismograph.
Common confusions about earthquake rankings
Myth: Small earthquakes release the pressure and prevent big ones. The energy arithmetic says otherwise. Because each magnitude step carries about 32 times more energy, releasing the energy of one magnitude 7 earthquake would take about 1,000 magnitude 5 events. The whole planet averages about 1,776 magnitude 5+ earthquakes a year, spread across every fault on Earth, so no single fault can bleed off stress that way.
Myth: The Richter scale is what is used today. Seismologists now report moment magnitude, which does not saturate for the largest events. Many news stories still say "Richter" out of habit.
Myth: The country with the most earthquakes has the most deaths. The tables above show otherwise. Indonesia leads in frequency and was the site of the 2004 disaster, but Iran, Turkey, and Nepal have suffered disproportionate losses from far fewer events.
Myth: Counts of "earthquakes per year" are exact. They depend on the magnitude threshold, the detection network, and where the border is drawn. Any ranking, including this one, should be read with its method in mind.
Frequently asked questions
Q: Which country has the most earthquakes per year? A: In USGS catalog counts of magnitude 5.0+ events from 2000 to 2024, the region around Indonesia leads with 5,881 events, about 235 a year. Japan follows with 3,458 and Papua New Guinea with 2,819. These counts use latitude-longitude rectangles around each country, so they include some offshore and neighboring events.
Q: What is the Ring of Fire? A: It is a belt of earthquakes and volcanoes surrounding most of the Pacific Ocean, about 40,000 km (25,000 miles) long. It holds roughly 750 to 915 active or dormant volcanoes and accounts for about 90 percent of the world's earthquakes, including most of the largest. It forms where plates such as the Pacific, Nazca, and Philippine plates subduct beneath others.
Q: What is the most powerful earthquake ever recorded? A: The May 22, 1960 earthquake near Valdivia, Chile, with a moment magnitude estimated at 9.4 to 9.6. The USGS lists it as 9.5. It ruptured about 800 km (500 miles) of fault and generated a tsunami that killed people as far away as Hawaii and Japan.
Q: Why does Japan have so many earthquakes? A: Japan lies on the Ring of Fire, where oceanic plates subduct beneath the plates carrying the Japanese islands. The USGS catalog shows 3,458 earthquakes of magnitude 5+ and 31 of magnitude 7+ in a rectangle around Japan between 2000 and 2024, including the long aftershock sequence of the 2011 Tōhoku earthquake.
Q: Why did Turkey's 2023 earthquakes kill so many people if Turkey has fewer earthquakes than Japan? A: Frequency is not risk. Two shocks of magnitude 7.8 and 7.7 struck densely populated areas on February 6, 2023, killing 53,537 people in Turkey and an estimated 5,951 to 8,476 in Syria. At least 61,722 buildings in Turkey had to be demolished, and investigations pointed to design and safety lapses in some collapsed buildings.
Q: Can earthquakes be predicted? A: No reliable method exists for short-term prediction of a specific earthquake's time, place, and size. Scientists can estimate long-term probabilities for fault zones, which is called forecasting. The Parkfield, California experiment predicted a quake around 1988 and it arrived in 2004, which shows how hard timing is.
Q: How much more energy does a magnitude 8 release than a magnitude 7? A: About 32 times more. Each whole step on the moment magnitude scale corresponds to roughly 10 to the power of 1.5 times the energy. Two steps, such as magnitude 7 to magnitude 9, mean about 1,000 times more energy.
The bottom line
Where earthquakes happen is a matter of plate boundaries, and the data show a clear order: the subduction zones of the western and eastern Pacific produce most of the large earthquakes, with Indonesia far in front. What happens to people afterward is a matter of choices. The same magnitude can kill 131 people or tens of thousands depending on where the buildings are, how they were built, and how much warning there is. Rankings of countries by earthquake count are useful for understanding the planet, and they are a poor guide to how much any one place has to fear.
Sources
- USGS Earthquake Catalog, FDSN event count service
- Wikipedia, List of largest earthquakes
- Wikipedia, List of deadly earthquakes since 1900
- Wikipedia, Ring of Fire
- Wikipedia, Moment magnitude scale
- Wikipedia, 2023 Turkey-Syria earthquakes
- Wikipedia, 2011 Tōhoku earthquake and tsunami
- Wikipedia, 2004 Indian Ocean earthquake and tsunami
- Wikipedia, 1960 Valdivia earthquake
- Wikipedia, April 2015 Nepal earthquake
- Wikipedia, 2003 Bam earthquake
- Wikipedia, 1923 Great Kantō earthquake
- Wikipedia, Earthquake early warning (Japan)
- Wikipedia, Earthquake prediction
- Wikipedia, Seismic hazard
Related Reading
Follow new articles
Add SciHub101 to your feed reader to see new science and technology stories.
About the Author
SciHub101 is an independent science and technology publication founded and edited by Buğra Sözeri, a software engineer and app developer based in Türkiye. AI tools assist with drafting and research. Source documentation in the existing archive is uneven, and articles are being reviewed and corrected. The Editorial Team byline identifies editorial responsibility; it does not certify specialist or independent human review. Where we compare products, anything built by our own team is labelled as such — see the editorial guidelines and About page for how corrections and disclosures work.
Related Articles

Countries With the Most Nobel Prize Winners (All Time)
Which countries have produced the most Nobel laureates? Counts from the Nobel Prize's own database, by birth country and by institutional affiliation, 1901 to the 2026 announcements.

Countries Contributing Most to Scientific Research (2025)
China has overtaken the United States as the world's top producer of scientific publications, but volume tells only part of the story. This ranking examines publication counts, citation impact, and research investment to reveal where science is really advancing fastest.
How Earthquakes Work — Plate Tectonics Explained
How shifting tectonic plates cause earthquakes, why we measure them with moment magnitude, and why prediction is still impossible.
Countries With the Most Active Volcanoes (2025)
Which countries host the most active volcanoes depends on how you define active. This ranking compares the Smithsonian's Holocene counts with recent-eruption counts, and explains why the United States, Japan, Indonesia, Russia, and Chile keep swapping places.
Plate Tectonics Explained — How and Why Earth's Crust Moves
Plate tectonics explained: how Earth's rigid plates move, what drives them, what happens at their boundaries, and the evidence that settled the debate.
The Strongest Earthquakes Ever Recorded: The Day Chile Shortened the Day
On 22 May 1960, the ground beneath southern Chile ruptured along a 1,000-kilometre fault, releasing a magnitude 9.5 earthquake — the most powerful ever recorded by instruments. It was so violent it shifted Earth's mass enough to measurably change the length of a day and set the entire planet ringing like a bell for weeks. Because the magnitude scale is logarithmic, this single quake released more energy than every other recorded earthquake of the 20th century combined.