How Earthquakes Work — Plate Tectonics Explained
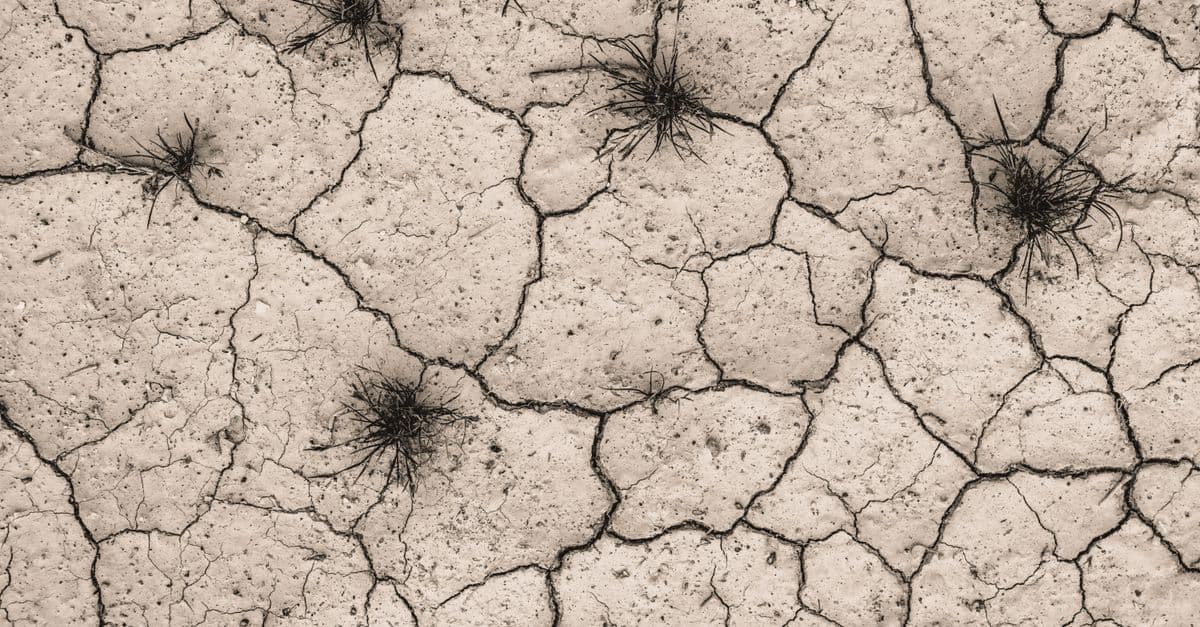
Photo: Johannes Plenio / Pexels
Every year, the planet beneath your feet ruptures roughly 500,000 times in events strong enough to be detected by seismographs. About 100,000 of those are felt by humans, and around 100 cause significant damage. Earthquakes are not random — they are the inevitable consequence of a slowly churning planet whose rigid skin is broken into puzzle pieces grinding against one another. To understand earthquakes, you have to understand the theory that almost no one believed for half a century.
Plate Tectonics: The Theory That Changed Geology
In 1915, German meteorologist Alfred Wegener proposed that the continents had once been joined and had since "drifted" apart, like ice floes on a frozen sea. He pointed to matching coastlines (South America and Africa), identical fossils on opposite continents, and matching rock formations. The geological establishment ridiculed him; no one could explain how continents could plow through solid ocean floor.
The vindication came in the 1960s. Studies of the seafloor revealed:
- Mid-ocean ridges — vast underwater mountain ranges where new crust is born.
- Magnetic striping — symmetric bands of reversed magnetic polarity on either side of ridges, recording new crust emerging and spreading outward.
- Subduction zones — deep ocean trenches where old crust dives back into the mantle.
Wegener was right in spirit. Continents don't plow through ocean floor — the entire lithosphere (the rigid outer shell, ~100 km thick) is broken into about 15 major plates that move at 1–10 cm per year, riding on the slowly flowing mantle below. Earthquakes happen at the boundaries between these plates, where stress builds and is suddenly released.
Fault Types: Three Ways Rock Can Break
Where plates meet, the geometry of motion creates three main fault types:
- Transform faults — Plates slide horizontally past one another. Classic example: the San Andreas Fault in California, where the Pacific Plate grinds northwest past the North American Plate.
- Normal faults — Plates pull apart; one block drops down relative to the other. Common in rift zones like East Africa and Iceland.
- Reverse / thrust faults — Plates collide; one block is pushed up and over the other. Responsible for the world's biggest earthquakes, including the Himalayan thrusts and the megathrust subduction zones of Japan, Chile, and the Pacific Northwest.
Elastic Rebound: Why the Ground Suddenly Snaps
Stuck plates don't slide smoothly — friction locks them in place while the rocks behind keep moving. Stress builds for decades or centuries, deforming the crust elastically like a bent ruler. Eventually the stress exceeds the rock's strength and the fault ruptures, releasing the stored energy as seismic waves and snapping the rocks back into their unstressed shape. This is elastic rebound theory, proposed by Henry Fielding Reid after the 1906 San Francisco quake.
Seismic Waves: How the Energy Travels
A rupture sends out several types of waves, each with its own speed and signature:
- P-waves (Primary): Compressional. Travel fastest (~6 km/s in crust). They push and pull rock back and forth along the direction of travel. They arrive first and are felt as a sharp jolt.
- S-waves (Secondary): Shear. Slower (~3.5 km/s). They oscillate perpendicular to travel direction and cannot pass through liquids — which is how we know Earth's outer core is liquid.
- Surface waves: Slowest but most destructive. Two types — Love waves (side-to-side horizontal motion) and Rayleigh waves (rolling, ocean-wave-like motion) — concentrate energy near the surface and cause most building damage.
The time difference between the P-wave arrival and the S-wave arrival at a seismograph tells you how far away the earthquake was. Three or more stations and you can triangulate the epicenter.
Magnitude: Richter, Moment, and What They Actually Mean
Charles Richter's 1935 scale was the first widely used measure of earthquake size, but it saturates above magnitude ~7 and was calibrated for Southern California. Modern seismology uses moment magnitude (Mw), based on the actual physical work done — fault area times slip distance times rock rigidity. It's logarithmic: each whole number is ~32× more energy released.
- Mw 5 → small house damage, broken windows.
- Mw 6 → severe damage to poorly built structures.
- Mw 7 → major regional disaster.
- Mw 8 → "great" earthquake, devastating.
- Mw 9+ → planetary-scale event; can shift Earth's axis measurably.
Magnitude measures size at the source. Intensity measures shaking at a location. The Modified Mercalli Intensity scale (I–XII) rates effects: I is unnoticed, V wakes sleepers, X destroys most masonry, XII is total destruction. A magnitude 7 quake might cause Mercalli IX shaking directly above but only IV a few hundred kilometers away.
The Biggest Earthquakes on Record
| Earthquake | Year | Magnitude (Mw) | Fault Type | Notes |
|---|---|---|---|---|
| Valdivia, Chile | 1960 | 9.5 | Megathrust | Largest ever recorded; tsunami crossed Pacific |
| Great Alaska | 1964 | 9.2 | Megathrust | 4-minute rupture; tsunamis as far as California |
| Sumatra-Andaman | 2004 | 9.1 | Megathrust | Indian Ocean tsunami, ~230,000 deaths |
| Tōhoku, Japan | 2011 | 9.1 | Megathrust | Tsunami, Fukushima nuclear disaster |
| Kamchatka | 1952 | 9.0 | Megathrust | Major Pacific tsunami |
| Kahramanmaraş, Turkey | 2023 | 7.8 | Strike-slip | ~60,000 deaths; East Anatolian Fault |
| Haiti | 2010 | 7.0 | Strike-slip | ~160,000 deaths; weak buildings |
Notice the pattern: the largest events are all subduction zone megathrusts, where a slab of oceanic plate slides under a continental plate over hundreds of kilometers of locked surface.
Why We Can't Predict Earthquakes (Yet)
Despite enormous effort, no one has reliably predicted the time, place, and magnitude of a specific earthquake. The fundamental problem: fault systems are nonlinear, faults are buried, and the difference between "stressed but stable" and "about to rupture" can come down to microscopic conditions we cannot measure remotely.
What seismologists can do is probabilistic forecasting — statements like "there's a 72% chance of a magnitude 6.7+ in the San Francisco Bay Area in the next 30 years." Useful for building codes, useless for evacuation.
Early Warning: Buying Seconds That Save Lives
What we can do: detect an earthquake the instant it starts and warn nearby areas before the slower, destructive S-waves arrive. P-waves outrun S-waves, and electronic signals outrun both. Modern systems give 5–60 seconds of warning:
- Japan's J-Alert sends warnings to phones, trains, and factories. Bullet trains automatically brake. Surgeons pause operations.
- USGS ShakeAlert covers California, Oregon, and Washington.
- Mexico's SASMEX has been operational since 1991.
A few seconds doesn't sound like much, but it's enough to drop, cover, hold on, stop a train, halt an elevator, or shut down a gas line. For more on Earth's place in a dynamic cosmos, see our piece on the Earth's axial tilt and seasons and planetary science of exoplanets.
Tsunami Generation and Ocean Wave Propagation
The deadliest part of great earthquakes is often not the shaking, but the tsunami it generates. Tsunamis are triggered when underwater fault ruptures displace the seafloor suddenly, pushing or pulling the water column above.
How they form:
A megathrust earthquake ruptures 100+ km of locked interface between plates. The overlying plate snaps upward (or, in subduction zones, the subducting slab jerks down). This vertical motion displaces an enormous volume of water — like pushing the entire ocean up. The water sloshes outward as waves.
Key differences from normal waves:
- Speed: Tsunami waves travel ~700 km/hr in deep ocean (as fast as a jet).
- Wavelength: 100-200 km — far longer than normal waves (typically 100-200 m).
- Height in deep ocean: Only 0.5-1 m — nearly invisible to ships at sea.
- Height near shore: As the wave reaches shallow water, it slows, bunches up, and can reach 30 m (100 ft) or more.
The 2004 Indian Ocean Tsunami:
The Sumatra-Andaman megathrust (Mw 9.1) ruptured ~1,600 km of fault. The seafloor heaved up meters vertically. Within hours, tsunami waves crossed the Indian Ocean. In Sri Lanka and Indonesia, waves reached 10-30 m height. Total deaths: ~230,000. Almost all from drowning or impact, not shaking.
Tsunami Early Warning Systems:
After the 2004 disaster, countries installed seismic networks and ocean-based pressure sensors to detect tsunamis in real-time. The Pacific Tsunami Warning Center can issue alerts within minutes of an earthquake. This has reduced deaths significantly — the 2011 Tōhoku tsunami killed ~20,000 in Japan despite being one of the largest waves ever recorded, because warnings and seawalls saved hundreds of thousands.
Earthquake Forecasting vs. Prediction
There's an important distinction:
Prediction: "An earthquake will hit San Francisco on March 15 at 2:00 PM." Scientific consensus: impossible with current knowledge. Fault stress, rock properties, fluid pressures are too poorly understood remotely.
Forecasting: "There's a 72% probability of a magnitude 6.7+ in the San Francisco Bay Area in the next 30 years." This is achievable using historical earthquake rates, fault geometry, and stress accumulation models. It's used for building codes and insurance pricing, but useless for evacuation (you can't ask people to evacuate for 30 years).
Why prediction fails:
- Faults are buried and inaccessible; we can't measure stress at depth remotely.
- The last few meters of slip before rupture are controlled by microscopic friction changes.
- Stress transfer from neighboring faults creates complex interactions.
- Earthquakes are chaotic; small perturbations can trigger or inhibit rupture.
The best analogy: we can forecast the probability of rain over a season, but predicting a specific raindrop is nonsensical.
The San Andreas Fault and California's Seismic Risk
The San Andreas Fault is a ~1,300 km transform fault running through California. The Pacific Plate (west) slides northwest past the North American Plate (east) at ~5-6 cm/year. This motion is relentless and locked by friction most of the time — building stress.
Famous ruptures:
- 1906 San Francisco: Mw 7.9, ruptured ~500 km of the fault. Killed ~700 people. Generated the 1- to 2-meter offset still visible today.
- 1857 Fort Tejon: Mw 7.9, ruptured the southern San Andreas. No major cities in rupture zone at the time, but would kill hundreds of thousands today.
Current stress: Stress has accumulated since 1906 (120 years). If locked patches release suddenly, a Mw 7.5-7.9 is plausible. The USGS estimates 26% probability of a Mw 6.7+ in Southern California in the next 30 years.
Mitigation: Strict building codes (earthquakes don't kill people, collapsed buildings do). Seismic retrofitting of older structures. Emergency preparedness planning.
Plate Boundaries: The Earthquake Hotspots
The vast majority of earthquakes (90%+) occur at plate boundaries.
Subduction zones (most deadly):
- Japan, Indonesia, Chile, Pacific Northwest USA.
- Mw 8.5+ events are almost exclusively here.
- Characterized by great ruptures over 100+ years of locked behavior.
Transform faults (more frequent, smaller average size):
- San Andreas (California), North Anatolian (Turkey), Alpine (New Zealand).
- Smaller average magnitude but higher frequency (stress releases incrementally or via small earthquakes).
Mid-ocean ridges (weak, deep, rarely damaging):
- Divergent boundaries where plates pull apart; produce mostly magma, not large quakes.
- 2016 Kaikoura earthquake (New Zealand) at transpression zone was unusually large for non-subduction.
Intraplate (unexpected, rare):
- Earthquakes within plates, away from boundaries. Usually small, but occasionally Mw 6-7 occurs.
- 1811-1812 New Madrid earthquakes (central USA) were Mw ~8, killing dozens; aftershocks lasted years.
Understanding plate boundaries helps you assess earthquake risk. If you live in Los Angeles (San Andreas), Tokyo (subduction), or Istanbul (North Anatolian), earthquake preparedness is essential.
Seismic Waves and Earthquake Magnitude Scales — A Detailed Look
Different types of seismic waves carry different information and propagate at different speeds. Understanding these is critical to how seismologists locate and measure earthquakes.
Body Waves vs Surface Waves
Body waves travel through Earth's interior and arrive first. They're divided into two types:
P-waves (Primary): Compressional waves that push and pull material along their direction of travel. Think of a coiled spring being compressed and released. P-waves travel ~6-7 km/s in the crust, faster in the mantle and core. They pass through both solids and liquids.
S-waves (Secondary): Shear waves that move perpendicular to their direction of travel. Think of a rope being whipped up and down. S-waves travel ~3.5-4 km/s in the crust, about 60% the speed of P-waves. Critically, S-waves cannot travel through liquids — they require a solid matrix to shear. This is how seismologists discovered Earth's liquid outer core.
Surface waves arrive last but carry the most energy and cause the most damage:
Love waves: Move side-to-side horizontally along Earth's surface. Confined to shallow depths, they have large amplitudes and long wavelengths.
Rayleigh waves: Move in a rolling, elliptical motion (like an ocean wave). Slower than Love waves but often have larger amplitude.
The P-S time difference is crucial for locating earthquakes. If a seismograph records a P-wave at 12:00:00 and the S-wave at 12:00:20 (20 seconds later), and the P-S velocity ratio is known, the distance to the epicenter can be calculated: ~200 km in this case. Triangulating from three or more stations pinpoints the exact epicenter.
The Richter Scale vs Moment Magnitude
Richter scale (local magnitude, ML): Developed by Charles Richter in 1935 in Southern California, it measures the amplitude of seismic waves recorded on a Wood-Anderson seismograph. The scale is logarithmic: each integer increase represents ~30× more wave amplitude (or ~10× more energy).
Problem with Richter: It saturates above magnitude ~6.5-7.0. For very large earthquakes, the measured amplitude doesn't increase proportionally. For the 1960 Valdivia earthquake (Mw 9.5), the Richter scale would have rated it Mw ~7.5, massively underestimating the actual energy released. Also, Richter was calibrated for Southern California; it performs poorly elsewhere.
Moment magnitude (Mw): Developed in the 1970s by Kanamori and others, it's based on the moment of an earthquake — the physical work done:
Moment = μ × A × d
Where:
- μ (mu) = rigidity of rock (typically ~3 × 10¹¹ Pa)
- A = area of fault that ruptured
- d = average amount of slip (how far rock moved)
Moment magnitude doesn't saturate. A Mw 9.5 earthquake has genuinely different (and vastly greater) energy than a Mw 7.5. Modern seismology uses moment magnitude for all events.
Energy released scales logarithmically: each unit of Mw represents ~32× more energy. The 2011 Tōhoku earthquake (Mw 9.1) released roughly 1,000× the energy of the 2011 Christchurch earthquake (Mw 6.3), even though they occurred in the same year.
Source: Kanamori, H. (1977). "The energy release in great earthquakes." Journal of Geophysical Research, 82(20): 2981–2987.
Earthquake Hazard Zones and Global Risk
Not all of Earth's surface is equally seismic. Mapping hazard zones helps identify where large earthquakes are most likely.
Global Earthquake Belts
The Ring of Fire (circum-Pacific seismic belt) accounts for ~90% of Earth's seismic energy. It includes:
- Japanese subduction zones
- Philippines subduction
- New Zealand Alpine Fault
- Andes (Peru/Chile subduction)
- Central American subduction
- Cascadia subduction zone (Pacific Northwest USA)
- Aleutian subduction
The Ring of Fire is where oceanic plates collide with continental plates or with each other, creating powerful megathrust ruptures.
The Mediterranean-Himalayan Belt extends from Mediterranean (North Anatolian Fault, Greek subduction) eastward through the Middle East (Dead Sea transform) into the Himalayas (India-Asia collision). This belt generates frequent Mw 6-7.5 earthquakes but rarely exceeds Mw 8 because the involved plates are continental (weaker, more fragmented ruptures).
Seismic Hazard Maps
The USGS produces probabilistic seismic hazard maps showing the probability of ground shaking exceeding a certain level in a given timeframe. These maps drive building code requirements. California's code is stricter than Nebraska's because California sits atop active faults. The USGS update (2023) increased forecasted hazard in some regions, particularly for the Hayward Fault in the Bay Area (Mw 7.0+ in next 30 years now estimated at 18%, up from 12%).
Earthquake Engineering and Mitigation
The phrase "earthquakes don't kill people; buildings do" encapsulates the most important lesson: good design saves lives.
Structural Seismic Design Principles
Base isolation: Place the building on friction-sliding pads or elastomeric bearings. The foundation moves with the earthquake, but the building structure above remains relatively still. Used in major buildings in Tokyo, San Francisco, and elsewhere.
Shear walls and bracing: Diagonal bracing or vertical walls that absorb horizontal (shear) forces. Traditional moment-resisting frames can crack; braced frames stay rigid.
Damping: Dissipate earthquake energy via mechanical dampers (tuned mass dampers), fluid dampers (viscous dampers), or shape-memory alloys that absorb and release energy.
Flexible connections: Ductile connections that bend without breaking, so the structure absorbs energy through deformation rather than sudden fracture.
Redundancy: Multiple load paths. If one element fails, others carry the load. A single point of failure is catastrophic.
Non-Structural Seismic Safety
Even with perfect structural design, non-structural hazards kill people:
- Falling ceilings, fixtures, and equipment
- Gas line ruptures causing fires
- Elevator failure
- Unreinforced masonry partitions
Modern building codes require securing heavy equipment (HVAC, water tanks) and designing ceilings to stay attached during strong shaking.
Retrofit and Vulnerability Assessment
Many older buildings (pre-1980) were designed before modern seismic codes. Seismic retrofitting can include:
- Adding shear walls
- Reinforcing foundations
- Securing connections
- Damper installation
Cost-benefit analyses show retrofitting reduces earthquake deaths per dollar far more effectively than other disaster-mitigation investments.
Frequently Asked Questions
Q: What's the difference between magnitude and intensity?
A: Magnitude (Mw) is the energy released — a single number per earthquake, measured instrumentally. Intensity (Modified Mercalli) is the shaking felt at a location — varies by distance, soil type, and building construction. A Mw 6.0 earthquake produces different intensities in Tokyo vs. rural mountains.
Q: Can human activity like fracking or dams trigger earthquakes?
A: Yes. Injection of wastewater (oil drilling, geothermal), impoundment of large reservoirs, and hydraulic fracturing can all trigger earthquakes by altering subsurface pore pressure. Oklahoma's earthquake rate increased 900× in the 2010s due to injection wells. Most are small (Mw <4), but larger events (Mw 5-6) have occurred.
Q: Why do some countries experience fewer earthquake deaths despite frequent, large quakes?
A: Building codes are everything. Japan has strict seismic building standards, redundant structural systems, and frequent enforcement inspections. A Mw 7.0 in Japan kills dozens; the same magnitude in a developing country with poor building standards kills thousands. The earthquake doesn't discriminate; the buildings do.
Q: Can a giant earthquake actually change Earth's spin or tilt?
A: Yes, measurably. The 2011 Tōhoku earthquake (Mw 9.1) redistributed Earth's mass, shortening the day by ~1.8 microseconds and shifting the rotation axis by ~17 cm. Large magnitude quakes trigger detectable changes in Earth's moment of inertia, observed via satellite geodesy.
Q: What's an aftershock, and how long can they continue?
A: An aftershock is a smaller earthquake following the mainshock as the crust adjusts to new stress. They can continue for weeks to years. Occasionally an "aftershock" becomes larger than the previous mainshock and gets reclassified as the true mainshock with a foreshock. The sequence is defined by energy, not timing.
Q: Can animals predict earthquakes before they happen?
A: Anecdotal reports abound (dogs barking, birds fleeing), but rigorous scientific studies show no reliable pre-earthquake animal behavior. Some animals may detect P-waves (arriving seconds before S-waves), which humans feel as a sharp jolt. But consistent, predictable pre-earthquake animal signals have not been established despite decades of research.
Read next:
Follow new articles
Add SciHub101 to your feed reader to see new science and technology stories.
About the Author
SciHub101 is an independent science and technology publication founded and edited by Buğra Sözeri, a software engineer and app developer based in Türkiye. AI tools assist with drafting and research. Source documentation in the existing archive is uneven, and articles are being reviewed and corrected. The Editorial Team byline identifies editorial responsibility; it does not certify specialist or independent human review. Where we compare products, anything built by our own team is labelled as such — see the editorial guidelines and About page for how corrections and disclosures work.
Related Articles

How LED Lights Work — Science of Solid State Light
How LEDs turn electricity into light using semiconductors, why they're 10x more efficient than bulbs, and the Nobel-winning blue LED story.

Game Theory Explained — Math of Strategic Decisions
Game theory explained: Nash equilibrium, Prisoner's Dilemma, evolutionary games, auctions, and real-world applications from biology to AI.
Plate Tectonics Explained — How and Why Earth's Crust Moves
Plate tectonics explained: how Earth's rigid plates move, what drives them, what happens at their boundaries, and the evidence that settled the debate.

How Scientists Know What Is Inside Earth
No one has drilled to Earth's core. Scientists infer the interior from seismic waves, density, magnetism, meteorites, and high-pressure experiments.
How Volcanoes Work — Magma to Eruption
Where magma comes from, why volcanoes form at plate boundaries and hotspots, eruption types, the VEI scale, and how scientists monitor them.