Countries That Produce the Most Food (Ranked, 2026 Update)
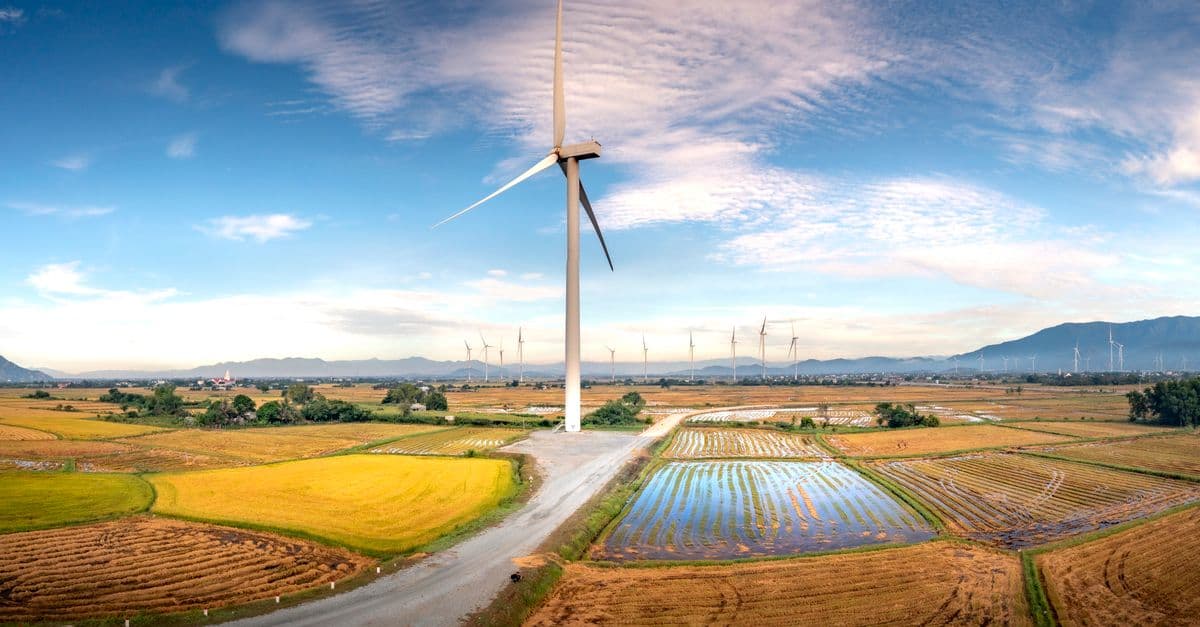
Photo: Quang Nguyen Vinh / Pexels
China grows more food than any other country, whether you count the money it earns or the tonnes it harvests. But the gap between first place and everyone else depends heavily on what you measure. In 2022, agriculture added about $1.31 trillion to China's economy, more than twice India's $592 billion. By weight, India out-produces China in rice and milk, the United States leads in maize, and Brazil leads in soybeans and sugar cane. This ranking lays out each yardstick, the sources behind it, and what the numbers can and cannot tell you.
Key Takeaways
- China leads by agricultural value added ($1.31 trillion in 2022, World Bank), by cereal tonnage (651 million tonnes in 2024, FAO), and by meat (about 98 million tonnes).
- India leads the world in rice (about 218 million tonnes of paddy rice) and milk (about 248 million tonnes), and ranks second in wheat.
- The United States is the largest maize producer (about 378 million tonnes) and the second largest soybean producer, and it exports roughly $170 billion of farm goods a year.
- Brazil harvests about 144 million tonnes of soybeans and about 760 million tonnes of sugar cane, both world-leading figures.
- Output is not the same as access: the FAO estimates 645 million people faced hunger in 2025, and the biggest producers are not automatically the best fed.
What "producing the most food" actually measures
There is no single official ranking of food production, because "food" bundles together things that cannot be added without a convention. A tonne of sugar cane (mostly water and fiber) is not nutritionally comparable to a tonne of soybeans, and a liter of milk is a different product from a kilogram of wheat. Statisticians solve the problem in a few different ways, and each produces a different leaderboard.
The first is value added, which is what the World Bank publishes for every country. Value added is the value of what farms, forests, and fisheries produce minus the cost of the inputs bought from other sectors, such as seed, feed, fertilizer, and fuel. It is the agricultural share of gross domestic product, expressed in current US dollars. The second is physical output in tonnes, which the FAO collects crop by crop and which is easy to compare within a single commodity. The third is calories or nutrients, which allows cross-crop comparison but depends on assumptions about waste, feed use, and what people actually eat.
Think of it like comparing the size of two libraries. You can count the books (tonnes), count the value of the collection (dollars), or count the pages (calories). A library of pamphlets and a library of encyclopedias rank differently depending on which count you pick, and none of the counts is wrong.
| Metric | What it counts | Main blind spot |
|---|---|---|
| Value added (World Bank) | Farm, forestry, and fishing output minus purchased inputs, in current US dollars | Swings with exchange rates and prices; includes forestry, not only food |
| Tonnes by commodity (FAO) | Physical harvest of each crop or animal product | Cannot be added across crops; paddy rice and sugar cane weigh very differently from grain |
| Gross production value (FAO) | Output valued at farm-gate prices | Counts crops that are later fed or sown on the same farm as output, so inputs are not netted out |
| Calories per person | Energy available from domestic output | Hides feed and biofuel use, waste, and trade |
This article uses the first two measures, because both can be traced to public datasets. Where a figure comes from a specific year, the year is stated, since farm statistics are revised as national agencies finish their surveys.
The top 15 countries by agricultural value added
The World Bank's indicator "Agriculture, forestry, and fishing, value added (current US$)" is the most widely used cross-country comparison. The table below uses 2022, the most recent year for which nearly every large country has a published figure. The United States is a special case: the World Bank series has no value for it after 2021, so the figure shown comes from the U.S. Department of Agriculture's Economic Research Service (ERS), which reports $222.3 billion of farm value added for 2023.
| Rank | Country | Value added (US$ billion) | Year and source |
|---|---|---|---|
| 1 | China | 1,309 | 2022, World Bank |
| 2 | India | 592 | 2022, World Bank |
| 3 | United States | 222 | 2023, USDA ERS |
| 4 | Nigeria | 185 | 2022, World Bank |
| 5 | Indonesia | 164 | 2022, World Bank |
| 6 | Brazil | 113 | 2022, World Bank |
| 7 | Pakistan | 84 | 2022, World Bank |
| 8 | Russia | 78 | 2022, World Bank |
| 9 | Türkiye | 62 | 2022, World Bank |
| 10 | Mexico | 57 | 2022, World Bank |
| 11 | Egypt | 52 | 2022, World Bank |
| 12 | Bangladesh | 52 | 2022, World Bank |
| 13 | Viet Nam | 49 | 2022, World Bank |
| 14 | France | 48 | 2022, World Bank |
| 15 | Ethiopia | 46 | 2022, World Bank |
Two features of the table deserve attention. First, China and India together account for far more value added than the next 13 countries combined. China alone is more than 2.2 times India and almost six times the United States. Second, the middle of the table contains several countries that most readers would not expect, led by Nigeria. Agriculture is a large part of the economy in lower-income countries, so even modest absolute output shows up as a high share of national accounts.
Why dollar rankings can mislead
Value added is measured in current US dollars, which means it moves with exchange rates. Nigeria is the clearest example in the data. The World Bank shows $184.7 billion for 2022 but $135.1 billion for 2023, a drop of about 27%. Swings of that size usually reflect currency and price movements rather than a one-year collapse of harvests, which is why economists look at physical output alongside dollar figures.
The indicator also includes forestry and fishing, so a country with large timber or fishery sectors gets a boost that is not strictly food. And because it counts only value added, a country that buys most of its feed and fertilizer abroad can look smaller than one that produces them domestically, even if the farms harvest similar amounts. None of this makes the ranking wrong. It means the ranking answers the question "which agricultural economies are biggest?" rather than "who grows the most calories?"
For the second question, you need tonnes.
Who leads in tonnes: the staple crops, meat, and milk
The FAO publishes production by crop and by country, and Our World in Data republishes the series. The 2024 figures below are the latest in that dataset at the time of writing. Rice is reported in tonnes of paddy (unmilled) rice, which weighs considerably more than the polished rice sold in stores.
| Commodity (2024) | 1st | 2nd | 3rd | 4th | 5th |
|---|---|---|---|---|---|
| All cereals | China, 651 Mt | United States, 455 Mt | India, 391 Mt | Brazil, 139 Mt | Russia, 120 Mt |
| Wheat | China, 140 Mt | India, 113 Mt | Russia, 83 Mt | United States, 54 Mt | Canada, 36 Mt |
| Rice (paddy) | India, 218 Mt | China, 208 Mt | Bangladesh, 61 Mt | Indonesia, 53 Mt | Viet Nam, 43 Mt |
| Maize (corn) | United States, 378 Mt | China, 295 Mt | Brazil, 115 Mt | Argentina, 57 Mt | India, 40 Mt |
| Soybeans | Brazil, 144 Mt | United States, 119 Mt | Argentina, 48 Mt | China, 21 Mt | India, 15 Mt |
| Sugar cane | Brazil, 760 Mt | India, 453 Mt | China, 102 Mt | Pakistan, 84 Mt | Thailand, 82 Mt |
| All meat | China, 98 Mt | United States, 48 Mt | Brazil, 30 Mt | India, 13 Mt | Russia, 13 Mt |
| Milk | India, 248 Mt | United States, 102 Mt | Pakistan, 67 Mt | China, 45 Mt | Brazil, 37 Mt |
Mt = million tonnes. Source: FAO production data via Our World in Data, 2024. Figures rounded.
Read across the rows and a pattern appears. China wins whenever the product is eaten directly by a very large population, which is why it leads cereals and meat. India wins where the work is done by millions of small producers, in paddy rice and milk. The United States and Brazil win in the crops that feed livestock and industry, namely maize, soybeans, and sugar cane. That division reflects where each country's land, climate, and capital were pointed over the past century, not an innate advantage.
It also shows how thin the margins can be. India's paddy rice crop of about 218 million tonnes beats China's 208 million tonnes by only about 5%, and the order of the two has flipped before as monsoons and procurement policies shift. The meat row has the opposite character: China's roughly 98 million tonnes is more than double the 48 million tonnes of the next country.
Why cereals dominate the discussion
Cereals matter because they are storable and tradable, so they work as a buffer for the whole food system. Researchers at several institutions noted in a 2017 study in the Proceedings of the National Academy of Sciences that wheat, rice, maize, and soybean together supply about two-thirds of human calories. A shock to any one of them, from drought in a major exporter to export bans, moves prices for everyone. That is why a handful of countries at the top of the cereals row carry global consequences far beyond their borders.
China: scale, intensity, and a dependence on imports
China's lead rests on size and diversity. Its agriculture added about $1.31 trillion in 2022, which the World Bank puts at 7.1% of national output, a modest share for an economy so large that even a small percentage represents more than the entire economy of many countries. In 2024 it harvested 651 million tonnes of cereals, including 140 million tonnes of wheat and 208 million tonnes of paddy rice, plus 295 million tonnes of maize, which it grows mostly for feed.
China also dominates animal protein and fish. Its meat output of about 98 million tonnes is more than double that of the United States. In aquatic animals, the FAO's 2024 State of World Fisheries and Aquaculture report credits China with 36% of world production in 2022, ahead of India (8%), Indonesia (7%), Viet Nam (5%), and Peru (3%). Global fisheries and aquaculture output that year reached 223.2 million tonnes, of which aquaculture was 130.9 million tonnes, so farmed fish and seaweed now outweigh wild capture.
Yet China is also the clearest example of a producer that depends on trade. Its soybean harvest of about 21 million tonnes in 2024 is small beside Brazil's 144 million tonnes, because most of the soybeans consumed in China, chiefly crushed into animal feed and cooking oil, are imported. The U.S. Department of Agriculture's ERS notes that China's share of U.S. agricultural exports rose from about 7% in 2001 to 2005 to 15% in 2021 to 2025, a change that shows how the Chinese feed and livestock sector reshaped American farm trade in two decades.
The long-term constraints are land and water per person. China feeds a population of about 1.4 billion from a limited area of farmland, which pushes farmers toward high fertilizer and irrigation use per hectare, and that intensity carries environmental costs in soil and water quality. For a related look at the land that underlies these figures, see countries with the most arable land.
India: dairy leader, rice giant, and a groundwater problem
India's agriculture is large in two ways at once. In absolute terms it ranks second, with $592 billion of value added in 2022. In relative terms it is far more important to the Indian economy than farming is in China or the United States: the World Bank puts agriculture at 18.2% of India's GDP in 2022, compared with 7.1% for China and 5.8% for Brazil.
The product mix explains the rest. India is first in milk by a wide margin, at about 248 million tonnes in 2024, which is 2.4 times the United States. It is first in paddy rice at about 218 million tonnes and second in wheat at 113 million tonnes. Its sugar cane crop of 453 million tonnes is second only to Brazil. Most of this comes from farms far smaller than the mechanized holdings of North America or Brazil, which is why India's output per worker is low even as its total output is huge.
The cost of that productivity shows up underground. A 2009 study in Nature by Matthew Rodell, Isabella Velicogna, and James Famiglietti used NASA's GRACE satellites, which detect tiny changes in Earth's gravity caused by water mass, to track groundwater in northwestern India. They estimated that groundwater in Rajasthan, Punjab, Haryana, and Delhi was being depleted at about 17.7 cubic kilometers per year, with a net loss of about 109 cubic kilometers between August 2002 and October 2008. Rainfall in the period was near normal, so the authors attributed the decline mainly to irrigation and other human use, and warned of risks for about 114 million residents of the region.
Imagine a bank account that receives an income of rain each year and pays out far more in pumped water. The balance, which took millennia to accumulate in aquifers, cannot fall forever. This is the central long-term risk behind India's staple output, and it is discussed in more depth in water scarcity: the growing global crisis.
The United States: the export engine
On value added alone, American agriculture looks modest. The USDA's ERS puts farm value added at $222.3 billion in 2023, about 0.8% of U.S. GDP. When you include the food processing, distribution, and related industries downstream of the farm gate, the ERS figure rises to about $1.537 trillion, or 5.5% of GDP.
Where the United States stands out is in a few crops and in trade. It produced about 378 million tonnes of maize in 2024, more than any other country, and about 119 million tonnes of soybeans, second only to Brazil. It ranks second in milk (102 million tonnes) and second in meat (48 million tonnes), and fourth in wheat (54 million tonnes). A large share of this production reaches foreign buyers. ERS reports U.S. agricultural exports of $177.2 billion in 2024 and $171.5 billion in 2025, and notes that high-value products such as dairy, meat, fruit, and vegetables made up 71% of exports in 2025, while the share of bulk grains and oilseeds has declined.
The geography behind those numbers is the Midwest, where deep soils formed beneath glacial deposits and a temperate climate with reliable summer rain suit maize and soybeans. The same crops that make the region productive also tie its output to a handful of decisions, such as how much maize goes to livestock feed, ethanol, or export, which is why U.S. harvest reports move global grain prices. The country also appears prominently in rankings of agricultural land and sits near the top in several of the commodity rows above.
Brazil: the tropical frontier
Brazil's position in the table is a story of crops rather than size. Its agriculture added about $113 billion in 2022, only 5.8% of GDP, yet it leads the world in soybeans (about 144 million tonnes in 2024) and sugar cane (about 760 million tonnes, roughly 1.7 times India's harvest). It also produced about 115 million tonnes of maize and about 30 million tonnes of meat, third in the world.
The soybean figure has an agronomic back story. Soybeans evolved in temperate East Asia and respond to day length, so growing them near the equator required decades of breeding for tropical latitudes and acidic soils. That agronomic work, combined with large areas of flat, rain-fed land, turned Brazil from a minor producer into the largest supplier. The consequence is that China, whose own soybean harvest is about 21 million tonnes, now relies heavily on Brazilian beans.
The expansion has an environmental side that readers should weigh. Clearing native vegetation for crops and pasture is a major source of habitat loss, and it affects global carbon storage as well as local biodiversity. Some of these trade-offs are covered in deforestation explained and in the ranking of countries with the most forest cover.
The middle of the table: Indonesia, Nigeria, Pakistan, Russia, and Türkiye
Countries ranked fourth to ninth are a varied group. Each rises in the table for a different reason.
Indonesia had $164 billion of agricultural value added in 2022, helped by a large rice sector (about 53 million tonnes of paddy in 2024, fourth in the world) and by tree crops. The United States Department of Agriculture's October 2026 World Agricultural Production circular estimates the 2026/27 Indonesian palm oil harvest at 45.0 million tonnes, down 4% from the previous year, after a prolonged dry spell in Sumatra and Kalimantan. It is a reminder that even tropical producers depend on rainfall timing.
Nigeria ranks fourth by 2022 value added at $184.7 billion, though the 2023 figure fell sharply in dollar terms for the exchange-rate reasons discussed above. Its position reflects the size of its farming population and the broad mix of staples it grows, rather than high yields.
Pakistan appears in several commodity rows: third in milk (about 67 million tonnes), fourth in sugar cane (84 million tonnes), seventh in wheat (32 million tonnes), and ninth in rice (about 15 million tonnes). Its agriculture depends on the Indus irrigation system, which makes it exposed to both flood and drought years.
Russia is the third largest wheat producer at 83 million tonnes in 2024, and with 120 million tonnes of cereals it ranks fifth overall. Ukraine, far smaller by value added ($13.9 billion in 2022), still harvested about 56 million tonnes of cereals and about 22 million tonnes of wheat in 2024, which shows how much weight a mid-sized country can carry in the grain trade.
Türkiye illustrates the weather risk. FAO data put its 2024 wheat harvest at 20.8 million tonnes. The USDA's October 2026 circular estimates a record 23.0 million tonnes for the 2026/27 marketing year, up 37% from the previous drought-affected crop, thanks to above-average rainfall across the Middle East. The 2026/27 estimates for Canada (36.5 million tonnes of wheat, down 10% from a record crop) and for Argentina's 2025/26 maize (a record 64.0 million tonnes) show the same effect from the other direction: weather moves national totals by tens of percent in a single year.
Europe's agricultural core: France and Germany
France ranks 14th in 2022 value added ($48 billion), and it is the largest cereal producer in the European Union in this dataset, with about 54 million tonnes of cereals in 2024, including about 27 million tonnes of wheat. Germany produced about 39 million tonnes of cereals and about 34 million tonnes of milk, sixth in the world, and about 6.9 million tonnes of meat, eighth.
These countries produce much less by tonnage than China or the United States, yet they matter because of what they sell. European output skews toward dairy, meat, and processed foods with high value per tonne, and the European Union's farm policy shapes what is grown through subsidies tied to environmental conditions. For comparison with other food-related rankings, see countries with the most organic farming.
Why the biggest producers are not automatically the best fed
Production is not the same as access to food. The FAO's State of Food Security and Nutrition in the World report estimates that 645 million people faced hunger in 2025. Hunger concentrates in countries affected by conflict, poverty, and climate shocks rather than in the largest agricultural economies, though some of those economies also contain large food-insecure populations.
Three gaps separate output from nutrition. The first is use: much of the world's maize and soybean harvest goes to animal feed and industry rather than directly to people, and sugar cane is processed into sugar and ethanol. The second is trade: food moves from surplus regions to deficit regions only if buyers can pay and ports, roads, and policies allow it. The third is waste, because food lost between farm and fork reduces the effective supply. The ranking of countries with the most hunger and the companion piece on countries that waste the most food look at the second and third gaps in more detail.
How climate and water put the rankings at risk
The large producers are not insulated from climate. A 2017 analysis in the Proceedings of the National Academy of Sciences by Chuang Zhao and 29 co-authors combined four independent methods, including global and point-based crop models, statistical regressions, and field warming experiments. All four found negative effects of rising temperature on global yields. Without CO2 fertilization, farmer adaptation, or genetic improvement, each 1 degree Celsius rise in global mean temperature would reduce average yields by about 6.0% for wheat, 3.2% for rice, 7.4% for maize, and 3.1% for soybean. The authors stress that results vary widely by crop and region and that adaptation can offset part of the loss.
For the countries in this ranking the arithmetic is uncomfortable. The three biggest maize producers, the United States, China, and Brazil, are growing the crop with the largest estimated yield sensitivity. The two largest rice producers depend on irrigation in regions where groundwater is already being drawn down faster than it recharges. The adaptation options include shifting planting dates, breeding heat- and drought-tolerant varieties, and improving irrigation efficiency, and these affect the rankings as much as the climate itself. To place these risks in context, see countries with the most freshwater stress.
There is also a biological reason that crops respond to temperature as they do. Photosynthesis, the process plants use to convert light and carbon dioxide into sugars, works best within a temperature window, and heat shortens the grain-filling period in cereals. The basics are explained in how photosynthesis works.
Common mistakes when reading food-production rankings
Rankings like this one are easy to misread. Several mistakes come up repeatedly.
- Treating tonnes as comparable across crops. Sugar cane is weighed whole, so Brazil's 760 million tonnes does not mean it feeds more people than a country producing 400 million tonnes of grain.
- Confusing paddy and milled rice. FAO paddy figures include the husk. Milled rice, the form people eat, weighs noticeably less once the husk and bran are removed.
- Using one year as the trend. Weather, exchange rates, and revisions can swing a single year by tens of percent, as the Nigeria and Türkiye examples show.
- Assuming production equals self-sufficiency. China grows most of its cereals but imports most of its soybeans.
- Ignoring definitions. Value added includes forestry and fishing. Gross value does not net out inputs such as feed. Always check what is being counted.
- Reading old lists as current. Many online rankings mix years and sources. Every figure in this article carries its year and source for that reason.
Frequently Asked Questions
Q: What country produces the most food in the world? A: China, by most broad measures. The World Bank puts its agricultural value added at about $1.31 trillion in 2022, and FAO data show it first in cereals (651 million tonnes) and meat (about 98 million tonnes) in 2024. India leads in rice and milk, the United States in maize, and Brazil in soybeans and sugar cane.
Q: Which country is the biggest food exporter? A: Export rankings differ from production rankings. The United States is one of the largest agricultural exporters, with about $177.2 billion of exports in 2024 and $171.5 billion in 2025, according to USDA ERS. Brazil dominates soybean exports, but a full list of exporters by value depends on which products and which trade statistics are included.
Q: What is the difference between food production and food security? A: Production measures how much is grown. Food security measures whether people can get enough safe and nutritious food, which depends on income, prices, trade, storage, and conflict as well as harvests. The FAO estimates that 645 million people faced hunger in 2025, even though global production of staples is large.
Q: How is climate change affecting global food production? A: Higher temperatures generally reduce yields of the main staples. A 2017 PNAS study combining four methods estimated average losses of about 6.0% for wheat, 3.2% for rice, 7.4% for maize, and 3.1% for soybean per 1 degree Celsius of global warming, before adaptation. Regional results vary, and adaptation can offset part of the effect.
Q: Why does India produce so much milk but rank behind China overall? A: India's dairy sector is the world's largest, at about 248 million tonnes of milk in 2024, but agricultural value added is driven by total output across all products at prevailing prices. China's much larger meat, vegetable, and grain output gives it more than twice India's value added.
Q: What is the most produced food crop in the world? A: By weight, sugar cane is the largest crop, with Brazil (about 760 million tonnes) and India (about 453 million tonnes) the leading producers in 2024. For direct human food, cereals such as maize, rice, and wheat dominate, and rice and wheat supply a large share of calories worldwide.
Q: Where do I find the underlying data? A: The FAO publishes crop and livestock statistics through FAOSTAT. The World Bank's open data site publishes agricultural value added for most countries, and national agencies such as the USDA publish their own series. The sources used here are listed below.
The takeaway
China leads the world in food output on almost every broad measure, yet the headline hides several different stories. India leads where millions of small producers supply rice and milk, the United States and Brazil lead in the crops that feed animals and industry, and a handful of middle-income countries rank higher than their reputations suggest. The ranking changes with the yardstick, with exchange rates, and with the weather in a given year.
What stays constant is the concentration: a small group of countries supplies most of the world's grain, meat, and sugar, and the same group faces mounting pressure from heat, drought, and falling groundwater. Whether the world can feed itself in coming decades depends as much on how those countries manage soil and water as on how much more they plant.
Sources
- World Bank, "Agriculture, forestry, and fishing, value added (current US$)", 2022 data via the World Bank API: https://api.worldbank.org/v2/country/all/indicator/NV.AGR.TOTL.CD?format=json&date=2022&per_page=400
- USDA Economic Research Service, "Ag and Food Sectors and the Economy" (farm value added, 2023): http://www.ers.usda.gov/data-products/ag-and-food-statistics-charting-the-essentials/ag-and-food-sectors-and-the-economy
- USDA Economic Research Service, "U.S. Agricultural Trade at a Glance" (exports, 2024 and 2025): https://www.ers.usda.gov/topics/international-markets-u-s-trade/u-s-agricultural-trade/u-s-agricultural-trade-at-a-glance
- FAO production data (2024) via Our World in Data: https://ourworldindata.org/grapher/cereal-production.csv?v=1&csvType=filtered&useColumnShortNames=false&time=latest and the equivalent wheat-production, rice-production, maize-production, soybean-production, sugar-cane-production, meat-production-tonnes, and milk-production-tonnes datasets
- FAO, "Global fisheries and aquaculture production reaches a new record high" (State of World Fisheries and Aquaculture 2024): https://www.fao.org/newsroom/detail/fao-report-global-fisheries-and-aquaculture-production-reaches-a-new-record-high/en
- FAO, The State of Food Security and Nutrition in the World (2026 edition page): https://www.fao.org/publications/home/fao-flagship-publications/the-state-of-food-security-and-nutrition-in-the-world/en
- USDA Foreign Agricultural Service, World Agricultural Production, October 2026 circular: https://apps.fas.usda.gov/psdonline/circulars/production.pdf
- Zhao C. et al. (2017), "Temperature increase reduces global yields of major crops in four independent estimates," PNAS 114(35): https://doi.org/10.1073/pnas.1701762114
- Rodell M., Velicogna I., Famiglietti J.S. (2009), "Satellite-based estimates of groundwater depletion in India," Nature 460: https://doi.org/10.1038/nature08238
Related Reading
Follow new articles
Add SciHub101 to your feed reader to see new science and technology stories.
About the Author
SciHub101 is an independent science and technology publication founded and edited by Buğra Sözeri, a software engineer and app developer based in Türkiye. AI tools assist with drafting and research. Source documentation in the existing archive is uneven, and articles are being reviewed and corrected. The Editorial Team byline identifies editorial responsibility; it does not certify specialist or independent human review. Where we compare products, anything built by our own team is labelled as such — see the editorial guidelines and About page for how corrections and disclosures work.
Related Articles
Top Wheat Producing Countries in the World (2026)
Wheat feeds more people than any other cereal crop and underpins global food security. This ranking uses USDA and FAO data to show which countries grow the most wheat, which ones export it, and why the two lists look so different.
Countries Producing the Most E-Waste (2025 Ranked)
The world generated 62 million tonnes of e-waste in 2022 — a record. China produces the most e-waste in absolute terms (12 million tonnes). Norway and Iceland generate the most per capita. Only 22% of e-waste is formally recycled. E-waste contains $62 billion in recoverable precious metals annually.
Countries With the Most Arable Land (2025)
India and the United States each farm roughly 150 million hectares of arable land, with Russia and China next. Yield, water, and soil decide what that land actually feeds. Here is the ranking and what it leaves out.
Countries with the Most Agricultural Land (FAO 2022 Ranked)
The United States has the most agricultural land at about 421 million hectares, ahead of China and Australia. But India has the most cropland, Kazakhstan has the most arable land per person, and most of the world's farmland is pasture. Here is who has what, and what threatens it.
AI & Sustainable Agriculture: Feeding 10 Billion Without Destroying the Planet
How machine learning cuts fertilizer and herbicide use, catches disease early, and pushes yield up without expanding farmland.

AI in Sustainable Agriculture: How Crop Yield Prediction Is Changing Farming
Machine learning models are helping farmers grow more food with fewer resources, reducing waste and environmental impact at scale.