Top Wheat Producing Countries in the World (2026)
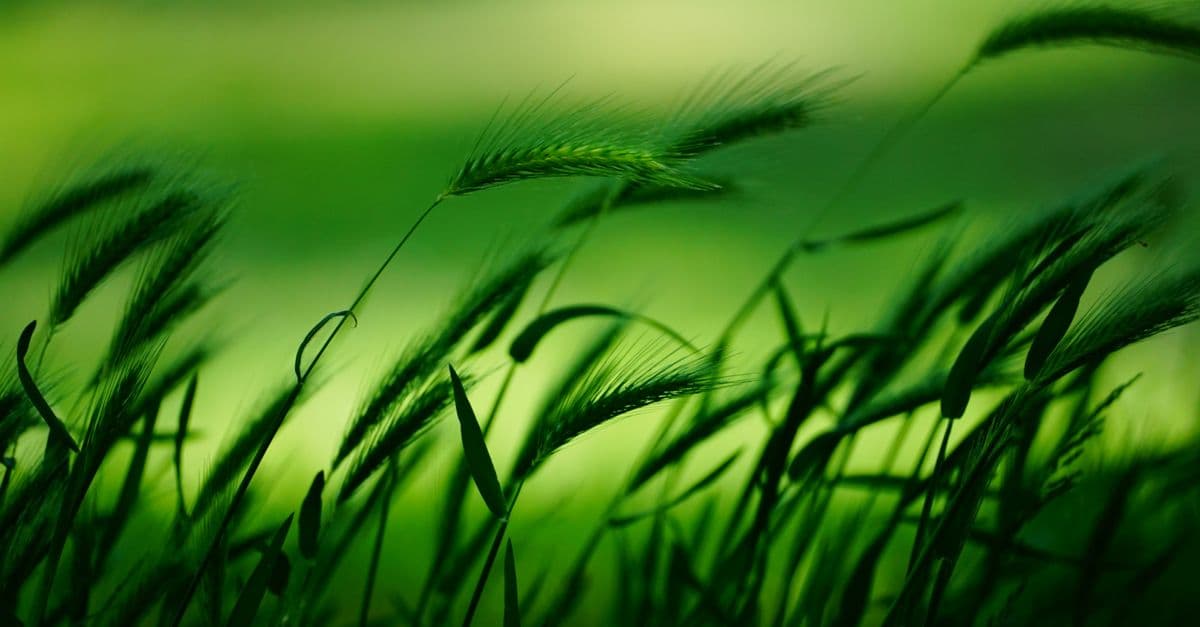
Photo: Michaela St / Pexels
Wheat is grown on more land than any other food crop, about 219.5 million hectares in 2024 according to FAO statistics, and the world harvests close to 800 million tonnes of it in a typical year. The USDA's October 2026 estimates put the 2025/26 crop at 844.1 million tonnes, the highest of the five years in USDA's table, and forecast 822.4 million tonnes for 2026/27. A handful of producers account for most of it, and the biggest growers are not the biggest sellers. This ranking uses USDA and FAO data to show who grows the wheat, who ships it, and who depends on imports.
Key takeaways
- The EU (27 countries together), China, India, Russia, and the United States produced about 65% of the world's wheat in 2025/26, by USDA estimates.
- China is the largest single-country producer at about 140 million tonnes a year, but it consumes roughly 150 million tonnes and holds roughly 43% to 49% of world stocks.
- Russia led exports in each of the last three trade years, at 43.0 to 55.5 million tonnes, though USDA now forecasts only 40 million tonnes for 2026/27, the lowest in five years.
- Year-to-year swings are large: Argentina's crop went from 18.5 to 27.9 million tonnes between 2024/25 and 2025/26, and the U.S. crop is forecast to fall from 54.1 to 41.7 million tonnes in 2026/27.
- Yields differ more than twofold between intensive European systems and dry-land exporters such as Australia.
Top wheat producing countries, ranked
The table below uses USDA Foreign Agricultural Service estimates from the October 2026 edition of Grain: World Markets and Trade. Years are local marketing years, so 2025/26 means the crop harvested in 2025 in the Northern Hemisphere and late 2025 in Australia and Argentina. The 2026/27 column is a forecast. The European Union is shown as a bloc of 27 countries because USDA reports it that way; France and Germany are broken out in the next section.
| Rank | Producer | 2024/25 (Mt) | 2025/26 (Mt) | 2026/27 forecast (Mt) | Share of 2025/26 world crop |
|---|---|---|---|---|---|
| 1 | European Union (bloc) | 121.6 | 145.1 | 133.0 | 17.2% |
| 2 | China | 140.1 | 140.1 | 141.0 | 16.6% |
| 3 | India | 113.3 | 117.9 | 121.0 | 14.0% |
| 4 | Russia | 81.6 | 90.3 | 88.0 | 10.7% |
| 5 | United States | 53.9 | 54.1 | 41.7 | 6.4% |
| 6 | Canada | 35.9 | 40.6 | 36.5 | 4.8% |
| 7 | Australia | 34.1 | 36.0 | 31.0 | 4.3% |
| 8 | Pakistan | 31.8 | 28.4 | 29.0 | 3.4% |
| 9 | Argentina | 18.5 | 27.9 | 21.5 | 3.3% |
| 10 | Ukraine | 23.4 | 24.1 | 26.0 | 2.9% |
| 11 | Kazakhstan | 18.6 | 19.3 | 15.0 | 2.3% |
| 12 | Turkey | 19.0 | 16.8 | 23.0 | 2.0% |
| 13 | Iran | 16.0 | 13.5 | 16.0 | 1.6% |
| 14 | United Kingdom | 11.1 | 12.0 | 12.0 | 1.4% |
| 15 | Egypt | 9.0 | 9.2 | 10.0 | 1.1% |
| World | 799.1 | 844.1 | 822.4 | 100% |
Source: USDA FAS, Grain: World Markets and Trade, October 2026, World Wheat Production, Consumption, and Stocks table. Shares are calculated from those figures. Rounded to one decimal.
Taken together, the 15 rows add up to about 92% of the 2025/26 world crop. The first five rows alone make up about 65%, which is why a bad season in one or two regions can move world prices.
Note how the ranking changes with the year. If you count the EU as a bloc, it ranks first in 2025/26 on the back of a recovery from the weak 2024/25 crop, and China and India are close behind. Counted by single country, China is first in all three columns. The FAO's own statistics use calendar years and list China, India, and Russia as the three largest producers in 2024, at 140.1, 113.3, and 82.5 million tonnes, which is consistent with the USDA marketing-year numbers above.
Different agencies, slightly different totals
World totals vary by source because agencies use different reporting calendars, definitions, and update dates. For 2024, FAOSTAT-based statistics give a world total of 798.5 million tonnes, close to USDA's 799.1 million tonnes for 2024/25. For 2026 the FAO's October 2026 Cereal Supply and Demand Brief forecasts 813.9 million tonnes of wheat, down 3.3% from the previous year, while USDA forecasts 822.4 million tonnes for 2026/27. Neither is wrong; they measure slightly different periods and use different assumptions. When comparing sources, check the date and the marketing-year definition before drawing a conclusion.
Inside the EU: France and Germany
Because the EU appears as one line, it hides the national picture. FAOSTAT figures for 2024, taken from Our World in Data, show France at about 26.6 million tonnes and Germany at about 18.5 million tonnes. Together those two countries account for about 37% of the EU's USDA-reported 2024/25 crop of 121.6 million tonnes (a calendar-year figure set against a marketing-year one, so treat the share as approximate). The remainder comes from the other member states.
Exporters: a different ranking
Production and trade rankings diverge because large producers often eat most of what they grow. USDA's trade-year data, which run July to June, show who actually sells wheat to the world.
| Rank (2025/26) | Exporter | 2024/25 (Mt) | 2025/26 (Mt) | 2026/27 forecast (Mt) |
|---|---|---|---|---|
| 1 | Russia | 43.0 | 48.0 | 40.0 |
| 2 | European Union | 27.9 | 31.7 | 31.0 |
| 3 | Canada | 28.6 | 29.6 | 30.5 |
| 4 | United States | 22.8 | 24.4 | 20.5 |
| 5 | Australia | 21.3 | 23.2 | 24.5 |
| 6 | Argentina | 10.4 | 19.0 | 16.0 |
| 7 | Ukraine | 15.8 | 14.1 | 12.5 |
| 8 | Kazakhstan | 10.0 | 11.8 | 9.5 |
| 9 | Turkey | 7.1 | 6.5 | 6.0 |
| World | 205.0 | 226.5 | 210.1 |
Source: USDA FAS, Grain: World Markets and Trade, October 2026, World Wheat, Flour, and Products Trade table. Trade includes flour and wheat products in grain equivalent.
Russia's share works out to roughly 21% of world exports in both 2024/25 and 2025/26 (43.0 of 205.0 and 48.0 of 226.5 million tonnes), and about 19% in the 2026/27 forecast. USDA's Economic Research Service notes that Russia and the EU are the largest exporters and that the United States, EU, Canada, Australia, Argentina, and the former Soviet Union together have supplied nearly 90% of world wheat exports since 2000, down from 95% or more before then. The U.S. share is forecast at about 11% for 2025/26.
The ranking flips at the importing end. Most wheat imports go to developing countries with limited production capacity, with fast-growing markets in North Africa, sub-Saharan Africa, the Middle East, and Southeast Asia. According to USDA:
| Importer | 2024/25 (Mt) | 2025/26 (Mt) | 2026/27 forecast (Mt) |
|---|---|---|---|
| Indonesia | 10.5 | 13.0 | 12.5 |
| Egypt | 12.5 | 15.2 | 11.5 |
| Algeria | 9.1 | 8.7 | 8.3 |
| Brazil | 7.3 | 6.5 | 7.5 |
| Philippines | 6.4 | 7.8 | 7.1 |
| Bangladesh | 5.8 | 7.4 | 6.5 |
| Vietnam | 5.7 | 7.3 | 6.2 |
| China | 4.2 | 5.5 | 6.0 |
Source: same USDA table. Selected importers only; the EU and Turkey also appear in the full table.
China: the quiet giant
China harvests about 140 million tonnes a year and exports almost none of it. Its consumption, at about 150 million tonnes in 2024/25 by USDA estimates, is slightly above its crop, so it imports the difference when it needs to. Those imports have swung widely. In USDA's series China imported 13.3 million tonnes in 2022/23 and 13.6 million tonnes in 2023/24, then only 4.2 million tonnes in 2024/25, before rising to 5.5 million tonnes in 2025/26.
The key to that pattern is stockholding. China's ending wheat stocks were 127.8 million tonnes in 2024/25 and 122.2 million tonnes in 2025/26, which by USDA's numbers is about 49% and 43% of the world total. When the government runs down reserves, it buys less abroad. In plain terms, one country's warehouse policy can move global trade as much as a drought in a major exporter.
China's production concentrates on the North China Plain, a flat, densely farmed region that relies heavily on irrigation. Yields are among the higher of the big producers at about 5.9 tonnes per hectare in 2024 (FAOSTAT via Our World in Data), against a world average of roughly 3.6 tonnes per hectare, which is calculated from the 2024 production and area figures above.
India: Green Revolution legacy, climate exposure
India is the world's second-largest producer by single country, with USDA estimating 113.3 million tonnes in 2024/25, 117.9 million tonnes in 2025/26, and a forecast 121.0 million tonnes in 2026/27. Most of the crop is grown in the northwestern Indo-Gangetic plains, mainly in Uttar Pradesh, Punjab, Haryana, and Madhya Pradesh. Punjab alone produces about 18% of India's wheat and is nicknamed the "Granary of India."
The modern story begins with the Green Revolution, when high-yielding dwarf wheat varieties associated with the plant breeder Norman Borlaug spread across South Asia. Dwarf plants put more energy into grain and are less likely to fall over when fed heavily with nitrogen fertilizer, which links the wheat boom to industrial nitrogen fixation and the history of artificial fertilizer. Punjab's production has tripled since the Green Revolution.
Heat is the risk. A Department of Agriculture and Farmers Welfare report cited in reference works estimates that each 1 degree Celsius of warming reduces India's wheat production by 4 to 5 million tonnes. In 2022, after a hot spring and with world markets disrupted by the war in Ukraine, India prohibited wheat exports, later allowing shipments case by case as humanitarian aid. Government procurement from farmers that year was about 18.8 million tonnes, 53% less than the year before. India's exports in USDA's series fell from 1.6 million tonnes in 2022/23 to 0.4 million tonnes in 2023/24 and 0.2 million tonnes in 2024/25, though USDA's October 2026 forecast for 2026/27 is 2.0 million tonnes.
India also feeds a very large share of its own population from public stocks. A policy that began on January 1, 2024 distributes free grain to about 810 million people for five years, using roughly 18.4 million tonnes of wheat from government reserves, according to a summary of the scheme. That domestic safety net is why India's harvest, however large, rarely turns into export volume.
Russia: the export powerhouse
Russia grew 81.6 million tonnes in 2024/25 and 90.3 million tonnes in 2025/26, with 88.0 million tonnes forecast for 2026/27. It consumes about 41 million tonnes domestically, so roughly half the crop is available to sell. The result is that Russia ranks first in exports even though it ranks fourth in production.
The volume has been volatile. Russian exports were 49.0 million tonnes in 2022/23, 55.5 million tonnes in 2023/24, 43.0 million tonnes in 2024/25, and 48.0 million tonnes in 2025/26, per USDA. In October 2026, USDA cut its 2026/27 forecast by 3.0 million tonnes to 40.0 million tonnes, the lowest in five years, citing in part the ongoing conflict and trade disruption at Black Sea ports. USDA reported that Russian shipments to Egypt fell by nearly 50% and to Turkey by nearly 90% in the first quarter of the 2026/27 trade year compared with a year earlier, and that exports were moving increasingly through Baltic ports.
Importers also grew bumper crops of their own. Turkey and Egypt are forecast to harvest record crops in 2026/27, at 23.0 and 10.0 million tonnes. The Turkish Grain Board announced it would release 5.5 million tonnes of stocks for sale. Together these shifts reduce near-term demand for Russian wheat.
Price tells the same story. USDA, citing International Grains Council quotes from October 6, 2026, reported free-on-board export prices of $212 per tonne for Russian Black Sea milling wheat, compared with $252 for Argentina, $284 for the EU (French grade 1 at Rouen), $314 for Canada (CWRS), $315 for Australia, and $339 for U.S. hard red winter at the Gulf. The spread reflects differences in wheat class and quality as well as logistics, so it should not be read as a pure measure of supply.
Ukraine: from breadbasket to contested supplier
Ukraine's USDA production series runs 21.5 million tonnes in 2022/23, 23.0 in 2023/24, 23.4 in 2024/25, 24.1 in 2025/26, and a forecast 26.0 in 2026/27. Exports were 17.1, 18.6, 15.8, and 14.1 million tonnes in the first four of those years, with 12.5 million tonnes forecast for 2026/27. The fertile black-soil region that dominates the country's farmland is among the most productive wheat land in Europe, but the war has disrupted ports, labor, and logistics.
The Black Sea Grain Initiative was the main attempt to keep exports flowing. It was signed in Istanbul on July 22, 2022, and allowed shipments from the Ukrainian ports of Odesa, Chornomorsk, and Yuzhny. The United Nations served as the secretariat of a Joint Coordination Centre hosted by Türkiye, and the third term of the agreement expired on July 17, 2023 without renewal. Ukraine's ending wheat stocks fell to 0.7 million tonnes in 2024/25 in USDA's data, and USDA projects 6.1 million tonnes in 2026/27, which suggests larger crops are rebuilding buffer supplies.
Disruptions to grain shipments matter most where households already spend a large share of income on food. For the demand side of the problem, see our ranking of countries with the most hunger.
The United States, Canada, Australia, and Argentina
These four are the other major exporters, and their crops swing more than the big Asian producers because rainfall plays a larger role.
- United States. USDA's Economic Research Service reports that the U.S. produces roughly 6% to 7% of world wheat and estimates 2025/26 production at 1.98 billion bushels from 37.2 million harvested acres. The October 2026 forecast for 2026/27 is 41.7 million tonnes, down from 54.1, with the season-average farm price lowered 10 cents to $6.30 per bushel.
- Canada. Production rose from 35.9 million tonnes in 2024/25 to 40.6 million tonnes in 2025/26, with 36.5 million tonnes forecast for 2026/27. Exports have been steady at 28.6, 29.6, and a forecast 30.5 million tonnes, which makes Canada the most consistent of the major sellers.
- Australia. Output was 40.5 million tonnes in 2022/23, then dropped to 26.0 million tonnes in 2023/24, a decline of about 36%, before recovering to 34.1 and 36.0 million tonnes. A forecast of 31.0 million tonnes for 2026/27 shows how much rain matters.
- Argentina. The 2025/26 crop of 27.9 million tonnes was 51% larger than the 18.5 million tonnes of 2024/25, and exports jumped from 10.4 to 19.0 million tonnes. USDA says Argentina, as a competitively priced supplier, is shipping larger volumes to Asia and will have plentiful supplies after its November harvest.
Why yields differ so much
Yield, in tonnes of wheat per hectare, depends on climate, soil, variety, fertilizer, and water. Using FAOSTAT figures for 2024 reported by Our World in Data:
| Country | 2024 yield (t/ha) |
|---|---|
| Germany | 7.08 |
| Egypt | 6.78 |
| France | 5.97 |
| China | 5.94 |
| Canada | 3.37 |
| Argentina | 2.92 |
| Australia | 2.61 |
The world average was about 3.6 tonnes per hectare, calculated from 798.5 million tonnes on 219.5 million hectares. The gap shows a trade-off between intensity and scale. Northwestern Europe and the irrigated Nile valley combine fertilizer, disease control, and reliable water on small areas. Australia and the Canadian prairies farm very large, mostly rain-fed areas at lower intensity, and a dry year hits them directly. Higher yield per hectare does not always mean higher total output; Australia's average yield is lower than Germany's, but its much larger area still makes it a top-10 producer.
Heat and drought are the main long-term threats to yields, which connects wheat to the broader topics of extreme weather and climate change and to the strain on freshwater resources in irrigated regions such as northern China and Punjab.
Wheat classes and why they trade at different prices
Not all wheat is interchangeable. The U.S. grain trade sorts wheat into classes by growing season, kernel hardness, and color, and each class suits different foods. Hard wheats have higher protein and make bread; soft wheats suit cakes, crackers, and pastries; durum is used for pasta and couscous. USDA's October 2026 report listed these U.S. export bids in early October:
| U.S. class | Typical use | Export bid (US$ per tonne, October 2026) |
|---|---|---|
| Hard Red Winter (HRW) | Bread, all-purpose flour | 339 |
| Hard Red Spring (HRS) | Premium bread, blending | 320 |
| Soft Red Winter (SRW) | Cakes, crackers, cookies | 301 |
| Soft White Winter (SWW) | Pastry, noodles, flatbreads | 270 |
Source: USDA FAS, International Grains Council quotes cited in the October 2026 Grain: World Markets and Trade. The report notes that SWW fell $15 to $270 and that HRW and HRS each fell $11 over the month.
Canada Western Red Spring (CWRS), a hard spring wheat with high protein, is priced separately and quoted at $314 per tonne in the same report. These spreads reflect protein content, milling quality, and logistics, not just supply and demand.
A short history: from the Fertile Crescent to world trade
Wheat was first cultivated in the Fertile Crescent around 9600 BC, though hunter-gatherers in West Asia had harvested wild wheats for thousands of years before that. The crop spread across Eurasia and, much later, to the Americas and Australia. For most of the twentieth century its yields were improved by breeding, including Norin 10, a semi-dwarf variety developed in Japan in the 1930s, and the dwarf varieties that powered the Green Revolution. After 1955, the annual rate of yield improvement rose roughly tenfold compared with earlier centuries.
By the end of the twentieth century world trade in wheat exceeded that of all other crops combined. Wheat is also a staple for poorer households. According to CIMMYT, the international wheat research center, wheat is the main staple for about 1.2 billion poor people who live on less than US$2 a day, and in the least developed countries it supplies about 20% of daily calories and protein. That dependence is why the fate of a few big producers matters well beyond their borders, and why countries with large amounts of arable land and agricultural land hold strategic weight in food security.
What the rankings do not show
Rankings are snapshots, and a few caveats apply.
- Marketing years versus calendar years. USDA's 2025/26 is not the same period as FAO's 2025. Compare like with like.
- The EU is not one country. USDA reports the bloc as a unit. Per-country data for France, Germany, or Poland come from other sources and use other calendars.
- Estimates get revised. USDA updates its numbers monthly, and 2026/27 figures are forecasts. The October 2026 edition cut world trade, and later editions may move again.
- Wheat is only one cereal. For total food output, see our ranking of countries that produce the most food.
- Quality varies. A tonne of feed wheat and a tonne of milling wheat are not the same product, which is why export prices differ by country.
Frequently Asked Questions
Q: Which country produces the most wheat? A: China is the largest single-country producer, at about 140 million tonnes in both 2024/25 and 2025/26 by USDA estimates. If the 27-country European Union is counted as one producer, it ranked first in 2025/26 at 145.1 million tonnes. India and Russia follow.
Q: Which country exports the most wheat? A: Russia has led wheat exports in each recent year, with 43.0 million tonnes in 2024/25 and 48.0 million tonnes in 2025/26, about 21% of world trade. USDA's October 2026 forecast cuts Russia to 40.0 million tonnes for 2026/27, which would be its lowest in five years.
Q: Why does China produce so much wheat but export so little? A: China consumes about as much as it grows, roughly 150 million tonnes a year against a crop of about 140 million, and it holds large reserves. It is a net importer in most years, buying 4.2 million tonnes in 2024/25 and 5.5 million tonnes in 2025/26 after importing more than 13 million tonnes in each of the two years before.
Q: What is the global average wheat yield per hectare? A: About 3.6 tonnes per hectare, calculated from 798.5 million tonnes harvested on 219.5 million hectares in 2024. Germany (7.08 t/ha), Egypt (6.78), France (5.97), and China (5.94) are well above that, while Canada (3.37), Argentina (2.92), and Australia (2.61) are below it.
Q: How did the war in Ukraine affect wheat supplies? A: It disrupted Ukrainian ports and shipping, and the Black Sea Grain Initiative, signed on July 22, 2022, was not renewed after July 17, 2023. Ukraine's wheat exports in USDA's series fell from 18.6 million tonnes in 2023/24 to 15.8 and 14.1 million tonnes in the following two years.
Q: Is global wheat production rising? A: Long term, yes: yields have climbed since the mid-twentieth century. Year to year it moves with weather. USDA's world estimates were 799.1 million tonnes in 2024/25, 844.1 million tonnes in 2025/26, and a forecast 822.4 million tonnes for 2026/27, while the FAO forecasts 813.9 million tonnes for 2026, down 3.3%.
Q: Why do wheat prices differ between countries? A: Prices reflect wheat class, protein content, quality, shipping costs, and risk. In early October 2026 USDA reported Russian Black Sea milling wheat at $212 per tonne against $339 for U.S. hard red winter at the Gulf, a gap of $127 per tonne.
The Bottom Line
The wheat map is a story of two economies. The big domestic producers, China and India, grow enormous crops to feed their own people and manage supply with state stockpiles. The export powers, Russia, the EU, Canada, the United States, Australia, and Argentina, sell the surplus to import-dependent countries in North Africa, the Middle East, and Asia, and the sellers' harvests set the price. What matters most for global food security is less the total than where the surplus sits, how reliable the shipping routes are, and how much grain is held in reserve. In 2026 the numbers show a market with ample supply and still fragile logistics.
Sources
- USDA Foreign Agricultural Service, Grain: World Markets and Trade (October 2026). This URL always points to the current edition; the figures in this article are from the October 2026 edition.
- FAO, Cereal Supply and Demand Brief and World Food Situation
- USDA Economic Research Service, Wheat Sector at a Glance
- Wheat, Wikipedia (FAOSTAT 2024 production, area, trade, history)
- Our World in Data, wheat production (FAOSTAT)
- Our World in Data, wheat yields (FAOSTAT)
- United Nations, Black Sea Grain Initiative
- Wheat production in India, Wikipedia
- CIMMYT, Wheat
Related Reading
Follow new articles
Add SciHub101 to your feed reader to see new science and technology stories.
About the Author
SciHub101 is an independent science and technology publication founded and edited by Buğra Sözeri, a software engineer and app developer based in Türkiye. AI tools assist with drafting and research. Source documentation in the existing archive is uneven, and articles are being reviewed and corrected. The Editorial Team byline identifies editorial responsibility; it does not certify specialist or independent human review. Where we compare products, anything built by our own team is labelled as such — see the editorial guidelines and About page for how corrections and disclosures work.
Related Articles
Countries With the Cleanest Air in the World (2025)
Air quality is one of the most direct indicators of environmental health. This ranking shows which countries and territories breathe the cleanest air, which suffer the worst pollution, and why small islands keep beating industrial giants on the numbers.
Countries That Produce the Most Food (Ranked, 2026 Update)
China leads almost every broad measure of food output, but the ranking changes with the metric. Here is who leads by value added, by staple crop tonnage, and by meat and milk, with sources and caveats.

Plant Growth Without Gravity: ISS Agriculture Research for Deep Space Exploration
ISS plant experiments reveal how crops survive and thrive without gravity, essential knowledge for food production on the Moon, Mars, and interplanetary spacecraft.
Countries With the Most Arable Land (2025)
India and the United States each farm roughly 150 million hectares of arable land, with Russia and China next. Yield, water, and soil decide what that land actually feeds. Here is the ranking and what it leaves out.
Best Free Hydroponic Calculators and References 2026
Best free hydroponic calculators and references in 2026: Rootless Farm for crop profiles and 18 tools, plus five university and open tools, with limits.

How to Start a Sustainable Garden at Home: Composting, Native Plants, Soil Health, and No-Dig Methods
Starting a sustainable home garden requires understanding five core practices: composting organic waste (reducing landfill methane emissions and creating nutrient-rich soil amendment), selecting native plants adapted to local climate and water (reducing irrigation by 50–70% compared to exotic plants), building healthy soil through no-dig and mulching methods (improving water retention, reducing chemical inputs), water-wise gardening via mulch and irrigation optimization (cutting water use by 30–50%), and avoiding synthetic pesticides and fertilizers. A typical backyard garden (400–600 sq ft) requires 3–6 months to establish, costs $200–$500 for initial soil amendments and plants, and produces 50–150 lbs of vegetables or fruit annually depending on crop selection, reducing household food costs by $300–$600/year and offsetting 200–400 lbs of CO2 emissions from avoided food transport.