Countries Facing the Worst Freshwater Stress (WRI Ranked)
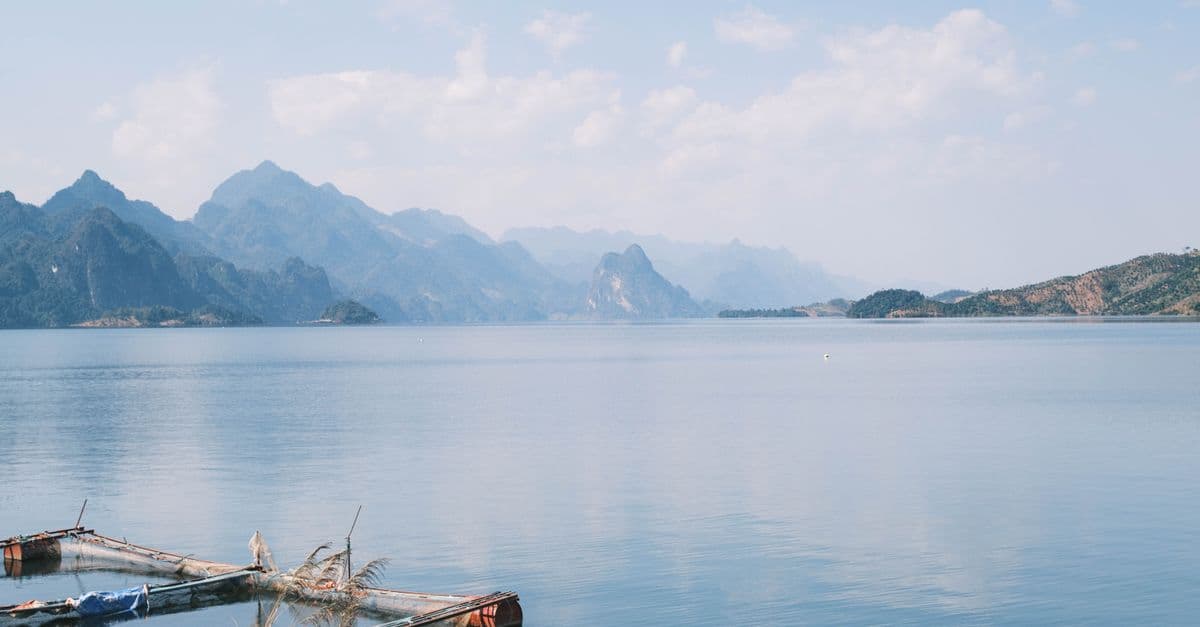
Photo: Elyas / Pexels
A country is water stressed when its people, farms, and factories draw a large share of the renewable freshwater available to it each year. The World Resources Institute (WRI) found in 2023 that 25 countries, home to about one quarter of the world's population, use at least 80% of their supply in a typical year. Bahrain, Cyprus, Kuwait, Lebanon, Oman, and Qatar head that list. This article explains how the ranking is built, why agencies disagree, and what Cape Town, Chennai, Israel, and the Aral Sea show about causes and fixes.
Key takeaways
- 25 countries face "extremely high" water stress in WRI's Aqueduct 4.0 update (August 2023), meaning they withdraw at least 80% of available renewable supply in a typical year.
- Bahrain, Cyprus, Kuwait, Lebanon, Oman, and Qatar are the six most stressed countries named by WRI.
- About 4 billion people, roughly half of humanity, live under highly stressed conditions for at least one month a year.
- Different agencies draw the lines differently. The UN's SDG 6.4.2 indicator, FAO categories, and WRI's Aqueduct all use a withdrawal ratio but set different thresholds, so country counts do not match.
- Stress is not the same as shortage. Israel and the Gulf states manage severe stress with desalination and reuse, while cities such as Chennai and Cape Town hit crisis with far more supply on paper.
How water stress is measured, and why the rankings disagree
Water stress is a ratio. WRI defines it as water demand divided by renewable supply, and it measures "the competition over local water resources." If a basin has 100 units of renewable water a year and users withdraw 40, the stress is 40%. If users withdraw 90, the basin is in the extremely high category, and a dry year can push demand past what the rivers and aquifers can deliver.
Think of a household budget. A family earning 100 and spending 40 can absorb a car repair. A family spending 90 has no slack, and any shock goes onto a credit card. In water terms, the credit card is fossil groundwater, which accumulated over thousands of years and does not refill on any human timescale.
The trouble is that no single set of cut-offs is universal. WRI's Aqueduct treats withdrawals of 40% of supply as "high" and at least 80% as "extremely high." The UN and FAO indicator for Sustainable Development Goal 6.4.2 uses different bands, as shown in the table below.
| Scheme | Metric | Thresholds | Source |
|---|---|---|---|
| WRI Aqueduct 4.0 (2023) | Withdrawals divided by renewable supply | High: about 40%. Extremely high: at least 80% | WRI, August 2023 |
| UN-Water / FAO, SDG 6.4.2 (as presented by Our World in Data) | Freshwater withdrawals divided by renewable freshwater resources | Under 25%: no stress. 25-50%: low. 50-75%: medium. 75-100%: high. Over 100%: critical | Our World in Data |
| FAO 2018 (as summarized on Wikipedia) | Withdrawals divided by renewable resources minus environmental flow needs | Under 10%: low. 10-20%: low to medium. 20-40%: medium to high. 40-80%: high. Over 80%: very high | Wikipedia: Water stress |
| Falkenmark indicator | Renewable water per person per year | Under 1,700 m³: stress. Under 1,000 m³: scarcity | Wikipedia: Water stress |
A country can be "high" on one scale and "extremely high" on another, which is why a headline such as "17 countries" in 2019 and "25 countries" in 2023 does not mean the world suddenly got worse. WRI's own page describes the 2023 count as the result of an updated model, Aqueduct 4.0, not a simple year-over-year comparison.
What does a withdrawal rate above 100% mean?
A rate above 100% means a country takes out more water than its internal renewable resources supply. The gap is filled by pumping non-renewable groundwater, by desalinating seawater, or by importing water from a neighbor. Our World in Data notes that several Middle East and North Africa countries have withdrawal rates well above 100% and that this can reflect unsustainable aquifer pumping or heavy dependence on desalination.
The headline is not that these countries are running dry tomorrow. A ratio above 100% tells you how close a country is to exceeding what the water cycle hands it, and what kind of workaround it uses. For a deeper look at the cycle that sets those limits, see how the water cycle works and how humans disrupt it.
Which countries rank worst
WRI's 2023 update names Bahrain, Cyprus, Kuwait, Lebanon, Oman, and Qatar as the most water-stressed countries. The surprise for many readers is Cyprus: a European Union member, but a small island with little river flow and heavy tourism demand. The Gulf states are less surprising, since the Arabian Peninsula has almost no perennial rivers.
The numbers beyond that headline list matter more than the order of the top few. WRI's regional figures show how unevenly stress is distributed.
| Measure | Figure | Source |
|---|---|---|
| Countries facing extremely high stress each year | 25 | WRI, August 2023 |
| Share of world population in those 25 countries | About one quarter | WRI, August 2023 |
| Population living under highly stressed conditions at least one month a year | At least 50% of the world, around 4 billion people | WRI, August 2023 |
| Middle East and North Africa population under extremely high stress | 83% | WRI, August 2023 |
| South Asia population under extremely high stress | 74% | WRI, August 2023 |
The last two rows are worth pausing on. Almost the whole population of the Middle East and North Africa, and three quarters of South Asia, live in places that already use at least 80% of their supply. These regions also have fast-growing cities and large irrigated farm sectors, so the pressure rises from both ends.
What the 2050 projections say
WRI's modeling projects that an additional 1 billion people will face extremely high stress by 2050. It projects global water demand to rise 20 to 25% over the same period.
The economic exposure is large. WRI estimates that 31% of global GDP, about $70 trillion, will be exposed to high water stress by 2050, up from 24% ($15 trillion) in 2010. India, Mexico, Egypt, and Turkey account for more than half of that exposed GDP. Separately, WRI cites the Global Commission on Adaptation in saying that failing to improve water management could cut GDP by 7% to 12% in India, China, and Central Asia by 2050. These are model projections, not forecasts, and they depend on assumptions about demand growth and climate pathways. For the climate side of the story, the climate-vulnerability ranking under Related Reading below covers the wider exposure picture.
Why a country-level ranking can mislead
A national average hides local reality. A country with a wet south and a dry north can look moderately stressed overall while its northern farmers and city dwellers are in crisis. WRI addresses this by building catchment-level data and then aggregating it to the country level with a weighting based on gross water demand, so the places where people use the most water count for more. The agency also says Aqueduct "remains primarily a prioritization tool" and should be supplemented by local assessments.
Three other effects distort rankings.
- Small states rank high easily. A tiny country with no rivers, such as Bahrain, has a small denominator, so even modest withdrawals look large as a share of supply.
- Desalination hides in the ratio. Desalinated seawater is not counted as renewable supply in the same way, so a country that gets most of its drinking water from the sea can post a very high ratio while its taps run reliably.
- Ratios ignore money. A rich country can buy its way out of stress. A poor country with a lower ratio can suffer more, because it lacks storage, pipes, and treatment plants.
This last point is why the global ranking of stress and the lived experience of shortage do not line up neatly. It is also why a country with huge natural endowments can still fail: comparing a ranking of freshwater resources with this ranking of stress shows how little the two overlap.
The Aral Sea: the clearest case of water mismanagement
The Aral Sea shows what happens when withdrawals exceed supply for decades. NASA's Earth Observatory describes it as once the fourth-largest lake in the world, shrunk after Soviet irrigation diversions began in the 1960s. The Amu Darya and Syr Darya rivers were redirected to irrigate cotton and other crops, and the Amu Darya no longer reaches the sea.
The timeline below combines NASA's description with figures compiled on Wikipedia from published studies.
| Year | What happened |
|---|---|
| 1960 | The sea covered about 68,000 km² and held roughly 1,100 km³ of water |
| 1987 | The lake split into the North Aral and South Aral seas |
| 1998 | The area had fallen to 28,687 km² and the lake ranked eighth in size |
| 2003 | The South Aral divided into eastern and western basins |
| 2005 | Kazakhstan completed the Kok-Aral dike and dam, separating the North from the South |
| 2007 | The sea had declined to about 10% of its original size, split into four lakes |
| 2014 | NASA satellite images showed the eastern basin had fully dried |
Sources: NASA Earth Observatory; Wikipedia: Aral Sea.
The human costs followed the water. At its peak, the fishing industry employed about 40,000 people and reportedly produced about one-sixth of the Soviet Union's catch. Rising salinity, from about 10 grams per liter originally to roughly 30 g/L by 1990, ended commercial fishing by 1987 and killed the flounder in the South Aral by the late 1990s. Exposed seabed became a source of salty, toxic dust that damages crops. In 2011, after visiting Muynak, UN Secretary-General Ban Ki-moon called the shrinkage "one of the planet's worst environmental disasters."
The story is not entirely one of loss. After the Kok-Aral dam was completed in 2005, the North Aral's level rose about 12 meters by 2008, salinity fell from about 30 g/L to about 8 g/L, and roughly 24 freshwater species returned, according to the Wikipedia summary of published studies. By 2013 fishing was viable again in the North. The South Aral has no comparable recovery path, and the lesson is stark: a small, well-targeted engineering fix worked for the part of the lake that had a river feeding it, and nothing worked where the river had been diverted. Most of the largest lakes on Earth have a river problem of some kind, as the ranking of the largest lakes in the world shows.
India: groundwater, monsoons, and Chennai's Day Zero
India is the largest of the big economies where stress is acute. WRI's 2023 analysis found that from 2017 to 2021, a lack of water to cool thermal power plants caused India to lose 8.2 terawatt-hours of electricity, enough to power 1.5 million households for five years. India is also one of the four countries, with Mexico, Egypt, and Turkey, that account for more than half of the GDP exposed to high water stress in 2050.
Several pressures stack on top of each other. Most of the country's annual rain falls in the June to September monsoon, so storage matters more than total volume. Wheat and rice, the staples of the Green Revolution, need irrigation in a semi-arid climate, and cheap farm electricity lowers the cost of pumping groundwater. NASA's GRACE satellite mission, which senses small changes in Earth's gravity as water moves, has been used to track aquifer loss across northern India. These are the same dynamics that appear in the broader explainer on water scarcity.
Chennai, June 2019
Chennai shows how a monsoon failure meets a weak water system. Officials declared "Day Zero" on June 19, 2019, when the four main reservoirs, with a combined capacity of 11,057 million cubic feet, had run dry. They held about 17% of normal storage from December 2018 to January 2019 and fell to roughly 0.1% by June.
The 2018 monsoon brought 343.7 millimeters of rain against an average of 757.6 mm, a 55% deficit, and the city had also seen failed monsoons in 2016 and 2017. Wikipedia's summary of the crisis, drawing on news and government reports, lists contributing factors that had little to do with rain: unplanned construction that reduced inflow to reservoirs, sewage pollution of surface water that pushed reliance onto groundwater, and unregulated groundwater extraction estimated at 200 million liters a day, about twice the annual recharge rate.
The social side was unequal. Wealthier families and businesses bought private tankers, while a family in a slum might receive about 30 liters a day. The city's roughly 11.2 million residents had no tap water on Day Zero. Chennai had no shortage of people with a legal right to water. It had a shortage of storage, pricing, and enforcement.
Cape Town's Day Zero: what a managed crisis looks like
Cape Town offers the best-documented example of a large city avoiding the worst outcome. Day Zero was the point at which major dam storage would fall to 13.5% and the city would shut off most household taps. Projections first placed it on April 22, 2018, then moved it to April 12, 2018, before the city pushed it back in stages and, on June 28, 2018, postponed it indefinitely.
The drought was severe by the record. Wikipedia's summary notes that 2017 rainfall was the lowest since records began in 1933. Dam storage on about May 15 of each year tells the story.
| Year (mid-May) | Dam storage, % of capacity |
|---|---|
| 2014 | 71.9 |
| 2015 | 50.1 |
| 2016 | 31.2 |
| 2017 | 21.2 |
| 2018 | 21.4 |
| 2019 | 45.9 |
| 2020 | 53.6 |
| 2021 | 69.8 |
Source: figures compiled from City of Cape Town data on Wikipedia: Cape Town water crisis. Dam levels peaked at 76% after the 2018 winter rains.
How consumption fell
The city tightened restrictions in steps. Level 4 (June 1, 2017) set a limit of 100 liters per person per day. Level 6 (January 1, 2018) set 87 liters, and Level 6B (February 2018) set 50 liters. Households that exceeded the limit faced fines of 500 to 3,000 rand, and non-compliant homes could be fitted with a device capping use at 350 liters a day. Day Zero rationing was planned at collection points with 25 liters per person.
Average demand fell about 45% between February 2017 and February 2018. Total city use fell by more than half to about 500 million liters per day in March 2018, and agriculture cut its own use by 60%. The planned supply projects, including temporary desalination plants, a reservoir, and an aquifer scheme, were designed to add about 144 million liters a day, but the city later abandoned some desalination plans because unit costs were too high.
Two lessons stand out. First, a credible deadline changed behavior faster than price signals alone. Second, the city could not count on engineering to arrive in time, so the sharpest reductions came from households and farms. Rain, not infrastructure, ended the emergency, and the city's long-term resilience depends on diversifying its sources.
Other places where stress shows up as physical damage
Stress sometimes announces itself in the ground.
- Mexico City. The city sits on a former lakebed, and overpumping of groundwater from the clay has made parts of it sink. Wikipedia reports that some areas have dropped as much as nine meters since the early 20th century and that the city continues to sink almost 50 centimeters in some places each year.
- The Colorado River basin. The river's unimpaired annual runoff at Lees Ferry, Arizona, is estimated at 14.7 million acre-feet (about 18.1 km³) for 1906 to 2023, and about 40 million people live in areas supplied by its water, per Wikipedia. That is a large claim on a river whose flow has been the subject of repeated allocation disputes among US states and with Mexico.
- Saudi Arabia. The country built a wheat program in the 1970s and 1980s that drew mainly on non-renewable aquifers, and it became self-sufficient in wheat by 1984. As of 2016, domestic wheat production ended, according to the Wikipedia article on Saudi agriculture, which cites trade press. The change is a rare case of a government reversing a policy specifically to protect groundwater.
The Saudi reversal illustrates "virtual water": the water embedded in traded goods. A country that imports wheat is, in effect, importing the irrigation water used to grow it. Virtual water trade lets water-poor countries meet food needs without draining local aquifers, though it exposes them to world grain prices and export bans.
Israel and the Gulf: stress managed by technology
Israel and the Gulf states sit among the most stressed countries by ratio, yet their taps work. The explanation is capital and energy. Seawater desalination, wastewater reuse, and strict pricing let them decouple urban water security from rainfall.
The Wikipedia summary of Israeli water supply, citing government and company data, reports that desalination produced 86% of Israel's drinking water in 2022, up from roughly 35% in 2014. Its seven large plants had a combined capacity of about 808 million cubic meters a year, by the summary's table, which includes the Soreq 2 plant that opened in March 2025 at 200 million m³ a year. Almost 90% of the nation's wastewater effluent is processed for reuse in agriculture, and in 2010 reused water covered about 40% of farm use. Annual withdrawals from the Sea of Galilee fell from 513 million m³ in 2001-02 to 25 million m³ in 2018-19 as desalinated water replaced them.
| Item | Figure | Source |
|---|---|---|
| Global desalination capacity, 2020 | About 97 million m³/day from over 16,800 plants | Wikipedia: Desalination |
| Energy use of seawater desalination, 2018 | About 3 kWh/m³ (theoretical minimum about 1 kWh/m³) | Wikipedia: Desalination |
| Typical cost, 2013 | US$0.45 to 1.00 per m³ | Wikipedia: Desalination |
| Israeli plants, 2014 | Under US$0.40 per m³ | Wikipedia: Desalination |
| Largest plant | Ras Al-Khair, Saudi Arabia, 1,401,000 m³/day | Wikipedia: Desalination |
| Global brine discharge | Around 142 million m³/day, more than freshwater output | Wikipedia: Desalination |
Desalination is not a free fix. It takes a lot of energy, and the salty by-product has to go somewhere. The brine figure above exceeds freshwater production because every liter of seawater yields less than a liter of drinking water, and the leftover is more concentrated. For a detailed explanation of where the energy goes, see why desalination uses so much energy. It also works only for coastal places with cheap power. Inland farming regions cannot afford to desalinate water for crops, and that is where most of the world's water is used. Our World in Data puts agriculture at about 70% of global freshwater withdrawals.
Why governance matters as much as geography
Look at the examples side by side. Israel has a ratio that places it among the stressed countries, but it invested in desalination, treatment, and pricing. The Aral Sea region had large rivers and still lost its lake, because planners allocated almost all the flow to cotton. Chennai had a monsoon-fed supply and a large population but let reservoirs, groundwater rules, and sewage treatment slip. Cape Town had drought and a deadline, and acted.
None of this says geography is irrelevant. A country with almost no rain and no rivers faces higher costs for the same level of security, and those costs fall hardest on poor countries. But the examples support a narrower claim: the same ratio can produce very different outcomes depending on pricing, storage, enforcement, and cooperation over shared rivers. Digital tools can help on the margin by finding leaks and tuning irrigation, as described in the pieces on AI and water conservation, though they do not substitute for allocation decisions.
Glaciers are another factor that rankings built on today's flows do not capture well. Meltwater buffers dry-season rivers across South and Central Asia, and the retreat of ice changes the timing of that supply. See how glaciers form and move for the mechanics.
Common misconceptions about water stress rankings
"The top of the list is about to run out of water." Not in the sense most people mean. Kuwait, Qatar, and Bahrain have reliable taps because they convert seawater into drinking water. The ratio tells you how far a country sits beyond its natural supply, not whether households have water this week.
"A water-rich country cannot be stressed." Stress depends on demand as much as supply. A country with large rivers can still withdraw most of the flow in its dry basins, and national averages blur those basins together. The Aral Sea basin drew on two large rivers and still lost its lake.
"Stress is a future problem." The WRI figures describe current conditions: 25 countries already use at least 80% of their supply in a typical year, and about 4 billion people already live with high stress for at least one month annually. The 2050 numbers describe growth on top of that baseline.
"One ranking settles it." Aqueduct, FAO, and the UN indicator use different thresholds, different supply definitions, and different years. When two lists disagree about a country, the disagreement is usually in the method, so check the definition before quoting a rank.
"Technology will fix it everywhere." Desalination, drip irrigation, and reuse have worked where the money, energy, and institutions exist. They are less useful for the largest water user of all, irrigated agriculture, which accounts for about 70% of global withdrawals according to Our World in Data, and they do nothing for a river basin whose problem is that three or four jurisdictions share the same flow and none will cut first.
Frequently asked questions
Q: What is the difference between water stress and water scarcity? A: Water stress is a ratio of demand to renewable supply, while scarcity usually refers to a shortage of water per person or a failure to meet needs. The Falkenmark indicator, for example, treats less than 1,700 cubic meters per person per year as stress and less than 1,000 as scarcity. A country can be highly stressed by ratio and still supply its people reliably if it desalinates or reuses water.
Q: Which country is the most water stressed? A: It depends on the dataset and year. In WRI's Aqueduct 4.0 update of August 2023, the most stressed countries were Bahrain, Cyprus, Kuwait, Lebanon, Oman, and Qatar. Other agencies using the UN's SDG 6.4.2 indicator rank countries differently, and national averages can hide severe local shortages.
Q: How many people live with water stress? A: WRI estimates that at least half the world's population, around 4 billion people, live under highly water-stressed conditions for at least one month a year. About one quarter of humanity lives in the 25 countries with extremely high stress year-round. The UN's 2025 SDG report gives a similar picture: about half the world's population experiences severe water scarcity for at least part of the year.
Q: Can desalination solve water scarcity? A: For coastal cities with cheap energy, largely yes. Israel gets most of its drinking water from desalination, and the Gulf states depend on it. But energy use of about 3 kWh per cubic meter, brine disposal, and cost limit it for inland and agricultural uses, which account for about 70% of global withdrawals.
Q: Will countries go to war over water? A: Disputes are real, for example over the Nile, the Indus, and Central Asia's rivers, but evidence for outright interstate war is thin. Water more often acts as a multiplier of existing tensions and a driver of internal unrest, such as protests during Chennai's 2019 shortage, which saw at least 550 arrests in a single day.
Q: What is virtual water? A: Virtual water is the water used to produce a traded good. When a country imports wheat instead of growing it, it imports the irrigation water that would have been needed. Saudi Arabia ended domestic wheat production as of 2016 partly to preserve aquifers.
Q: Why did Cape Town avoid Day Zero? A: A combination of steep restrictions (down to 50 liters per person per day), a roughly 45% fall in average demand over a year, agricultural cuts of 60%, and good winter rains in 2018 that pushed dam levels to a peak of 76%. The city postponed Day Zero indefinitely on June 28, 2018.
The takeaway
Water stress is a ratio, and ratios are blunt. The 25 countries WRI places in the extremely high category are not all in the same trouble, because Israel and Qatar buy security with energy and capital while Chennai and the Aral Sea region lost theirs through weak management. The most useful reading of any ranking is as a map of where margin is thin: a small shock, such as a failed monsoon, a dry decade, or a new demand, can tip a system that has no slack. Countries and cities that treat water as a priced, measured, and shared resource tend to turn stress into a managed cost. Those that treat it as free until it runs out tend to meet it as an emergency.
Sources
- World Resources Institute, "25 Countries, Housing One-Quarter of the Population, Face Extremely High Water Stress" (August 16, 2023; page updated January 2026).
- World Resources Institute, "Aqueduct 4.0 Country Rankings" (methodology and data download).
- NASA Earth Observatory, "Aral Sea."
- Our World in Data, "Water Use and Stress," citing FAO and UN-Water SDG 6.4.2.
- United Nations, "Sustainable Development Goal 6," water stress indicator figures.
Related Reading
Follow new articles
Add SciHub101 to your feed reader to see new science and technology stories.
About the Author
SciHub101 is an independent science and technology publication founded and edited by Buğra Sözeri, a software engineer and app developer based in Türkiye. AI tools assist with drafting and research. Source documentation in the existing archive is uneven, and articles are being reviewed and corrected. The Editorial Team byline identifies editorial responsibility; it does not certify specialist or independent human review. Where we compare products, anything built by our own team is labelled as such — see the editorial guidelines and About page for how corrections and disclosures work.
Related Articles

Countries with the Highest Population Density (2025 Ranked)
Monaco packs about 18,500 people into each square kilometre of land, Singapore about 8,300 and Bangladesh about 1,330 — the densest country of any real size. World Bank 2024 data, ranked two ways, with what density does and does not tell you.
Countries Most Vulnerable to Climate Change (2025 Ranked)
Somalia, Chad, and Sudan top the Global Climate Risk Index. Small island nations like Tuvalu and Kiribati face complete disappearance beneath rising seas. Bangladesh could lose 17% of its land by 2050. Here's which countries face the greatest climate threat — and the cruel injustice that those most at risk contributed almost nothing to causing the crisis.
How Climate Change Is Affecting Your Daily Life
Climate change is not a future event that will arrive later. It is already changing the price of your coffee, the length of your allergy season, the cost of your home insurance, the availability of water in your tap, and the heat outside your window. The effects are measurable, attributed to specific climate mechanisms by peer-reviewed science, and accumulating across every aspect of daily life in 2026. This article maps the concrete pathways — with numbers — from global warming to your daily experience.
Countries with the Most Freshwater Resources (Ranked)
Brazil has the world's largest total renewable freshwater resources — approximately 8,647 cubic kilometers per year, more than any other country and roughly 20 percent of the global total. Russia is second at 4,525 km³/year, Canada third at 2,860 km³/year. But total volume is only part of the story: Canada's per-capita freshwater availability is 36 times higher than China's. And water stress — not total availability — is the defining water challenge of the twenty-first century. This ranking covers the top 20 countries by total renewable freshwater resources, sourced from FAO AQUASTAT, with per-capita comparison and analysis of global water scarcity.
Countries with the Most Freshwater Lakes in the World
No single list ranks countries by lake count, because the answer depends on how small a pond you are willing to call a lake. Here is what the national surveys and satellite inventories actually say, and which lakes hold the most water.
Complete Sustainability Guide 2026 — Climate, Energy, and Conservation
The complete guide to sustainability in 2026: renewable energy, climate science, circular economy, conservation strategies, and actionable steps to reduce your impact.