How Climate Change Is Affecting Your Daily Life
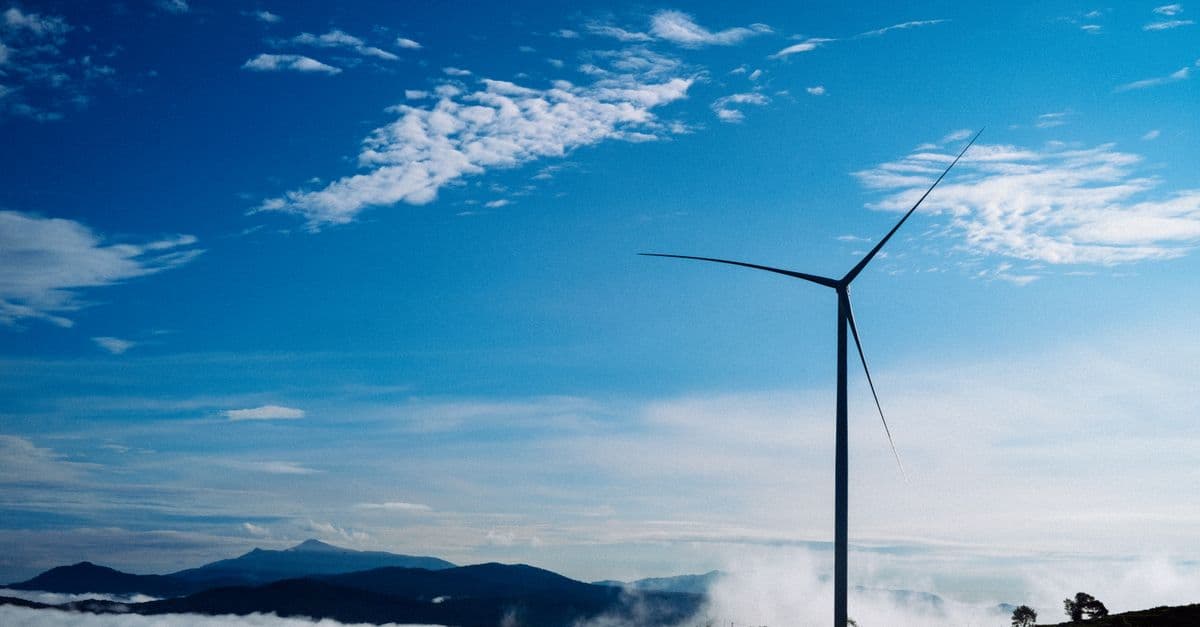
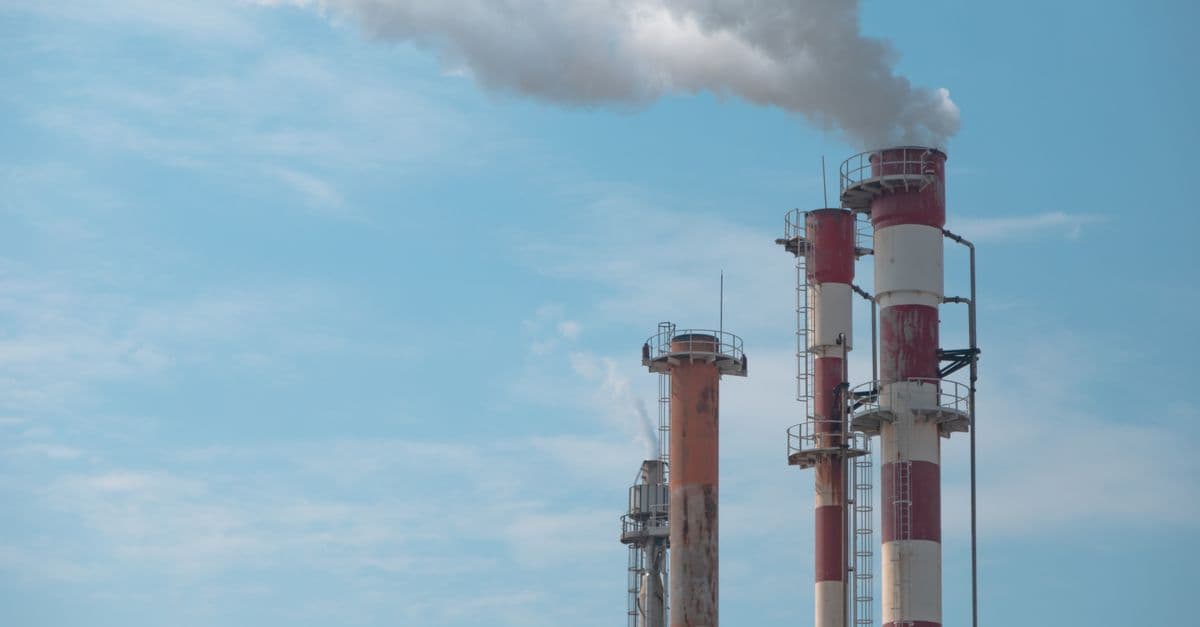
Photo: Khoa Võ / Pexels
The global average surface temperature has risen approximately 1.2°C above the pre-industrial average, according to the World Meteorological Organization's 2023 State of the Global Climate report. That figure sounds abstract. What it means, concretely, is that a drought that would have occurred once every decade under pre-industrial conditions now occurs once every six years. A heat wave that would have been a 1-in-50-year event now arrives once a decade. These changes in probability translate directly into grocery prices, insurance premiums, allergy calendars, municipal water supplies, and the temperature on your street. This article traces those pathways from atmospheric physics to daily experience, with the evidence behind each one.
Attribution Science: How We Know Which Effects Are Climate-Caused
Before tracing specific daily impacts, it helps to understand how scientists determine that a particular event or trend is attributable to climate change rather than natural variability. This field — called extreme event attribution — has developed substantially since roughly 2004 and is now a routine part of post-event climate analysis.
Extreme event attribution — a methodology that uses climate model ensembles to compare the probability of a specific weather event (a heat wave, a drought, a flood) in the actual climate (with human-caused warming) versus a counterfactual climate (without human greenhouse gas emissions). By running thousands of model simulations of both worlds, researchers can estimate how much more (or less) likely the event was due to climate change.
The basic logic is similar to epidemiology: you cannot say smoking caused a specific individual's lung cancer, but you can say smoking increased the probability by a factor of X. Similarly, attribution science cannot say climate change "caused" a specific drought, but it can say the drought was made two or three times more likely by human emissions, with quantified uncertainty.
Attribution studies have been published for hundreds of specific events. The 2021 Pacific Northwest heat dome — which pushed temperatures in Portland, Oregon to 46.7°C (116.1°F), a figure that killed hundreds — was found by a rapid attribution study (World Weather Attribution, 2021) to have been "virtually impossible" without human-induced climate change. The 2022 Pakistan floods that displaced 33 million people were found to be made significantly more severe by climate change.
This methodology matters for daily-life impacts because it moves climate change from background trend to identifiable cause of specific prices, events, and costs.
Source: World Weather Attribution (2021), "Western North America extreme heat virtually impossible without human-caused climate change" — rapid attribution analysis of the 2021 Pacific Northwest heat dome; probability ratio calculation.
Source: James, R. et al. (2022), in Nature Climate Change — Attributions for extreme weather events: methodology overview and validation across published event attribution studies.
Food Prices: The Climate Premium You Pay at the Grocery Store
The connection between climate and food prices runs through a clear chain: extreme weather disrupts crop yields; reduced supply drives up prices. Attribution science can now quantify how much of specific price spikes are climate-attributable.
Coffee is a documented case. Brazil supplies approximately one-third of the world's coffee. A severe drought in 2023–2024 — of a type made more frequent by climate change — drove a 55% increase in the global market price of coffee in August 2024 compared to the prior year. Cocoa prices in April 2024 were 280% higher than a year earlier, following a heat wave and drought in Ghana and the Ivory Coast — the world's two largest cocoa producers — that damaged harvests. A single heat wave, in a single season, nearly tripled the global price of cocoa.
These are not isolated anecdotes. A 2023 study in Nature Food quantified the average inflationary effect of climate change across food prices and found that by 2035, climate change could add approximately 1–3 percentage points annually to food price inflation in addition to baseline economic inflation. The effect is already measurable: warming temperature trends across the contiguous US accounted for 19% of national crop insurance losses from 1991 to 2017, according to data analyzed by Climate Central.
The mechanism operates across multiple pathways simultaneously. Higher temperatures increase crop water stress. Changes in rainfall timing affect planting and harvest windows. Increased frequency of late frosts (a paradoxical result of a more volatile jet stream) damages tree fruit crops like apples, cherries, and almonds. Rising sea temperatures affect fisheries. More intense hurricanes flood crops and damage supply chain infrastructure in production regions.
Wet-bulb temperature — a measure of heat stress that accounts for both temperature and humidity. At a wet-bulb temperature of 35°C (roughly equivalent to 35°C at 100% humidity, or higher temperatures at lower humidity), the human body cannot cool itself through sweating even in the shade. At and above this threshold, unshaded outdoor physical labor becomes physiologically dangerous regardless of fitness. Humid tropical farming regions are approaching these limits with increasing frequency, threatening agricultural labor capacity in major food production zones.
Source: Climate Central (2025), "Climate Change and Food Prices" — warming temperature contribution to US crop insurance losses 1991–2017; coffee and cocoa price attribution case studies.
Source: Kotz, M. et al. (2024), "The economic commitment of climate change," Nature — quantification of economic costs locked in by current emissions trajectories, including agricultural productivity effects.
Allergy Seasons: Longer, Earlier, More Intense
If your allergies have seemed worse over the past decade, the observation is consistent with documented trends. Pollen seasons in North America and Europe are starting earlier in the year, lasting longer, and producing higher pollen concentrations than historical baselines.
The mechanism is straightforward: pollen seasons are triggered and shaped by temperature. Warming winters and earlier springs advance the date at which trees and grasses bloom. A 2021 study published in PNAS by Anderegg et al., analyzing 60 years of pollen data from 60 North American stations, found that pollen seasons have lengthened by an average of 20 days since 1990, with pollen concentrations increasing by approximately 21% over the same period. These changes were attributable primarily to climate-driven temperature trends rather than land use changes.
The Asthma and Allergy Foundation of America's 2026 "Allergy Capitals" report noted that climate effects — particularly wet winters followed by warm early springs generating heavy pollen loads — drove unusual allergy severity in multiple US cities. Boise, Idaho reached the top of the ranking in 2025 partly because a wet winter accelerated plant growth and an early warm spring produced an unusually dense pollen season.
Hay fever (allergic rhinitis) affects between 10% and 30% of the global population and imposes an estimated $18 billion in direct and indirect economic costs annually in the US alone, including healthcare costs, lost productivity, and reduced quality of life. A longer, more intense pollen season shifts those costs upward.
The health dimension extends beyond discomfort. Allergic sensitization in childhood — the period when the immune system learns what to react to — is shaped by the environment during that period. More pollen, more mold (which also increases with warming and wet conditions), and higher concentrations of outdoor air pollutants (which exacerbate allergic responses) during childhood increases the probability of developing persistent allergic disease.
Source: Anderegg, W.R.L. et al. (2021), "Anthropogenic climate change is worsening North American pollen seasons," PNAS, Vol. 118 — 60-year pollen trend analysis from 60 stations; 20-day season extension and 21% concentration increase attributed to climate warming.
Source: Asthma and Allergy Foundation of America (2026), "Allergy Capitals Report 2026: Effects of Climate Change" — annual ranking of US cities by allergy severity, with climate attribution analysis.
Home Insurance: When the Market Reprices Risk
The home insurance market is responding to climate risk in ways that directly affect household budgets. US homeowners spent $21 billion more on homeowners insurance in 2024 than in 2021 — a three-year increase that outpaced both general inflation and wage growth. Climate change is one of several factors driving this, alongside rising construction costs and increased development in hazard-prone areas.
The clearest example is California. State Farm — the country's largest property insurer — halted all new homeowners' policies in California in May 2023, citing wildfire risk and inflation. Following the January 2025 Eaton and Palisades fires, which caused tens of billions of dollars in insured losses, State Farm filed for a 22% emergency rate increase and was approved for a 17% increase. The company is seeking a further increase to 30% — which, if approved, would represent an average annual premium increase of approximately $600 for California homeowners.
Florida has struggled with insurance market stability for different reasons: hurricane frequency and intensity, plus coastal flooding risk. Citizens Property Insurance Corporation — Florida's insurer of last resort — holds more than 1.3 million policies, an indication of how many homeowners cannot obtain private coverage at market rates. An estimated one in five Florida homeowners may be uninsured, a figure that implies a significant population bearing climate financial risk without a buffer.
The insurance market shift matters beyond individual premiums because of what it signals about property valuation. When insurers withdraw from a market or impose rates that make insurance unaffordable, it raises questions about long-term property values in those areas. Economists are beginning to study "climate gentrification" — the hypothesis that as coastal and fire-prone areas become more expensive to insure and maintain, property values in those areas may shift, with second-order effects on municipal tax bases, school funding, and community stability.
Source: Insurance.com (2026), "The State of Home Insurance in 2026: Increasing Rates, Climate Change, and Consumer Frustration" — $21 billion premium increase 2021–2024; State Farm California withdrawal and rate increase filings.
Source: Yale Law Journal (2024), "The Uninsurable Future: The Climate Threat to Property Insurance" — analysis of climate risk repricing in insurance markets and its implications for housing and property values.
Extreme Heat: What Urban Heat Actually Feels Like
Global average temperature rise of 1.2°C translates to local temperatures significantly higher than that average in heat waves, particularly in urban areas. Cities are typically 2–5°C warmer than surrounding rural areas due to the urban heat island effect — the replacement of vegetation and permeable surfaces with concrete, asphalt, and dark rooftops that absorb and retain heat.
Urban heat island effect — the phenomenon where urban areas experience higher temperatures than surrounding rural areas, due to reduced vegetation, impervious heat-absorbing surfaces, waste heat from vehicles and buildings, and reduced evaporative cooling. The effect amplifies baseline warming, so a 1°C rise in regional average temperature can produce a 2–3°C rise in peak urban temperatures.
Heat is now the leading weather-related cause of death in the United States, killing an estimated 1,300 people per year — a figure widely considered an undercount because heat-related deaths are often recorded as cardiovascular or respiratory events rather than direct heat fatalities. The 2003 European heat wave, which has been attributed in part to climate change, killed approximately 70,000 people. The 2021 Pacific Northwest heat dome killed more than 1,000 people in Canada and the US over a four-day period.
For people without air conditioning — a group that includes a significant fraction of lower-income households and the elderly in both wealthy and developing countries — extreme heat represents a direct health threat. For those with air conditioning, it represents rising energy costs: a 2023 analysis found that cooling-related electricity demand increases approximately 1–3% for each degree Celsius of warming, and that this effect falls disproportionately on lower-income households that spend a larger share of income on energy.
Heat also affects cognitive performance. A 2018 study in PLOS Medicine found that the probability of getting a quality night's sleep (sleep duration above 7 hours) fell measurably as nighttime temperatures rose above historical norms, and that sleep loss was more severe for lower-income households (less air conditioning access) and for older adults. The educational and occupational consequences of chronic heat-related sleep disruption at population scale are not yet fully quantified.
Source: World Meteorological Organization (2024), "State of the Global Climate 2023" — 1.2°C warming above pre-industrial average; heat wave frequency and intensity trends.
Source: Obradovich, N. et al. (2017), "Nighttime temperature and human sleep loss in a changing climate," Science Advances — population-level analysis of heat-disrupted sleep; differential effect by income and age.
Water: Availability, Quality, and Cost
Freshwater availability is shifting in ways that affect municipal water supplies, agriculture, and — for a growing fraction of the global population — direct access to safe drinking water.
The pattern is often described as "wet regions getting wetter and dry regions getting drier," and while this simplifies the actual geographic complexity, the directional trends are well-documented. The American West — already arid — has experienced a decades-long aridification trend driven partly by reduced snowpack, earlier snowmelt, and increased evaporation rates. The Colorado River, which supplies water to approximately 40 million people across seven US states and Mexico, has been in formal shortage declaration status since August 2021. Lake Mead, the river's primary reservoir, dropped to historically low levels in 2022.
Aridification — a long-term shift toward drier conditions in a region, distinct from a temporary drought. Aridification involves persistent decreases in soil moisture, groundwater recharge, and river flow due to climate-driven changes in precipitation patterns and increased evapotranspiration from higher temperatures.
In contrast, heavy precipitation events are intensifying in many regions. The atmosphere holds approximately 7% more water vapor for every 1°C of warming (Clausius-Clapeyron relationship), which loads storms with more available moisture. This produces heavier rainfall events that cause flooding but — paradoxically — may not increase total annual precipitation, because more rain falls in shorter, more intense bursts that generate runoff rather than groundwater recharge.
Municipal water rates have been rising faster than general inflation in most US cities. An analysis by the Pacific Institute found that average residential water bills in the US increased 27% between 2012 and 2019, and the rate of increase has continued since. While not all of this is climate-attributable — aging infrastructure and regulatory compliance also contribute — climate-related factors (increased treatment costs for degraded source water, reduced yield from drought-stressed sources, infrastructure damage from flooding) are contributing factors in many systems.
For households, the daily consequence is higher water bills and, in some regions, periodic restrictions on outdoor watering, car washing, or irrigation. For farmers — who represent approximately 80% of US freshwater withdrawals — the consequences are more severe: reduced allocations, higher pumping costs as water tables drop, and in some regions, the physical unavailability of water regardless of price.
Source: US Bureau of Reclamation (2021), "Colorado River System Shortage Declaration" — first-ever formal shortage declaration; Lake Mead level data and downstream allocation reduction schedule.
Source: Pacific Institute (2019), "The Water Rate Survey" — US residential water rate increases 2012–2019; municipal water cost trends by region.
Regional Variation: Where Daily Effects Are Felt Most
Climate change impacts are not uniformly distributed. Geography, infrastructure, and socioeconomic context shape who experiences the daily effects most severely.
| Region | Primary Current Impacts | Climate Driver |
|---|---|---|
| US Southwest and West | Water scarcity, wildfire, extreme heat, insurance market disruption | Aridification, drought, temperature rise |
| US Gulf and Southeast Coast | Hurricane intensity, flooding, insurance withdrawal | Sea surface temperature warming, sea level rise |
| US Midwest | Shifting growing seasons, more intense precipitation, periodic drought | Temperature and precipitation pattern changes |
| Europe | Heat waves, southern drought, northern flooding | Jet stream instability; Mediterranean aridification |
| South and Southeast Asia | Monsoon variability, extreme heat, cyclone intensification | Ocean warming, atmospheric moisture loading |
| Sub-Saharan Africa | Agricultural drought, food insecurity, water scarcity | Temperature amplification; precipitation shifts |
| Small Island States | Sea level rise, freshwater lens salinization, coral reef loss | Ocean warming; sea level |
The populations most exposed to daily climate impacts are typically not those most responsible for historical emissions. Per capita emissions in sub-Saharan Africa and South Asia are a fraction of per capita emissions in North America and Europe, yet the daily life disruptions from climate change — crop failures, extreme heat, cyclone damage — fall disproportionately on those populations. This distributional inequity is one of the central arguments in international climate negotiations.
Source: IPCC (2022), "Climate Change 2022: Impacts, Adaptation and Vulnerability" (Working Group II) — regional vulnerability assessment, documentation of differential exposure to climate impacts by geography and socioeconomic status.
What the Attribution Science Means for How to Think About This
A common response to individual climate impacts — a drought, a heat wave, a flood — is: "but this kind of thing has always happened." This is true. Droughts, heat waves, and floods are natural phenomena that predate industrial civilization. What attribution science establishes is that the probability of many extreme events has increased, and in some cases increased substantially.
The practical meaning: if you are paying more for coffee, or managing a worse allergy season, or seeing your home insurance premium increase, climate change is one contributing factor among several — but in many cases a quantifiable one. The 55% coffee price spike traced to a Brazilian drought, the 20-day extension of the North American pollen season, the $21 billion increase in US homeowner premiums — these have climate contributions that can be estimated with bounded uncertainty, not just asserted.
Climate change does not replace natural variability; it changes the background probabilities against which natural variability operates. A useful analogy: a baseball player on steroids will still make natural hits and natural outs. But the home run rate will be higher because the background capability has shifted. Attribution science measures the shift in the distribution, not individual events.
The practical implication is that adaptation — adjusting daily and institutional behavior to account for a changed risk environment — is not a future contingency. It is the present situation. Choosing housing locations, irrigation practices, crop types, building materials, and insurance coverage all now operate against a background probability distribution that is measurably different from 30 years ago.
Source: Otto, F.E.L. (2023), "Climate change and weather extremes," Nature Reviews Earth and Environment — methodological overview of extreme event attribution; summary of key findings from published attribution studies.
Frequently Asked Questions
Q: Is climate change already affecting everyday life, or is this mostly future projections?
A: Both past and ongoing. The 1.2°C of warming already delivered has already measurably affected pollen seasons, food prices through weather disruption, insurance markets, water availability in drought-prone regions, and the frequency and intensity of heat waves. Scientific literature documents these present-tense effects with quantified attribution to climate change, separate from projections of future impacts.
Q: How does climate change affect food prices specifically?
A: Through disruption of crop yields by extreme weather events (drought, heat waves, floods, frost) that are made more frequent or severe by warming. Specific examples: a Brazilian drought drove a 55% coffee price increase in 2024; a West African heat wave drove cocoa prices 280% higher. Temperature trends have accounted for 19% of US crop insurance losses since 1991. As climate change intensifies, these disruptions accumulate.
Q: Why are home insurance premiums rising because of climate change?
A: Insurers price risk based on the probability and severity of claims. Wildfire risk, hurricane intensity, and coastal flooding risk have all increased with warming. When expected claims rise, premiums rise. In high-risk markets like California and coastal Florida, some major insurers have stopped writing new policies rather than price risk they consider uninsurable at market rates.
Q: How does climate change make allergies worse?
A: Warmer springs advance the start of pollen season; warmer autumns delay its end. North American pollen seasons have lengthened by an average of 20 days since 1990, with pollen concentrations up approximately 21%. Higher CO₂ concentrations also increase the pollen productivity of some plants, adding to total airborne pollen loads independently of temperature effects.
Q: Does climate change affect water availability?
A: Yes, through multiple mechanisms depending on region. In the American West, reduced snowpack and earlier melt reduce summer river flow; the Colorado River has been in shortage declaration since 2021. In many regions, heavy precipitation events intensify while total annual precipitation stays flat or decreases, reducing groundwater recharge. In coastal areas, rising seas push saltwater into freshwater aquifers.
Q: What is extreme event attribution and why does it matter?
A: Extreme event attribution is a scientific methodology that estimates how much climate change altered the probability of a specific weather event. It uses climate model ensembles comparing the actual (warmed) climate with a counterfactual (pre-industrial) climate. It matters because it connects abstract global warming statistics to specific events people experience — converting "climate is warming" into "this drought was made twice as likely by human emissions."
Read next:
Follow new articles
Add SciHub101 to your feed reader to see new science and technology stories.
About the Author
SciHub101 is an independent science and technology publication founded and edited by Buğra Sözeri, a software engineer and app developer based in Türkiye. AI tools assist with drafting and research. Source documentation in the existing archive is uneven, and articles are being reviewed and corrected. The Editorial Team byline identifies editorial responsibility; it does not certify specialist or independent human review. Where we compare products, anything built by our own team is labelled as such — see the editorial guidelines and About page for how corrections and disclosures work.
Related Articles
How to Choose the Best Electric Vehicle in 2026: A Practical Guide to Range, Charging, Battery, Cost, and Use Cases
Choosing an electric vehicle in 2026 requires evaluating six factors: daily driving distance versus battery range (a mismatch makes ownership difficult), charging infrastructure availability in your region (home charging access is critical), total cost of ownership over five years (including electricity, maintenance, and depreciation), vehicle type and use case (SUV vs. sedan vs. truck), battery warranty and degradation expectations, and BEV (battery electric) versus PHEV (plug-in hybrid) tradeoffs. A 200-mile-range EV costs $35,000–$55,000 and can operate in virtually any climate with proper charging planning; a 300+ mile range vehicle adds $5,000–$15,000 but eliminates range anxiety. This guide walks through the practical evaluation framework and provides a comparison table of 2026 models across five vehicle categories.
Fast Fashion's Environmental Cost and What to Do About It
The fashion industry produces 92 million tonnes of textile waste per year, consumes 215 trillion liters of water annually, and is responsible for roughly 10% of global carbon emissions — more than international aviation and maritime shipping combined. These figures are real, but the solutions marketed in response often are not. This article walks through the actual environmental mechanisms behind fast fashion, what the evidence says about effective individual and systemic responses, and how to tell genuine impact from greenwashing.
Countries Facing the Worst Freshwater Stress (2025 Ranked)
Bahrain, Kuwait, and Qatar use more freshwater than naturally renews — among 17 countries in 'extremely high' water stress. The global water crisis will displace more people than climate change by 2050 according to World Bank projections. Cape Town nearly ran out of water in 2018. Here's who faces the worst water scarcity and what it means.
Complete Sustainability Guide 2026 — Climate, Energy, and Conservation
The complete guide to sustainability in 2026: renewable energy, climate science, circular economy, conservation strategies, and actionable steps to reduce your impact.

Countries with the Most Freshwater Resources (Ranked)
Brazil has the world's largest total renewable freshwater resources — approximately 8,647 cubic kilometers per year, more than any other country and roughly 20 percent of the global total. Russia is second at 4,525 km³/year, Canada third at 2,860 km³/year. But total volume is only part of the story: Canada's per-capita freshwater availability is 36 times higher than China's. And water stress — not total availability — is the defining water challenge of the twenty-first century. This ranking covers the top 20 countries by total renewable freshwater resources, sourced from FAO AQUASTAT, with per-capita comparison and analysis of global water scarcity.
Countries That Emit the Most CO2 (Ranked)
China emits 12.3 billion tonnes of CO2 per year — 32% of the global total — making it by far the world's largest emitter. The United States is second at 4.9 Gt, India third at roughly 3.4 Gt. Together the top three nations account for more than half of all fossil fuel CO2 emissions on Earth. Here is the full country ranking with methodology, per-capita figures, and historical context.