Countries with the Most Freshwater Lakes in the World
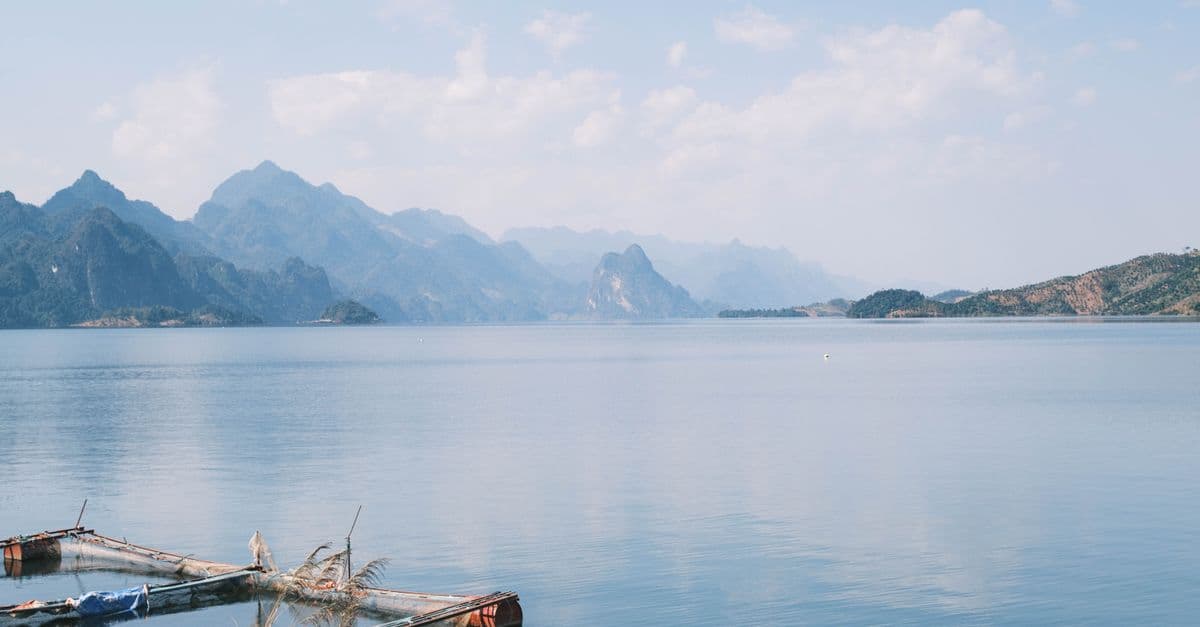
Photo: Đạt Nguyễn / Pexels
Canada has more lake area than any other country, and Statistics Canada counts 563 lakes larger than 100 km² within its borders. Yet if you ask which country has the most lakes, the honest answer changes with the size cutoff. Count every pond above one hectare (10,000 m²) and Sweden, with nearly 100,000, comfortably beats Finland's roughly 57,000, despite Finland's nickname. This article walks through the numbers, who produced them, why the rankings flip, and which lakes hold the water.
Key takeaways
- Satellite mapping counts about 117 million lakes worldwide down to 0.2 hectares, covering almost 4% of the surface outside the big ice sheets.
- Canada has more lake area than any other country, and an official Canadian source says it is covered by "as many as two million lakes."
- By count above one hectare, Sweden (nearly 100,000) leads Finland (about 57,000); the order reverses if you count tiny ponds.
- Lake Baikal in Russia holds about a fifth of the world's unfrozen freshwater, roughly as much water as all five Great Lakes together.
- A 2023 satellite study found 53% of 1,972 large lakes lost water between 1992 and 2020.
Why there is no clean ranking of lakes by country
Counting lakes sounds like counting coins. It is closer to counting grains of sand on a beach, because the number of lakes grows enormously as you shrink the minimum size you accept. A pond that one agency calls a lake is a puddle to another. Before any national total means anything, you need to know the threshold behind it.
The best global illustration comes from a team at Uppsala University in Sweden. Charles Verpoorter and colleagues mapped lakes from high-resolution satellite imagery and reported about 117 million lakes down to 0.2 hectares, covering almost 4% of the world's surface once the Greenland and Antarctic ice sheets are excluded (Uppsala University, 2014). The study, published in Geophysical Research Letters, excluded the Caspian Sea. The authors noted that earlier global estimates had scaled up local measurements and differed significantly from the satellite picture.
A second global dataset, HydroLAKES, takes a different cut. It maps about 1.4 million lakes and reservoirs of at least 10 hectares, with a combined surface area of 2.67 million km², a shoreline of 7.2 million km, and a storage volume of 181,900 km³ (HydroSHEDS). Same planet, same water, two very different headline counts: 117 million versus 1.4 million. Neither is wrong. They answer different questions.
| Dataset | Size threshold | Lakes counted | Source and year |
|---|---|---|---|
| GLOWABO (Verpoorter et al.) | 0.2 ha and larger | about 117 million | Uppsala University, 2014 |
| HydroLAKES (Messager et al.) | 10 ha and larger | about 1.4 million (lakes and reservoirs) | HydroSHEDS, 2016 |
| Sweden, national count | above 1 ha | nearly 100,000 | SMHI, accessed 2026 |
| Finland, national count | above 1 ha | about 57,000 | Finnish Environment Institute via vesi.fi, accessed 2026 |
The practical consequence is simple. When a ranking article lists a single number per country without naming the threshold, treat it as a rough indicator. When two countries have counts within a factor of two of each other, the ranking between them usually reflects surveying method more than geography.
Which countries lead, and by what yardstick
Different yardsticks crown different winners. The table below collects the figures that come from national statistics agencies, each with its size threshold. Russia and the United States are missing for a reason: we could not find a count from an official source with a stated threshold, and a number without a threshold would mislead more than it informs.
| Country or region | Figure | Threshold | Source |
|---|---|---|---|
| Canada | as many as 2 million lakes | not specified | Natural Resources Canada, via Open Canada |
| Canada | 563 lakes | larger than 100 km² | Statistics Canada, 2010 edition |
| Sweden | nearly 100,000 lakes | above 1 ha | SMHI |
| Sweden | 23 lakes | larger than 100 km² | SMHI |
| Finland | about 188,000 lakes (187,888) | 500 m² and larger | Finnish Environment Institute data, as summarized on Wikipedia |
| Finland | about 57,000 lakes | above 1 ha | Finnish Environment Institute via vesi.fi |
Canada's edge shows up most clearly in area. Statistics Canada states that the country has more lake area than any other, and that lakes and rivers together cover about 12% of its surface in the agency's 2010 tables (Statistics Canada). The Canadian government's open data portal says the country is covered by "as many as two million lakes" (Open Canada). The phrase "as many as" tells you how soft that number is: much of northern Canada has never been mapped lake by lake at fine resolution.
You will often read that Canada has more lakes than the rest of the world combined, or about 60% of all lakes. We could not trace either claim to a primary source, and the satellite inventories above do not support a clean percentage. Canada plainly leads on large lakes and on total lake area; the "more than everyone else together" formulation is folklore until someone publishes the arithmetic.
The Nordic comparison is the most instructive. Finland is called the Land of a Thousand Lakes, and Finnish data list about 188,000 lakes of 500 m² or more, of which roughly 57,000 exceed one hectare. Sweden's national count above one hectare is nearly 100,000 according to SMHI, the Swedish Meteorological and Hydrological Institute (SMHI). So by the one-hectare yardstick, Sweden has roughly 1.7 times as many lakes as Finland. Finland does win on the fraction of land under water, with lakes covering about one tenth of the country (Finnish Environment Institute, via vesi.fi). Lake density and lake count are different things, and Finland's reputation rests on density.
Totals for Finland vary with the cutoff: roughly 188,000 at 500 m², about 57,000 above one hectare, and only about 5,600 above ten hectares. Even the definition of a lake is not standardized, so expect different publications to quote different totals.
For a wider view of where fresh water sits in rivers, aquifers, and glaciers rather than in lakes alone, see Countries with the Most Freshwater Resources. That ranking measures renewable supply, which is a different question from how many basins happen to hold standing water.
How glaciers drilled the northern lake belt
The countries at the top of every lake list share a history: they were buried under ice. During the last glacial maximum, roughly 20,000 years ago, the Laurentide Ice Sheet covered most of Canada and parts of the northern United States, and the Fennoscandian ice sheet covered Finland, Sweden, and Norway. Ice in these sheets reached thicknesses of up to about three kilometers.
Think of a thumb pressed into memory foam. The foam dents under the weight, and when the thumb lifts, the surface rises back slowly. Glaciers did something similar to continents, and they added scouring on top. Moving ice acts like sandpaper on bedrock, grinding out basins wherever the rock was softer or more fractured. The Canadian Shield, a vast area of ancient hard rock, was stripped of its soil and left riddled with scraped hollows.
Retreating ice finished the job in several ways:
- Scoured basins filled with meltwater and rain once the ice was gone.
- Moraines, ridges of debris dumped at the glacier's edge, dammed valleys and trapped water behind them.
- Buried ice blocks left in sediment melted slowly and left behind round "kettle" lakes.
- Disrupted drainage: the ice scrambled river networks, and the young landscape has not yet cut new channels, so water pools in every low spot.
The land is still rebounding. Post-glacial uplift is typically about 1 cm per year or less, and it may continue for at least another 10,000 years. The rate is far from uniform and falls off with distance from the old ice centers. This slow rebound tilts basins and reroutes outflows, which is one reason lake shorelines in northern Canada and Fennoscandia shift over human timescales.
Glaciers are not the only lake makers. Rift valleys, where the crust is stretching apart, produce some of the deepest lakes on Earth, including Baikal in Siberia and Tanganyika in East Africa. Volcanoes make crater lakes. Rivers leave oxbow lakes when meanders are cut off, and thawing permafrost creates thermokarst lakes across the Arctic. Still, for sheer numbers, nothing beats a recently deglaciated landscape. If you want to see what a modern glacier does at the early stage of this process, How Glaciers Form and Move covers the mechanics.
Counting lakes versus counting water
A country can have a hundred thousand lakes and still hold little water. Finland's lakes hold approximately 235 km³ in total, and the average depth is only about seven meters (Finnish Environment Institute, via vesi.fi). That is a tiny fraction of what sits in a single Great Lake.
An analogy helps. Counting lakes is like counting the containers in a warehouse. A warehouse with 57,000 coffee cups has more containers than one with a single swimming pool, but the pool holds far more water. Lake volume depends on depth and area together, and the biggest volumes belong to a handful of enormous basins formed by rifting or by deep glacial scour.
| Lake or system | Area (km²) | Volume (km³) | Max depth (m) | Source |
|---|---|---|---|---|
| Lake Superior | 82,100 | 12,100 | 406 | US EPA |
| Lake Michigan | 57,800 | 4,920 | 282 | US EPA |
| Lake Huron | 59,600 | 3,540 | 229 | US EPA |
| Lake Ontario | 18,960 | 1,640 | 244 | US EPA |
| Lake Erie | 25,700 | 484 | 64 | US EPA |
| Great Lakes total | 244,160 | 22,684 | n/a | US EPA |
| Lake Baikal | about 31,500 | about 23,600 | about 1,640 | IUCN World Heritage Outlook |
The Great Lakes figures come from the US Environmental Protection Agency's table of physical features, with volumes at low water (US EPA). The Baikal row is approximate on purpose. IUCN gives the site's area as 3.15 million hectares (31,500 km²), a detailed-assessment depth of 1,638 m (its summary rounds to 1,700 m), and a volume of about 23,600 km³, slightly more than the Great Lakes combined.
Notice the last column of the Great Lakes rows too. Lake Superior alone holds about 12,100 km³, more than the other four lakes put together (which total about 10,584 km³). That is easy to miss when people say "the Great Lakes" as one blob.
Lake Baikal: the single basin that rivals a whole lake system
Baikal sits in a continental rift in southern Siberia, where the crust has been pulling apart for tens of millions of years. IUCN's World Heritage Outlook gives its age as 25 million years in the summary and "more than 20 million years" in the full assessment, which makes it the oldest lake on Earth by most accounts. It was inscribed as a UNESCO World Heritage Site in 1996 and holds about 20% of the world's unfrozen freshwater reserve (IUCN World Heritage Outlook).
Think of a rift lake as a crack in a plate that has been slowly widening and filling with water. Because the crack keeps deepening as it opens, sediment and water accumulate in a very deep narrow trough. That is why Baikal's depth, around 1.6 kilometers, dwarfs the 406 m maximum depth of Lake Superior even though Superior covers more than twice the area.
Baikal is also a biodiversity vault. IUCN records at least 2,640 animal species, about 56% of them endemic (found nowhere else), and about 1,000 plant species, about 15% endemic. Of 61 fish species recorded, 39 are endemic. Age and isolation did what they did on the Galapagos, only in a freshwater setting. For a ranking of countries with the highest overall species richness, see Countries with the Most Biodiversity.
IUCN's 2025 assessment rates the lake's conservation outlook "significant concern," with current values rated high concern and deteriorating. The threats it lists include pollution and eutrophication (nutrient overload that fuels algal growth), uncontrolled tourism development, climate change, water-level regulation, proposed hydropower in Mongolia, legacy waste from the Baikalsk Paper and Pulp Mill, invasive species, coastal forest fires, and logging. Note that the paper mill's waste is listed as a legacy problem: closing a source does not remove what it left behind.
A caution on a famous statistic. You will see Baikal described as holding 20% of the world's fresh water, and the Great Lakes described as holding 21%. Both numbers appear in credible sources, and they cannot both be a fifth of the same total. The EPA says the Great Lakes hold about 21% of the world's surface fresh water, while Canadian government sources give 18%. Differences come from the denominator: unfrozen versus all surface fresh water, with or without lakes' saline neighbors, and whether groundwater counts. The numbers are best read as "roughly a fifth," not as precise shares.
The Great Lakes: a shared system with very different lakes
The five Great Lakes straddle the border between Canada and the United States, and they behave less like one lake than like five relatives with different personalities. The most telling number in the EPA table is retention time, the average time a water molecule stays in the lake before flowing out. Superior's is about 191 years, Michigan's 99, Huron's 22, Ontario's 6, and Erie's just 2.6 years.
Those figures explain why the same pollutant plays out differently in each lake. A contaminant entering Lake Superior can linger for generations, while Erie's shallow basin, with a maximum depth of 64 m, flushes in under three years but also warms quickly and is more exposed to the land around it. Water managers have to plan on very different timescales, from a few years in Erie to roughly two centuries in Superior.
The lakes are also a long-range supply of drinking water, fisheries, and shipping lanes for two countries. Canadian government sources state that the system holds 18% of the world's fresh water in lakes, and the EPA says 21% of the world's surface fresh water. Whichever figure you prefer, it is the largest group of freshwater lakes on the planet.
Lakes are not only a drinking resource. Rivers that drain them, and the reservoirs built on rivers, are also used to generate power. Reservoirs behave like engineered lakes, which is why some datasets count them and others do not. The ranking in Countries with the Most Hydropower shows where that installed capacity is concentrated.
The Caspian paradox: lake, sea, or both?
The Caspian Sea is the largest inland body of water on Earth, about 371,000 km². Five countries touch its shores: Russia, Kazakhstan, Turkmenistan, Iran, and Azerbaijan. Its salinity averages around 1.2%, about a third of the typical ocean value, and it is much fresher in the north where the Volga pours in. So the Caspian is not freshwater, and it does not belong in a list of freshwater lakes, but it appears in almost every list of the world's biggest lakes. Verpoorter's global inventory excluded it for that reason.
The label matters because of law. A sea falls under the UN Convention on the Law of the Sea, with territorial waters and exclusive economic zones. A lake would be divided among the bordering states, often in equal shares or along median lines. For more than two decades the five states argued over which regime applied to oil, gas, fishing, and pipelines.
The five leaders signed the Convention on the Legal Status of the Caspian Sea in Aktau, Kazakhstan, in 2018, after more than two decades of talks. The treaty is a hybrid: it gives each country a coastal zone for sovereignty and fishing, shares the surface waters for shipping and use, and leaves seabed boundaries to bilateral deals. Several seabed questions among the southern states remain open, so the sea-or-lake question has been settled in practice by a compromise rather than by a definition.
If you want the record-book view of the biggest bodies of water by surface area, The Largest Lakes in the World covers the Caspian alongside Lake Superior and Lake Victoria, and The Deepest Lakes in the World takes the depth angle.
Are the world's lakes shrinking?
Many are. A 2023 study in Science by Fangfang Yao and colleagues used about 250,000 satellite snapshots of 1,972 of the largest lakes and reservoirs from 1992 to 2020. It found that 53% of the large lakes lost water storage, and so did nearly two-thirds of large reservoirs (CIRES, University of Colorado Boulder).
The drivers differ by type. In natural lakes, the net decline came from climate change and human water consumption. In reservoirs, the dominant cause was sedimentation, which fills the basin behind a dam. About 2 billion people, roughly a quarter of the world's population, live in the basin of a drying lake, and the total loss was equal to about 17 times the volume of Lake Mead, the largest US reservoir.
The study is not all bad news. About 24% of lakes gained significant storage, and Lake Sevan in Armenia recovered after conservation laws limited water withdrawals. The trend is real but not uniform, and it is strongest in dry regions where people draw heavily on the same rivers that feed the lakes.
It would be tempting to conclude that lake-rich countries like Canada and Russia are safe while dry regions lose. The study does not say that, and lakes at high latitudes face their own changes, including altered ice seasons and shifting river inflows. The researchers did not rank countries by risk. For the broader water-supply picture, see Water Scarcity: The Growing Global Crisis Explained.
The Aral Sea: what happens when a lake loses its rivers
The Aral Sea is the textbook case. NASA's Earth Observatory describes it as once the fourth largest lake in the world. In the 1960s the Soviet Union began diverting the Amu Darya and Syr Darya rivers to irrigate cotton and other crops across the deserts of Kazakhstan, Uzbekistan, and Turkmenistan. By 2000 the lake was a fraction of its 1960 extent, and the northern basin had separated from the southern one (NASA Earth Observatory).
Drought in the mid-2000s cut the Amu Darya's flow further, and the eastern lobe of the South Aral disappeared completely in 2014. The consequences went well beyond lost water: fisheries and the communities that depended on them collapsed, salty dust from the exposed lakebed, contaminated with agricultural chemicals, became a health hazard, and the loss of the lake's moderating effect made winters colder and summers hotter and drier.
Kazakhstan completed the Kok-Aral dike and dam in 2005, separating the North Aral from the South. Water levels in the North Aral rose significantly in 2005 and 2006, and its fisheries recovered. The price was that the dam limited inflow to the South Aral. This is a hard trade: it saved a smaller, healthier lake by giving up a larger, dying one.
The Aral example also shows the link between lakes and disaster risk. When water bodies shrink, exposed sediments, dust storms, and changing local climate follow. If you want to see which countries face the broadest range of hazards, compare Countries Most Affected by Natural Disasters.
How lakes fit into the water cycle
Lakes are storage tanks in a cycle that never stops. Rain, snowmelt, rivers, and groundwater flow in; evaporation, outflow rivers, and seepage take water out. The balance decides whether a lake grows, shrinks, or stays stable. A lake with no outlet, like the Caspian or the Aral, loses water only by evaporation, so salts accumulate over time. A lake with a river outlet, like the Great Lakes draining through the St. Lawrence, flushes continuously.
That is why retention time matters, and it is also why a lake's fate depends on its catchment. Dams, irrigation, and land use upstream change what arrives. For a clear account of the underlying cycle, How the Water Cycle Works explains how human activity disrupts it.
Common misconceptions about lake rankings
"Finland has the most lakes of any country in Europe." By the one-hectare yardstick, Sweden has more according to its own national agency. Finland has the highest density.
"Minnesota has 10,000 lakes." The nickname rounds. The nickname is a round number rather than a count, and totals depend on the minimum size included, so counting smaller basins raises the number sharply.
"The Caspian is the world's largest freshwater lake." It is the largest inland water body by area, but its water is brackish. Lake Superior is the largest freshwater lake by area, and Baikal is the largest by volume.
"More lakes means more drinkable water." Not necessarily. Many northern lakes are shallow, remote, or cold, and lake water is only one part of the supply. A shallow lake network can hold less water than one deep reservoir. Accessible, renewable water is better measured by river flow and aquifer recharge, which is why national freshwater rankings use a different yardstick.
"A lake is a permanent feature." On geological timescales, lakes are temporary. Glacial lakes fill with sediment, rifts open and close, and human extraction can drain a lake in decades. Baikal's 20 to 25 million years is the exception.
"Reservoirs are lakes." Reservoirs are dammed rivers. Some datasets, like HydroLAKES, include them in the lake count, and others separate them. Always check which one a statistic uses.
Frequently asked questions
Q: Which country has the most lakes? A: Canada, by most measures of area and by the most generous counts, with the government citing as many as two million lakes. By a strict count above one hectare among Nordic countries, Sweden (nearly 100,000) leads Finland (about 57,000). Without a stated size threshold, no list is reliable.
Q: How many lakes are there in the world? A: It depends on the cutoff. A satellite inventory published in 2014 found about 117 million lakes of 0.2 hectares or larger. HydroLAKES counts about 1.4 million lakes and reservoirs of at least 10 hectares. Both are valid answers to different questions.
Q: What is the largest freshwater lake in the world? A: By surface area, Lake Superior, at about 82,100 km². By volume and depth, Lake Baikal in Russia, which is around 1.6 kilometers deep and holds roughly 20% of the world's unfrozen freshwater. The Caspian Sea is larger by area but is brackish.
Q: Why does Canada have so many lakes? A: Ice sheets scoured basins into hard Canadian Shield rock, dumped debris dams, and scrambled river drainage as they retreated. The young landscape has not yet developed mature drainage, so water pools in countless hollows. The ground is also still rebounding from the ice load.
Q: Is the Caspian Sea a lake or a sea? A: It is an enclosed body of water with no natural connection to the ocean, which makes it a lake in the geographic sense, but it is salty, so it is not freshwater. A 2018 convention signed by the five bordering states created a hybrid legal regime rather than choosing one label.
Q: Are the world's lakes drying up? A: A 2023 satellite study found that 53% of 1,972 large lakes lost water between 1992 and 2020, while about 24% gained significant storage. Climate change and human water use drove the declines in natural lakes, and sediment buildup drove losses in reservoirs.
Q: Are artificial reservoirs counted as lakes? A: It depends on the dataset. National lake counts usually focus on natural lakes, while global inventories such as HydroLAKES include reservoirs alongside them. Check the methodology before comparing two numbers.
The takeaway
The most interesting fact about lake rankings is that the question has no single answer. Count by area and Canada wins. Count ponds above one hectare and Sweden beats Finland. Count by volume and a single rift lake in Siberia rivals the entire Great Lakes system. Each yardstick measures something real, and the differences are caused by geology, by surveying methods, and by what a country chooses to call a lake.
What stays constant is the history behind the pattern. Ice sheets sculpted the northern lake belt, rifting built the deepest basins, and human demand is now reshaping both. Satellite data show that more than half of the largest lakes lost water in a recent three-decade window, and the Aral Sea shows how far that can go. When you next see a list of countries by lake count, check the threshold first, then ask what the number is measuring.
Sources
- Uppsala University, The world's lakes have finally been counted (Verpoorter et al., Geophysical Research Letters, 2014)
- HydroSHEDS, HydroLAKES database (Messager et al., Nature Communications, 2016)
- Statistics Canada, Freshwater in Canada
- Natural Resources Canada via Open Canada, Distribution of Freshwater
- SMHI, Sveriges sjöar
- Finnish Environment Institute via vesi.fi, How much water do the Finnish lakes hold?
- US EPA, Physical Features of the Great Lakes
- IUCN, Lake Baikal, World Heritage Outlook
- CIRES, Satellites reveal widespread decline in global lake water storage (Yao et al., Science, 2023)
- NASA Earth Observatory, Aral Sea
Related Reading
Follow new articles
Add SciHub101 to your feed reader to see new science and technology stories.
About the Author
SciHub101 is an independent science and technology publication founded and edited by Buğra Sözeri, a software engineer and app developer based in Türkiye. AI tools assist with drafting and research. Source documentation in the existing archive is uneven, and articles are being reviewed and corrected. The Editorial Team byline identifies editorial responsibility; it does not certify specialist or independent human review. Where we compare products, anything built by our own team is labelled as such — see the editorial guidelines and About page for how corrections and disclosures work.
Related Articles
The Biodiversity Collapse: Why Species Are Vanishing Faster
Species are disappearing tens to hundreds of times faster than the long-run average, and monitored wildlife populations have fallen by about three-quarters since 1970. Here is what the numbers mean, what drives the loss, and what has worked.
Countries with the Most Organic Farming (2023-24 Data)
Australia reports 53 million hectares of organic farmland, more than half the world total, much of it extensive grazing land. Austria, Uruguay, and Estonia lead on share of farmland. Here is who leads, how the numbers are counted, and what the yield gap means.
Countries with the Most Freshwater Resources (Ranked)
Brazil has the world's largest total renewable freshwater resources — approximately 8,647 cubic kilometers per year, more than any other country and roughly 20 percent of the global total. Russia is second at 4,525 km³/year, Canada third at 2,860 km³/year. But total volume is only part of the story: Canada's per-capita freshwater availability is 36 times higher than China's. And water stress — not total availability — is the defining water challenge of the twenty-first century. This ranking covers the top 20 countries by total renewable freshwater resources, sourced from FAO AQUASTAT, with per-capita comparison and analysis of global water scarcity.
Countries Facing the Worst Freshwater Stress (WRI Ranked)
WRI's 2023 Aqueduct update puts 25 countries, home to about a quarter of humanity, in the extremely high water stress category. Here is who ranks worst, why the rankings disagree, and what Cape Town, Chennai, the Aral Sea, and Israel show about causes and fixes.
How Climate Change Is Affecting Your Daily Life
Climate change is not a future event that will arrive later. It is already changing the price of your coffee, the length of your allergy season, the cost of your home insurance, the availability of water in your tap, and the heat outside your window. The effects are measurable, attributed to specific climate mechanisms by peer-reviewed science, and accumulating across every aspect of daily life in 2026. This article maps the concrete pathways — with numbers — from global warming to your daily experience.
Countries with the Most Hydropower (Ranked by Installed Capacity)
China leads the world in hydropower with 435.95 GW of installed capacity — more than three times that of second-place Brazil at 110 GW. Hydropower is the world's largest source of renewable electricity, accounting for roughly 40 percent of global renewable generation. This ranking covers the top 15 countries by hydropower installed capacity using IHA and IRENA 2024 data, with methodology, historical context, and caveats about what capacity figures do and do not tell you.