Countries With the Highest CO₂ Emissions: Territorial, Per Capita and Historical
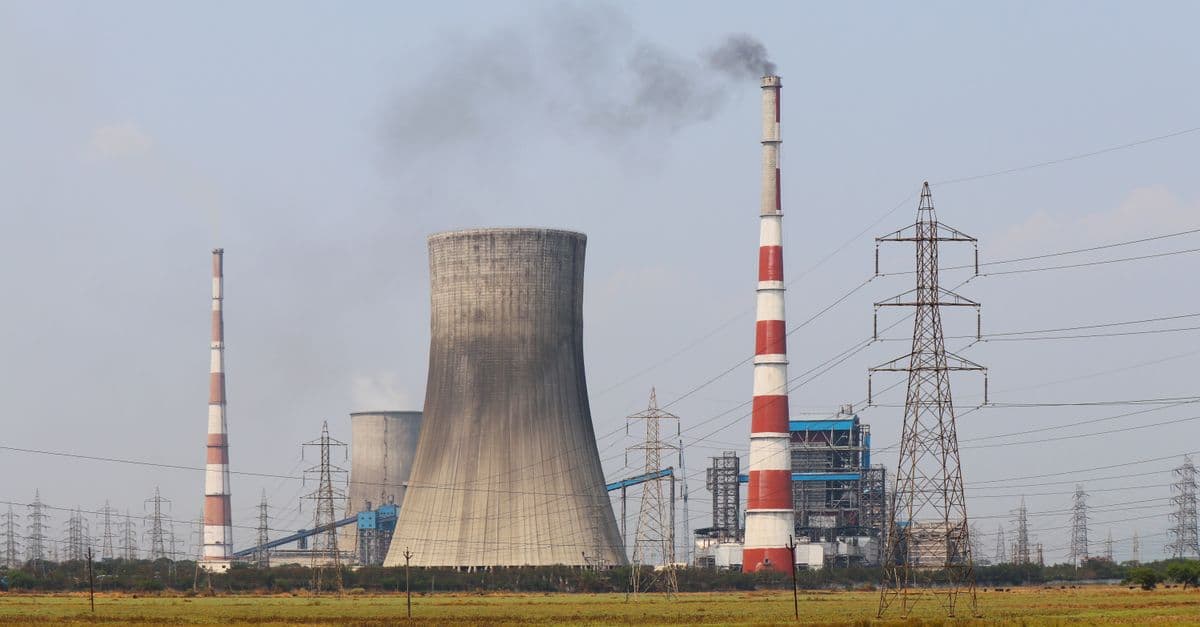
Photo: Sharath G. / Pexels
Carbon dioxide from burning coal, oil and gas, and from making cement, is the largest single driver of human-caused climate change. In 2024 these sources released about 38.6 billion tonnes of CO₂, according to Global Carbon Project data compiled by Our World in Data. The Global Carbon Budget 2025 projects that fossil emissions rose another 1.1% in 2025, to a record of about 38.1 billion tonnes on its updated basis, and that atmospheric CO₂ will average about 425.7 parts per million, roughly 52% above pre-industrial levels.
Who is responsible for those emissions is a question with more than one honest answer. A country can be counted by what is burned inside its borders, by what its population consumes, by how much each resident emits, or by everything it has emitted since the industrial revolution. Each method produces a different ranking, and each is used for a different purpose in climate policy. This article sets out all four, with the data source and year for every table, and explains what each one can and cannot tell you.
Key Takeaways
- In 2024, China emitted about 12.3 billion tonnes of fossil CO₂ (31.8% of the world total), the United States 4.9 billion (12.7%) and India 3.2 billion (8.3%).
- The three largest emitters together produced just over half of global fossil CO₂ in 2024.
- Per person, the highest emitters are Gulf oil and gas producers: Qatar (about 41 tonnes), Kuwait (26) and Bahrain (24), against a world average of about 4.7 tonnes.
- On cumulative emissions since 1750, the United States leads with about 435 billion tonnes, roughly 24% of the historical total, ahead of China at about 15%.
- On a consumption basis, the United Kingdom's 2023 emissions were about 58% higher than its territorial emissions, while China's and India's were 11% and 17% lower.
The Four Ways to Count a Country's Emissions
Before the rankings, a short guide to the measures used in this article.
| Measure | What it counts | Best used for | Main limitation |
|---|---|---|---|
| Territorial (production-based) | CO₂ released inside a country's borders | UN climate reporting, national targets | Ignores emissions embedded in imports |
| Per capita | Territorial emissions divided by population | Comparing living standards and fairness | Hides the scale of large emitters |
| Consumption-based | Territorial emissions, minus emissions in exports, plus emissions in imports | Understanding the footprint of a lifestyle | Relies on trade models; available with a lag |
| Cumulative (historical) | All emissions since 1750 added together | Responsibility for warming so far | Raises hard questions about past ignorance and borders that changed |
Territorial accounting is the standard used under the UN Framework Convention on Climate Change, and it is what national targets such as the European Union's are measured against. The other three are analytical tools. None of them is "the real number"; they answer different questions.
All figures below cover fossil CO₂ (coal, oil, gas, flaring) plus cement and other industrial processes. They exclude land-use change such as deforestation, which added several billion tonnes more, and they exclude other greenhouse gases such as methane and nitrous oxide. Including those would raise countries with large deforestation or livestock emissions, for example Brazil and Indonesia.
Top 20 Countries by Annual Territorial CO₂ Emissions (2024)
| Rank | Country | CO₂ emissions (million tonnes) | Share of world total | Change vs 2023 | Data year |
|---|---|---|---|---|---|
| 1 | China | 12,289 | 31.8% | +1.0% | 2024 |
| 2 | United States | 4,904 | 12.7% | −0.3% | 2024 |
| 3 | India | 3,193 | 8.3% | +4.3% | 2024 |
| 4 | Russia | 1,781 | 4.6% | +2.7% | 2024 |
| 5 | Japan | 962 | 2.5% | −2.5% | 2024 |
| 6 | Indonesia | 812 | 2.1% | +6.5% | 2024 |
| 7 | Iran | 793 | 2.1% | +0.4% | 2024 |
| 8 | Saudi Arabia | 692 | 1.8% | +2.2% | 2024 |
| 9 | South Korea | 584 | 1.5% | −0.9% | 2024 |
| 10 | Germany | 572 | 1.5% | −3.6% | 2024 |
| 11 | Canada | 533 | 1.4% | −2.2% | 2024 |
| 12 | Turkey | 513 | 1.3% | +5.4% | 2024 |
| 13 | Brazil | 483 | 1.3% | −0.2% | 2024 |
| 14 | Mexico | 461 | 1.2% | +0.6% | 2024 |
| 15 | South Africa | 440 | 1.1% | +0.7% | 2024 |
| 16 | Australia | 387 | 1.0% | +0.6% | 2024 |
| 17 | Vietnam | 371 | 1.0% | +6.8% | 2024 |
| 18 | United Kingdom | 313 | 0.8% | +1.7% | 2024 |
| 19 | Italy | 302 | 0.8% | −3.3% | 2024 |
| 20 | Malaysia | 290 | 0.8% | +5.0% | 2024 |
| — | European Union (27, combined) | 2,426 | 6.3% | — | 2024 |
| — | World | 38,599 | 100% | — | 2024 |
Source: Global Carbon Project, Global Carbon Budget, as compiled in the Our World in Data CO₂ dataset (columns
co2,share_global_co2,co2_growth_prct), accessed 2026-10-19. Fossil fuels and industry only; land-use change excluded. The world total includes international aviation and shipping, which are not assigned to any country.
Just outside the top 20 are Kazakhstan (287 million tonnes), Poland (273) and Taiwan (262). Two patterns are visible in the change column. Emissions are still rising quickly in fast-growing emerging economies (India, Indonesia, Vietnam, Turkey, Malaysia), while they are falling in most of the long-industrialised economies (Germany, Japan, Italy, Canada). The UK's small rise in 2024 came after a long decline and follows a very low 2023.
If the European Union were counted as one emitter, it would rank fourth, between India and Russia, at about 2.4 billion tonnes.
China: Scale, Coal and a Possible Plateau
China's 12.3 billion tonnes in 2024 were more than the United States, India and the European Union combined. Coal is the reason: CO₂ from coal alone in China was about 8.9 billion tonnes in 2024, more than half of all coal-related CO₂ in the world. Coal supplies the majority of Chinese electricity and is also the main fuel for its steel, cement and chemical industries, which produce a large share of the world's output of those materials.
China's emissions growth has slowed markedly. Our World in Data's figures show a rise of about 1% in 2024, and the Global Carbon Budget 2025 projects growth of just 0.4% for 2025. China installs more solar and wind capacity each year than any other country, and analysts are debating whether its emissions have reached a plateau. Its official commitments are to peak CO₂ emissions before 2030 and to reach carbon neutrality before 2060; its 2035 pledge under the Paris Agreement, announced in 2025, targets a 7–10% cut in net greenhouse gas emissions from their peak level.
China's per-person emissions, about 8.7 tonnes in 2024, are now above those of the European Union (about 5.4 tonnes) but well below those of the United States (about 14.2 tonnes).
The United States: Second Largest, First in History
US emissions were about 4.9 billion tonnes in 2024, down roughly 20% from about 6.1 billion tonnes in 2005, which was close to the national peak. Most of that fall came from the power sector, where natural gas and, later, wind and solar replaced coal. Burning gas for electricity emits roughly half as much CO₂ per unit of power as coal, which is why the coal-to-gas switch cut emissions even though it did not remove fossil fuels from the grid.
The Global Carbon Budget 2025 projects a 1.9% rise in US emissions for 2025. Per person, the US remains among the highest-emitting large economies at about 14.2 tonnes, reflecting large homes, long driving distances, an energy-intensive industrial base and comparatively low energy prices. The country's role in cumulative emissions is covered below.
India: The Fastest-Growing Large Emitter
India emitted about 3.2 billion tonnes in 2024, an increase of 4.3% on the year, and is now the third-largest emitter. Its emissions are rising because its economy and electricity demand are growing quickly, and because coal remains the main source of power. Yet India's per-person emissions were only about 2.2 tonnes in 2024, less than half the world average and about one-sixth of the US figure.
India has committed to net-zero emissions by 2070 and is adding solar capacity rapidly. How fast clean power can keep up with demand growth in India, and in other fast-growing economies such as Indonesia and Vietnam, will shape global emissions over the next two decades more than any other single factor.
Per Capita Emissions: A Different Ranking
Dividing emissions by population changes the picture completely.
| Country | CO₂ per person (tonnes) | Data year |
|---|---|---|
| Qatar | 41.3 | 2024 |
| Kuwait | 26.2 | 2024 |
| Bahrain | 24.3 | 2024 |
| Trinidad and Tobago | 22.9 | 2024 |
| Saudi Arabia | 20.4 | 2024 |
| United Arab Emirates | 20.1 | 2024 |
| Oman | 15.7 | 2024 |
| Australia | 14.5 | 2024 |
| United States | 14.2 | 2024 |
| Kazakhstan | 13.9 | 2024 |
| Canada | 13.4 | 2024 |
| Russia | 12.3 | 2024 |
| South Korea | 11.3 | 2024 |
| China | 8.7 | 2024 |
| Japan | 7.8 | 2024 |
| Germany | 6.8 | 2024 |
| European Union (27) | 5.4 | 2024 |
| United Kingdom | 4.5 | 2024 |
| France | 4.0 | 2024 |
| Brazil | 2.3 | 2024 |
| India | 2.2 | 2024 |
| Nigeria | 0.6 | 2024 |
| Ethiopia | 0.1 | 2024 |
| World average | 4.7 | 2024 |
Source: Global Carbon Project via Our World in Data (
co2_per_capita), accessed 2026-10-19. Countries with populations above 1 million.
The top of the list is dominated by oil- and gas-exporting states with small populations. Their emissions are high partly because of their own energy use, including air conditioning, desalination and cheap subsidised fuel, and partly because the extraction, processing and liquefaction of oil and gas for export happens on their territory. That second point is important: some of Qatar's per-person figure is effectively emitted on behalf of the countries that buy its liquefied natural gas. For the trade side of this picture, see our ranking of the countries that export the most oil.
At the other end of the scale, a resident of Ethiopia emits about one three-hundredth of a resident of Qatar. Low-income countries contribute very little to global emissions and are often the most exposed to the consequences, a theme covered in our ranking of the countries most vulnerable to climate change.
Consumption-Based Emissions: Who Emits for Whom
Territorial accounting assigns the emissions from a factory to the country where the factory stands, even if the goods are shipped abroad. Consumption-based accounting reverses that: it subtracts the emissions embedded in exports and adds those embedded in imports, so emissions are assigned to the country where the goods are finally used. The Global Carbon Project publishes consumption-based estimates using global trade models, but they are available with a delay; the latest year in the dataset is 2023.
| Country | Territorial CO₂ (Mt) | Consumption-based CO₂ (Mt) | Difference | Data year |
|---|---|---|---|---|
| China | 12,172 | 10,857 | −10.8% | 2023 |
| United States | 4,918 | 5,432 | +10.4% | 2023 |
| India | 3,063 | 2,543 | −17.0% | 2023 |
| Russia | 1,733 | 1,406 | −18.9% | 2023 |
| Japan | 987 | 1,142 | +15.7% | 2023 |
| Germany | 594 | 768 | +29.4% | 2023 |
| South Africa | 437 | 325 | −25.5% | 2023 |
| United Kingdom | 308 | 487 | +58.2% | 2023 |
| France | 270 | 407 | +50.7% | 2023 |
| Switzerland | 32 | 118 | +270% | 2023 |
| European Union (27) | 2,485 | 3,302 | +32.9% | 2023 |
Source: Global Carbon Project via Our World in Data (
co2,consumption_co2,trade_co2_share), accessed 2026-10-19.
The pattern is consistent. Manufacturing exporters and fossil-fuel exporters, such as China, India, Russia and South Africa, have lower consumption-based emissions than territorial ones. Wealthy importers, such as the United States, Japan, Germany, the UK, France and especially Switzerland, have higher ones. On a consumption basis, the average EU resident had a footprint of about 7.3 tonnes in 2023, and the average US resident about 15.8 tonnes.
This matters for how progress is judged. Part of the fall in European territorial emissions since 1990 reflects real changes, such as closing coal plants and improving efficiency, but part of it reflects heavy industry moving to other countries. Consumption-based figures for the EU and the UK have also fallen, which suggests the decline is not only an accounting effect, but it is smaller than the territorial numbers alone imply.
Cumulative Emissions: Responsibility for Warming So Far
CO₂ stays in the atmosphere for a very long time, and the amount of warming the world has experienced is closely related to the total amount of CO₂ emitted since industrialisation began. That makes cumulative emissions the most relevant measure for asking who caused the warming that has already happened.
| Rank | Country | Cumulative CO₂ since 1750 (billion tonnes) | Share of world cumulative total | Through year |
|---|---|---|---|---|
| 1 | United States | 435 | 23.5% | 2024 |
| 2 | China | 285 | 15.4% | 2024 |
| 3 | Russia | 123 | 6.6% | 2024 |
| 4 | Germany | 95 | 5.1% | 2024 |
| 5 | United Kingdom | 80 | 4.3% | 2024 |
| 6 | Japan | 70 | 3.8% | 2024 |
| 7 | India | 66 | 3.6% | 2024 |
| 8 | France | 40 | 2.2% | 2024 |
| 9 | Canada | 36 | 1.9% | 2024 |
| 10 | Ukraine | 31 | 1.7% | 2024 |
Source: Global Carbon Project via Our World in Data (
cumulative_co2,share_global_cumulative_co2), accessed 2026-10-19. Fossil fuels and industry only. Including land-use change raises the cumulative totals of countries with large historical deforestation, such as Brazil and Indonesia.
The United Kingdom, the first country to industrialise on coal, now emits less than 1% of the world's annual CO₂ but accounts for more than 4% of everything emitted since 1750. China's cumulative share has risen fast because its recent annual emissions are so large; at current rates it will continue to close the gap with the United States. India, despite its size, has a cumulative share of under 4%, which is the core of its argument in climate negotiations that wealthy countries should cut fastest.
This historical dimension is the basis of the principle of "common but differentiated responsibilities and respective capabilities" written into the 1992 UN climate convention: all countries share the task, but the ones that emitted most and can afford most are expected to do more.
What the Fuel Mix Says About Global Emissions
Breaking global emissions down by source shows why coal is at the centre of the problem.
| Source | Global CO₂ in 1990 (Mt) | Global CO₂ in 2024 (Mt) | Change |
|---|---|---|---|
| Coal | 8,660 | 15,805 | +83% |
| Oil | 9,196 | 12,471 | +36% |
| Natural gas | 3,790 | 8,010 | +111% |
| Cement | 493 | 1,473 | +199% |
| Total (all sources incl. flaring and other) | 22,732 | 38,599 | +70% |
Source: Global Carbon Project via Our World in Data (
coal_co2,oil_co2,gas_co2,cement_co2,co2for the World), accessed 2026-10-19.
Coal is now the largest single source of fossil CO₂, and most of its growth since 1990 has been in Asia. Gas emissions have more than doubled, partly because gas replaced coal in some power systems, which lowered emissions there while raising gas's own total. Cement is a special case: about half or more of its emissions come not from fuel but from the chemical reaction that turns limestone into clinker, which is why it is one of the hardest sectors to decarbonise and why technologies like those described in how carbon capture works in practice are often discussed for it.
Europe: Proof That Emissions Can Fall
The United Kingdom and Germany are the clearest examples of large economies that have cut territorial emissions deeply while their economies grew.
- United Kingdom: about 602 million tonnes in 1990, about 313 million tonnes in 2024, a fall of roughly 48%. Most of the cut came from replacing coal power with gas and later with offshore wind, plus the decline of heavy industry.
- Germany: about 1,055 million tonnes in 1990, about 572 million tonnes in 2024, a fall of roughly 46%. Part of the early decline came from the closure of inefficient East German industry after reunification; more recent cuts come from renewable electricity and lower industrial output.
The consumption-based figures above are a reminder that some of this reduction was exported. Even so, both countries emit far less per person than they did in 1990, and their electricity systems are now dominated by low-carbon sources. Real-time measurement of these changes is improving quickly, as described in our article on AI emissions tracking and real-time monitoring.
How These Numbers Are Measured
The Global Carbon Project does not measure CO₂ from chimneys country by country. It estimates national fossil emissions from energy statistics: how much coal, oil and gas each country burns, multiplied by the carbon content of each fuel, with cement emissions estimated from production data. National inventories submitted to the UN, energy statistics from the Energy Institute and the IEA, and other databases such as the European Commission's EDGAR are used to build and cross-check these estimates.
Because the methods differ slightly, figures from the Global Carbon Project, the IEA and EDGAR for the same country and year usually differ by a few percent. The IEA's figures, for example, cover energy-related CO₂ and treat industrial process emissions differently. When you see two numbers for China's emissions in two news stories, the difference is usually methodology, not a disagreement about the facts. Uncertainty is also higher for countries whose energy statistics are less complete, and the latest year is always provisional and revised the following year.
Satellites that measure atmospheric CO₂ concentrations are increasingly used to check inventories from above, although they cannot yet replace energy statistics for national totals. The basic physics of why rising CO₂ warms the planet is explained in how climate change science works, and the consequences for seawater chemistry are covered in ocean acidification explained.
The Remaining Carbon Budget
The Global Carbon Budget 2025 estimates that the remaining carbon budget for a 50% chance of limiting warming to 1.5°C is about 170 billion tonnes of CO₂, roughly four years of emissions at the 2025 rate. The report describes that budget as virtually exhausted. In practical terms, it means the 1.5°C goal is now widely expected to be exceeded at least temporarily, and the debate has shifted towards how quickly emissions can be brought down to limit how far and how long warming overshoots.
The 2025 report also found that land-use change emissions fell to about 4.1 billion tonnes, and that the land carbon sink recovered after the 2023–24 El Niño. A companion analysis estimated that about 8% of the rise in atmospheric CO₂ since 1960 is due to climate change itself weakening the land and ocean sinks, a feedback that makes each additional tonne of emissions slightly more damaging.
Common Misconceptions
"China is responsible for climate change." China is the largest annual emitter by a wide margin, but the United States has emitted more in total since 1750, and Europe as a whole has emitted more than either. Annual and cumulative views are both valid and lead to different conclusions.
"Small countries don't matter." No single small country matters much, but countries outside the top 20 together produced roughly a fifth of global CO₂ in 2024. Their combined trajectory matters a great deal.
"Rich countries have already solved their emissions." Emissions per person in the United States, Canada and Australia are still about three times the world average, and consumption-based figures for most wealthy importers are higher than their territorial ones.
"Per capita figures make large emitters look good." They are a fairness measure, not an impact measure. The atmosphere responds to total tonnes, so large emitters matter for physics, while per-person figures matter for equity.
Frequently Asked Questions
Q: Which country emits the most CO₂? A: China, with about 12.3 billion tonnes of fossil and industrial CO₂ in 2024, roughly 32% of the global total according to Global Carbon Project data. The United States was second at about 4.9 billion tonnes and India third at about 3.2 billion tonnes.
Q: Which country has the highest CO₂ emissions per person? A: Among countries with more than 1 million people, Qatar had the highest figure in 2024 at about 41 tonnes per person, followed by Kuwait and Bahrain. The world average was about 4.7 tonnes.
Q: Which country has emitted the most CO₂ in history? A: The United States, with about 435 billion tonnes of fossil and industrial CO₂ from 1750 to 2024, around 24% of the global cumulative total. China is second at about 15%.
Q: What are consumption-based emissions? A: They assign emissions to the country that consumes goods rather than the one that produces them. Importers such as the UK, Germany and Switzerland have higher consumption-based emissions than territorial ones; exporters such as China, India and Russia have lower ones.
Q: Are global CO₂ emissions still rising? A: Yes, slowly. The Global Carbon Budget 2025 projects that fossil CO₂ emissions rose about 1.1% in 2025 to a new record. Emissions are falling in most of Europe and in Japan but rising in several fast-growing emerging economies.
Q: Why do different sources give different emissions figures for the same country? A: The Global Carbon Project, the IEA and EDGAR use slightly different methods and coverage, for example in how they treat cement and other industrial processes, and the latest year is always provisional. Differences of a few percent are normal.
The Bottom Line
The question "which country emits the most CO₂?" has a clear answer on an annual basis: China, by a large margin, followed by the United States and India. But the ranking of responsibility depends on the measure. Per person, Gulf producers and a handful of wealthy economies lead. Historically, the United States and Europe account for the largest shares. On a consumption basis, rich importers carry emissions that their territorial figures do not show. Taken together, the data point to the same practical conclusion: global emissions will only fall if the largest annual emitters cut coal quickly, the wealthiest emitters cut fastest, and fast-growing economies can expand clean energy faster than demand rises. For individual-level choices, our guide on how to reduce your carbon footprint covers what the evidence supports.
Sources
- Our World in Data, CO₂ and greenhouse gas emissions dataset (Global Carbon Project data): github.com/owid/co2-data
- University of Maryland, Department of Geographical Sciences, summary of the Global Carbon Budget 2025: geog.umd.edu
- Ember, Global Electricity Review 2025 (power-sector emissions context): ember-energy.org
Related Reading
Follow new articles
Add SciHub101 to your feed reader to see new science and technology stories.
About the Author
SciHub101 is an independent science and technology publication founded and edited by Buğra Sözeri, a software engineer and app developer based in Türkiye. AI tools assist with drafting and research. Source documentation in the existing archive is uneven, and articles are being reviewed and corrected. The Editorial Team byline identifies editorial responsibility; it does not certify specialist or independent human review. Where we compare products, anything built by our own team is labelled as such — see the editorial guidelines and About page for how corrections and disclosures work.
Related Articles

Countries With the Largest Ocean Territory (EEZ)
The ocean covers 71% of Earth's surface, and a coastal state controls the resources in the first 200 nautical miles off its shores. This ranking shows which nations hold the most maritime territory, why published figures disagree, and what an exclusive economic zone does and does not allow.
Countries With the Cleanest Air in the World (2025)
Air quality is one of the most direct indicators of environmental health. This ranking shows which countries and territories breathe the cleanest air, which suffer the worst pollution, and why small islands keep beating industrial giants on the numbers.
Countries Most Vulnerable to Climate Change (2025 Ranked)
Somalia, Chad, and Sudan top the Global Climate Risk Index. Small island nations like Tuvalu and Kiribati face complete disappearance beneath rising seas. Bangladesh could lose 17% of its land by 2050. Here's which countries face the greatest climate threat — and the cruel injustice that those most at risk contributed almost nothing to causing the crisis.

Countries With the Most Forest Cover (2025)
Forests cover 4.14 billion hectares, about 32% of the world's land, per FAO's 2025 assessment. Russia, Brazil, Canada, the United States and China hold more than half. Ranked by area and by share of land, with what the numbers miss.
Climate Change Explained — The Science, Causes, and Consequences
Climate change is happening, it's caused mainly by human emissions, and the evidence comes from thousands of independent measurements. Here's the science, the consequences, and the realistic path forward.

Deforestation Explained — Causes, Effects, and Real Solutions
The world clears about 10.9 million hectares of forest a year, slightly more than the area of Iceland. Here is what drives it, what it costs the climate, and which fixes have measurable results.