Countries With the Cleanest Air in the World (2025)
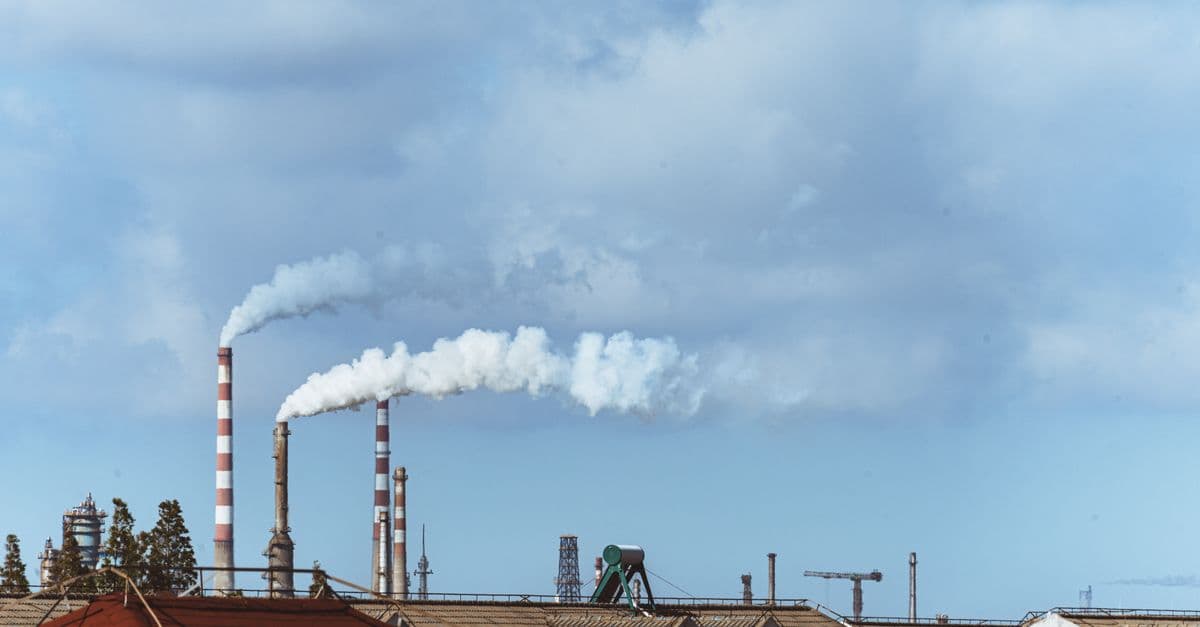
Photo: 女子 正真 / Pexels
The cleanest air on Earth is not found in the world's most environmentally ambitious countries. It is found on islands such as French Polynesia, Puerto Rico, and Barbados, where ocean winds sweep emissions away before they can build up. Air quality researchers measure this with PM2.5, fine particles 2.5 micrometers across or smaller that reach deep into the lungs and bloodstream. This ranking uses IQAir's 2025 annual averages, compares them with 2024, and explains what the numbers can and cannot tell you.
Key takeaways
- IQAir's 2025 report found 13 countries, regions, and territories that met the WHO annual PM2.5 guideline of 5 µg/m³, mostly in Latin America and the Caribbean.
- The cleanest annual averages in 2025 were in French Polynesia (1.8 µg/m³), Puerto Rico (2.4), the U.S. Virgin Islands (2.5), and Barbados (2.6). Iceland came in at 3.7.
- Most of the cleanest places are islands or sparsely populated. Small, wind-swept places with little industry have a built-in advantage that large countries cannot copy.
- Pakistan (67.3 µg/m³) and Bangladesh (66.1) had the highest 2025 national averages, more than 13 times the WHO guideline.
- Year-to-year swings can be large in places with few monitors, so one year's rank is a snapshot, not a verdict.
The 20 cleanest countries and territories (2025)
The table below lists the 20 lowest annual PM2.5 averages in IQAir's 2025 ranking of 143 countries, regions, and territories, with the 2024 value for comparison. Values are in micrograms per cubic meter (µg/m³), the standard unit for particle concentration. A dash means the source lists no 2024 value.
| Rank | Country or territory | 2025 PM2.5 (µg/m³) | 2024 PM2.5 (µg/m³) |
|---|---|---|---|
| 1 | French Polynesia | 1.8 | 2.5 |
| 2 | Puerto Rico | 2.4 | 2.7 |
| 3 | U.S. Virgin Islands | 2.5 | 2.6 |
| 4 | Barbados | 2.6 | 3.1 |
| 5 | New Caledonia | 3.6 | - |
| 6 | Iceland | 3.7 | 4.0 |
| 7 | Bermuda | 3.8 | 2.5 |
| 8 | Reunion | 4.3 | - |
| 9 | Andorra | 4.3 | 6.0 |
| 10 | Australia | 4.4 | 4.5 |
| 11 | Grenada | 4.7 | 3.2 |
| 12 | Panama | 4.8 | 10.1 |
| 13 | Estonia | 4.9 | 4.6 |
| 14 | New Zealand | 5.1 | 4.4 |
| 15 | Finland | 5.2 | 5.2 |
| 16 | Sweden | 5.5 | 5.3 |
| 17 | Trinidad and Tobago | 5.5 | 6.1 |
| 18 | Costa Rica | 6.1 | 7.0 |
| 19 | Norway | 6.2 | 6.6 |
| 20 | Honduras | 6.3 | 15.2 |
Source: IQAir, "World's most polluted countries and regions" ranking (2025 and 2024 annual averages), built from the IQAir World Air Quality Report. The 2025 edition covers 9,446 cities in 143 countries, regions, and territories using more than 40,000 monitoring stations and low-cost sensors, according to IQAir's report page.
Three features of this table matter more than the order.
First, many entries are territories rather than sovereign countries. IQAir ranks "countries, regions, and territories" together, so French Polynesia, Puerto Rico, the U.S. Virgin Islands, New Caledonia, Bermuda, and Reunion appear alongside nations. That is also why counts of "countries meeting the guideline" differ between sources, a point covered in the next section.
Second, rank can move on small changes. Iceland's average fell from 4.0 to 3.7 µg/m³ between 2024 and 2025, yet its rank among the very cleanest is shaped as much by what others did as by Iceland. Bermuda moved the other way, from 2.5 to 3.8.
Third, some swings are too large to be real shifts in the atmosphere alone. Honduras went from 15.2 to 6.3 µg/m³ and Panama from 10.1 to 4.8 in a single year. Changes of that size can come from weather (a bad fire or dust season in one year, not the next) or from changes in which monitors report. Treat single-year numbers from countries with sparse networks with caution.
How many places actually meet the WHO guideline?
The World Health Organization lowered its annual PM2.5 guideline from 10 to 5 µg/m³ in its 2021 global air quality guidelines. In 2019, 99 percent of the world's population lived in places that did not meet WHO guideline levels, according to the WHO fact sheet on ambient air quality.
IQAir's count of places that meet the guideline depends on what you count. In its 2024 report, the company named seven countries that met the guideline: Australia, the Bahamas, Barbados, Estonia, Grenada, Iceland, and New Zealand. The same report said 126 of 138 countries and regions (91.3 percent) exceeded it, which leaves 12 that did not (IQAir 2024 press release). The release does not explain the gap between seven and 12. The 2024 values above show a likely reason: several territories, such as Bermuda, Puerto Rico, the U.S. Virgin Islands, and French Polynesia, also came in under 5 µg/m³ and are counted as "regions" rather than "countries." That is an inference from the data, not an IQAir statement.
For 2025, IQAir reports that 13 countries, regions, and territories met the guideline, and that the share of cities meeting it slipped from 17 percent in 2024 to 14 percent in 2025.
What do the WHO interim targets mean?
The WHO guideline comes with a ladder of "interim targets" for countries that start far above it. The table shows the 2021 values.
| Level | Annual PM2.5 (µg/m³) | 24-hour PM2.5 (µg/m³) |
|---|---|---|
| Interim target 1 | 35 | 75 |
| Interim target 2 | 25 | 50 |
| Interim target 3 | 15 | 37.5 |
| Interim target 4 | 10 | 25 |
| Guideline (2021) | 5 | 15 |
Source: WHO 2021 Global Air Quality Guidelines, as tabulated by Airclim. The 24-hour values are based on the 99th percentile, which allows about three to four exceedance days per year.
Notice that the old 2005 guideline of 10 µg/m³ now sits at interim target 4. A country that once counted as "meeting the standard" is now one step shy of the target, and several European capitals are in that position. Interim target 1, 35 µg/m³, is the level at which WHO says roughly 300,000 deaths a year worldwide could be avoided if it were met everywhere.
Why small islands win
Air pollution concentration depends on three things: how much is emitted, how fast the air moves, and what the weather does to the particles. Think of a bathtub with a tap running and a drain open. The water level is set by the balance between inflow and outflow. A city in a basin has the tap wide open and a partly blocked drain. A small island in the trade winds has a modest tap and a drain the size of an ocean.
In plain terms, wind arriving over thousands of kilometers of open water carries little of the sulfates, nitrates, and soot that cities and factories emit, so the incoming air is already close to clean. Local sources then add a small amount, and the wind removes it again within hours. That helps explain why Barbados, Bermuda, Puerto Rico, and French Polynesia sit at the top.
Natural particles still count. WHO notes that PM is a mix of sulfates, nitrates, ammonia, sodium chloride, black carbon, mineral dust, and water. Sea-salt aerosol and desert dust show up in the same measurement as soot, which is one reason even remote islands never read zero, and why a dust storm can push a clean region over the guideline for a few days.
Geography is not destiny, but it sets the baseline. A country with a similar ratio of people to open air can still lose its advantage by burning coal or wood for heat, which is the story in the next sections.
Where PM2.5 comes from, and why that decides who can get clean
Not all fine particles are the same, and the mix explains why some solutions work in one country and not another. WHO lists the main human sources as industrial smokestacks, household energy for cooking, heating, and lighting, transport (especially diesel vehicles), power generation, and the burning of municipal and agricultural waste.
Some particles are emitted directly, such as soot from a diesel engine or smoke from a wood stove. Others form in the air from gases. Sulfates and nitrates come from sulfur dioxide and nitrogen oxides released by burning fuel, and ammonium compounds come from ammonia, which the WHO fact sheet also names among PM components. A country can therefore improve its air by cleaning up power plants and still be left with particles from farms and home heating.
This matters for the ranking. A small island with no coal plants and few farms has few of these ingredients to begin with. A large continental country must tackle all of them at once, and each fix reaches a different slice of the problem.
How to read a PM2.5 number
A few quick calculations make the table easier to interpret.
- Multiples of the guideline. Divide the annual average by 5. Iceland's 3.7 is 0.74 of the guideline, meaning it is inside it. Germany's 9.4 is 1.9 times the guideline. Pakistan's 67.3 is 13.5 times.
- Distance to the target. The United Kingdom's 8.7 in 2025 is 3.7 µg/m³ above the guideline, a reduction of about 43 percent would be needed to reach it. Germany would need roughly a 47 percent cut.
- Year-to-year change. Denmark went from 7.2 to 8.2 µg/m³, a rise of about 14 percent. A change that size within one year is far more likely to reflect weather and monitoring than a policy shift.
In each case the answer says how far a place is from the guideline, not how risky any single day is. Daily limits are set separately, at 15 µg/m³ for a 24-hour average in the WHO guidelines.
Iceland: clean by design and by geography
Iceland is one of the few entries near the top where energy policy, not only wind, deserves some of the credit. Wikipedia's summary of the energy system, which draws on Icelandic sources, says that about 90 percent of homes are heated with geothermal energy and that, in 2025, electricity came 70.5 percent from hydropower, 29.4 percent from geothermal, and 0.1 percent from fossil fuels (Energy in Iceland). Without home heating or power plants burning fuel, two of the largest sources of fine particles elsewhere are nearly absent.
Iceland's annual PM2.5 was 3.7 µg/m³ in 2025 and 4.0 in 2024, according to IQAir.
Iceland also shows what clean averages hide. Eruptions on the Reykjanes Peninsula since late 2023 have released sulfur dioxide, a gas that irritates the nose, throat, and eyes and can trigger asthma. Gas is not PM2.5, but it shows how a country can have excellent annual particle numbers and still have bad days.
Australia and New Zealand: clean averages, severe fire seasons
Australia (4.4 µg/m³ in 2025) and New Zealand (5.1) owe much of their standing to the same ocean-air effect as the Caribbean. Both sit in the path of westerly winds that cross the Southern Ocean, and Oceania was IQAir's cleanest region in 2024, with 57 percent of its cities meeting the guideline.
The average conceals the fire problem. According to the University of Canberra, the 2019 to 2020 Black Summer fires burned about 19 million hectares, killed 33 people, and were linked to an estimated 417 additional deaths from smoke. About 10 million people were exposed to hazardous smoke, and Sydney, Canberra, and Melbourne recorded record-breaking air pollution (University of Canberra summary). A single fire season of that scale lifts a national annual average, yet Australia still posted 4.5 µg/m³ for 2024. Annual averages smooth extreme episodes, and the health risks from them are acute rather than chronic.
Nordic and Baltic countries: low density, but not zero
Estonia, Finland, Sweden, and Norway sit in the 4.9 to 6.2 µg/m³ range in 2025. These countries have large forested areas, low population density, and, in the cases of Sweden and Norway, electricity systems dominated by low-carbon sources. Even so, only Estonia is under 5 µg/m³ in the 2025 data; Finland (5.2) and Sweden (5.5) are just above.
The European Environment Agency (EEA) explains why a clean-energy country can still have particle pollution: domestic burning of solid fuels, such as wood stoves, is a more significant source of PM10 and PM2.5 in Europe than transport, with agriculture and industry also contributing. Across the European Union, 94 percent of the urban population is still exposed to PM2.5 above the WHO guideline, based on 2023 and 2024 data, though every country has reduced urban exposure since 2011 (EEA Air Quality Status Report 2025).
This is one reason heating policy matters as much as electricity policy. Replacing wood stoves with district heating or heat pumps, as explained in how heat pumps move heat efficiently, removes a source that a clean grid does not touch.
Big economies on the same scale
Large, populous economies cannot rely on ocean winds, so their numbers sit in a different band. The table shows how several compare, with 2025 and 2024 values from the same IQAir ranking.
| Country | 2025 PM2.5 (µg/m³) | 2024 PM2.5 (µg/m³) | Multiple of WHO guideline (2025) |
|---|---|---|---|
| USA | 7.3 | 7.1 | 1.5 |
| Canada | 7.4 | 6.7 | 1.5 |
| Denmark | 8.2 | 7.2 | 1.6 |
| United Kingdom | 8.7 | 7.4 | 1.7 |
| Spain | 9.1 | 8.7 | 1.8 |
| Belgium | 9.3 | 8.9 | 1.9 |
| Germany | 9.4 | 9.0 | 1.9 |
| France | 9.6 | 8.1 | 1.9 |
| Switzerland | 9.7 | 7.3 | 1.9 |
| Japan | 9.8 | 8.6 | 2.0 |
Source: IQAir ranking, 2025 and 2024 annual averages. The multiple is the 2025 value divided by 5 µg/m³.
Two patterns stand out. Every country in the table recorded a higher average in 2025 than in 2024, even though national emissions rarely jump in one year. That may point to weather, including wildfire smoke and stagnant winter air, as a major driver of year-to-year change, though the source does not say so. And the gap between a "clean" large country (about 7 µg/m³) and a small island (about 2.5 µg/m³) is a factor of nearly three, which no reasonable policy closes.
Related questions about national energy and emissions are explored in countries with the highest CO2 emissions and countries that run on the most renewable electricity.
The other end: the most polluted countries
For perspective, here are the 10 highest national averages in the same ranking.
| Rank (worst first) | Country | 2025 PM2.5 (µg/m³) | 2024 PM2.5 (µg/m³) | Multiple of WHO guideline (2025) |
|---|---|---|---|---|
| 1 | Pakistan | 67.3 | 73.7 | 13.5 |
| 2 | Bangladesh | 66.1 | 78.0 | 13.2 |
| 3 | Tajikistan | 57.3 | 46.3 | 11.5 |
| 4 | Chad | 53.6 | 91.8 | 10.7 |
| 5 | Democratic Republic of the Congo | 50.2 | 58.2 | 10.0 |
| 6 | India | 48.9 | 50.6 | 9.8 |
| 7 | Kuwait | 45.7 | 30.2 | 9.1 |
| 8 | Uganda | 43.0 | 41.0 | 8.6 |
| 9 | Egypt | 40.6 | 39.8 | 8.1 |
| 10 | Uzbekistan | 38.1 | 31.4 | 7.6 |
Source: IQAir, 2025 and 2024 annual averages. Multiples are 2025 values divided by 5 µg/m³.
The Chad entry is a good example of why these figures need caution. Its average dropped from 91.8 µg/m³ in 2024, when IQAir said it was more than 18 times the guideline, to 53.6 in 2025. That is a very large change for a national average, and it illustrates how much desert dust, fire seasons, and monitoring coverage can move a result.
India's 2025 average of 48.9 µg/m³ is among the highest for a large country. In 2024, IQAir said six of the nine most polluted cities in the world were in India, and named Byrnihat as the most polluted metro area at 128.2 µg/m³. By comparison, the cleanest metro area was Mayagüez, Puerto Rico, at 1.1 µg/m³, a gap of more than 100 times.
Why so little data from some of the most affected places
Africa has just one real-time, publicly accessible monitoring station for every 3.7 million people, according to IQAir's 2024 release. Where there are few monitors, national averages rest on satellite estimates, models, and low-cost sensors, which makes both the best and worst rankings less certain for those countries. Many people in the worst-affected regions are not measured at all.
What the numbers mean for health
This section summarizes what major institutions report. It is general information, not medical advice.
WHO estimates that ambient (outdoor) air pollution caused 4.2 million premature deaths worldwide in 2019, about 89 percent of them in low- and middle-income countries. Of those, 68 percent were from ischaemic heart disease and stroke, 14 percent from chronic obstructive pulmonary disease, 14 percent from acute lower respiratory infections, and 4 percent from lung cancer (WHO fact sheet). The breakdown shows that heart and blood vessels, not only the lungs, bear most of the harm.
A more recent estimate comes from the Health Effects Institute's State of Global Air 2025 report, which attributes 7.9 million deaths in 2023 to air pollution of all kinds, 86 percent of them from noncommunicable diseases, and finds that 36 percent of the world's population is exposed to PM2.5 above 35 µg/m³ (State of Global Air). The two numbers differ because they cover different years and different pollutants, and estimation methods are revised between editions.
The practical meaning of a low PM2.5 average is that long-term exposure is lower. It does not mean that every day is safe for every person, and it says nothing about ozone, nitrogen dioxide, pollen, or indoor air.
Outdoor and indoor air are different problems
Household air pollution from cooking with polluting fuels was responsible for an estimated 2.9 million deaths in 2021, according to WHO's household air pollution fact sheet. About 2.1 billion people cook with polluting fuels, roughly a quarter of the global population. A country can have fairly clean outdoor air and severe indoor pollution at the same time, and the reverse is also possible.
A success story: how Beijing cut its particle levels
Not every improvement comes from geography. Beijing's government reports that the city's annual average PM2.5 was 32 µg/m³ in 2023, up slightly from 30 µg/m³ in 2022, and that PM2.5 was 64.2 percent lower than in 2013 (Beijing municipal government). That is still more than six times the WHO guideline, so the result is a large improvement from a very high starting point, not clean air by WHO standards.
The example shows that emission policy works, even in a dense city, and that the pace of improvement depends on how many sources a government is willing to tackle. A similar logic applies to energy systems more broadly. See, for example, countries with the most electric vehicles for the transport side and countries with the most wind power capacity for the power side.
Urban versus national averages
National averages are population-weighted summaries and can hide a lot. A country with clean rural areas and one polluted capital can post a good national number. IQAir's own data show the contrast at the extremes: Mayagüez at 1.1 µg/m³ and Byrnihat at 128.2 µg/m³ are both real places in the same global ranking.
Cities also generate their own conditions. Buildings, traffic, and trapped heat change how pollution accumulates, as described in why cities create heat islands. Where people live at high density, the same emissions affect more lungs, a point also visible in rankings such as countries with the highest population density.
Common misconceptions about "cleanest air" rankings
"The cleanest country has the best environmental policy." Not necessarily. Several leaders are islands with small populations and little industry. Their position says more about wind and size than about regulation.
"A low national average means every city is clean." National figures can hide polluted cities, and even clean places have fire, dust, or volcanic days.
"PM2.5 is the whole story." It is the best-studied single metric, but ozone, nitrogen dioxide, sulfur dioxide, and indoor pollution also matter for health.
"Rankings are precise." Different networks, calibrations, and satellite models can place a country a few places apart. Differences of 0.1 or 0.2 µg/m³ are within noise.
"Clean air today means clean air tomorrow." Climate change is expected to affect wildfire risk in some regions, which can reverse gains in a single season, as the Black Summer in Australia showed.
Frequently asked questions
Q: Which country has the cleanest air in the world? A: In IQAir's 2025 ranking, the lowest national-level average belongs to French Polynesia at 1.8 µg/m³ of PM2.5, followed by Puerto Rico (2.4), the U.S. Virgin Islands (2.5), and Barbados (2.6). Among sovereign countries, Barbados and Iceland (3.7) are the cleanest. Territories are ranked alongside countries in the IQAir list.
Q: What is PM2.5 and why is it dangerous? A: PM2.5 is particulate matter 2.5 micrometers in diameter or smaller. These particles are small enough to travel deep into the lungs and enter the bloodstream. WHO links them to cardiovascular and respiratory disease and cancers. About 68 percent of the 4.2 million ambient air pollution deaths WHO estimated for 2019 were from ischaemic heart disease and stroke.
Q: What is the WHO guideline for PM2.5? A: The 2021 WHO guideline is 5 µg/m³ as an annual average and 15 µg/m³ as a 24-hour average. Before 2021, the annual guideline was 10 µg/m³. WHO also publishes interim targets of 35, 25, 15, and 10 µg/m³ for the annual average, meant for countries well above the guideline.
Q: How many countries meet the WHO guideline? A: It depends on whether territories count. IQAir's 2024 report named seven countries (Australia, the Bahamas, Barbados, Estonia, Grenada, Iceland, and New Zealand) and said 126 of 138 countries and regions exceeded the guideline. For 2025, IQAir reports 13 countries, regions, and territories meeting it.
Q: Does having clean air mean a country is environmentally sustainable overall? A: No. Air quality captures only one dimension. A country can have excellent PM2.5 readings and high per-capita greenhouse gas emissions, or large forests and poor urban air. Emissions, land use, water, and biodiversity each need their own measures.
Q: Why are South Asian countries so polluted? A: IQAir lists Pakistan, Bangladesh, and India among the six highest national averages in 2025. The causes include dense populations, combustion of fuels for power, transport, and cooking, and regional weather that traps pollution at times of year. The data do not apportion the share of each source, and the regional sources vary by season and location.
The takeaway
The cleanest air belongs to places where geography does most of the work: small islands in steady ocean winds, and a few low-density countries with clean heating and power. That is why Iceland, a country that did build a clean energy system, is nearly alone among industrial economies at the top. For everyone else, the WHO guideline of 5 µg/m³ is a long-term target rather than a current reality, and the main lever is cutting the combustion of coal, wood, diesel, and agricultural waste. The gap between the cleanest and dirtiest places, more than 100 times at the city level, is a reminder that what people breathe is as much about development and energy access as about the weather.
Sources
- IQAir, World Air Quality Report and 2024 press release
- WHO, Ambient (outdoor) air quality and health and Household air pollution and health
- Health Effects Institute, State of Global Air 2025
- European Environment Agency, Air quality status report 2025
- Beijing Municipal Government, 2023 air quality report
Related Reading
Follow new articles
Add SciHub101 to your feed reader to see new science and technology stories.
About the Author
SciHub101 is an independent science and technology publication founded and edited by Buğra Sözeri, a software engineer and app developer based in Türkiye. AI tools assist with drafting and research. Source documentation in the existing archive is uneven, and articles are being reviewed and corrected. The Editorial Team byline identifies editorial responsibility; it does not certify specialist or independent human review. Where we compare products, anything built by our own team is labelled as such — see the editorial guidelines and About page for how corrections and disclosures work.
Related Articles
Countries With the Highest CO₂ Emissions: Territorial, Per Capita and Historical
Which countries emit the most carbon dioxide depends on how you count. This ranking uses Global Carbon Project data for 2024 and compares annual territorial emissions, per-person emissions, emissions embedded in trade, and cumulative emissions since the industrial revolution.
Top Wheat Producing Countries in the World (2026)
Wheat feeds more people than any other cereal crop and underpins global food security. This ranking uses USDA and FAO data to show which countries grow the most wheat, which ones export it, and why the two lists look so different.
Machine Learning for Air Quality: Turning Sensor Data into Actionable Pollution Intelligence
ML models are combining data from satellites, low-cost sensors, and weather systems to produce real-time air quality maps far more detailed than official monitoring networks.
Countries With the Most Forest Cover (2025)
Forests cover 4.14 billion hectares, about 32% of the world's land, per FAO's 2025 assessment. Russia, Brazil, Canada, the United States and China hold more than half. Ranked by area and by share of land, with what the numbers miss.
Countries That Generate the Most Plastic Waste (2025 Ranked)
The United States generates more plastic waste per capita than any large nation — 130 kg per person per year. But the Philippines, Indonesia, and India contribute the most plastic to the ocean. How you rank countries on plastic pollution depends entirely on whether you measure production, per-capita waste, or ocean contribution.
Countries with the Most Freshwater Resources (Ranked)
Brazil has the world's largest total renewable freshwater resources — approximately 8,647 cubic kilometers per year, more than any other country and roughly 20 percent of the global total. Russia is second at 4,525 km³/year, Canada third at 2,860 km³/year. But total volume is only part of the story: Canada's per-capita freshwater availability is 36 times higher than China's. And water stress — not total availability — is the defining water challenge of the twenty-first century. This ranking covers the top 20 countries by total renewable freshwater resources, sourced from FAO AQUASTAT, with per-capita comparison and analysis of global water scarcity.