Countries That Generate the Most Plastic Waste (2025 Ranked)
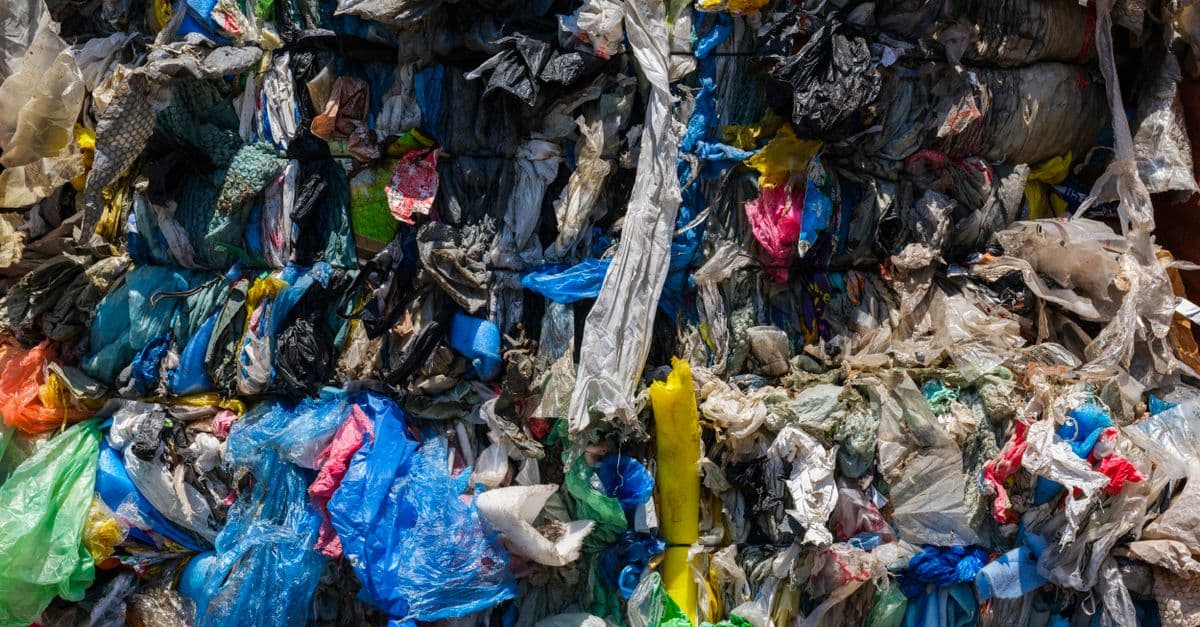
Photo: Engin Akyurt / Pexels
The world produces approximately 430 million tonnes of plastic per year, and roughly 10 million tonnes enters the ocean annually — where it breaks into microplastics now detectable in human blood, Arctic ice, and the deepest ocean trenches. Which country is responsible depends entirely on the metric. The US is the per-capita leader. The Philippines and India top the ocean contribution rankings. China dominated total production for decades but is actively reducing it. Understanding these distinctions is essential to any serious conversation about solutions.
Key takeaways
- The United States generates the most plastic waste in absolute terms among wealthy nations and the most per capita (~130 kg/person/year) — but most is landfilled, not reaching the ocean.
- Philippines, India, Malaysia, China, and Indonesia contribute the most plastic to the ocean — because they generate large volumes and have inadequate waste management infrastructure.
- Mismanaged plastic waste (not collected or inadequately disposed) is the key variable for ocean pollution — not total production.
- The Global Plastics Treaty negotiations are ongoing: a legally binding international agreement to reduce plastic production is expected by 2025–2026.
- Only 9% of all plastic ever produced has been recycled; 12% has been incinerated; 79% has accumulated in landfills or the natural environment.
How this data is measured — and why it matters
Mismanaged plastic waste — plastic that is littered, burned in open pits, dumped in uncontrolled sites, or left adjacent to waterways — is the concept that bridges total production and ocean pollution. A country can generate enormous volumes of plastic and contribute almost none to the ocean (the US, Germany) or generate moderate volumes and send a disproportionate share into the sea (Philippines, Bangladesh).
The primary academic source for ocean plastic contribution estimates remains the landmark 2015 paper by Jambeck et al. in Science, which modelled ocean plastic input from 192 coastal countries using waste generation data and coastal population proximity. The OECD's Global Plastics Outlook (2022) updated national production and waste figures. Our World in Data synthesises both data streams into the most accessible public database.
Crude plastic waste generation is estimated by multiplying per-capita plastic use (from industry and trade data) by population. The figures carry uncertainty ranges of 10–30% for most countries, and even larger for nations with limited formal waste tracking.
Three separate metrics — total waste generated, per-capita waste generated, and ocean plastic contribution — produce three completely different country rankings. All three are real. Selecting only one to make a rhetorical point is how the same facts get weaponised in opposite directions.
Source: Jambeck et al. (2015), Science — "Plastic waste inputs from land into the ocean" — the foundational quantitative model for ocean plastic contribution by country.
Source: OECD Global Plastics Outlook (2022) — national plastic production, use, and waste generation data across OECD and key non-OECD economies.
Countries generating the most total plastic waste
(Million tonnes per year, total)
| Rank | Country | Total plastic waste (Mt/year) | Per capita (kg/year) |
|---|---|---|---|
| 1 | United States | 42.0 | 130 |
| 2 | India | 26.3 | 19 |
| 3 | China | 21.6 | 15 |
| 4 | Brazil | 11.3 | 53 |
| 5 | Indonesia | 9.1 | 34 |
| 6 | Germany | 6.1 | 73 |
| 7 | United Kingdom | 5.6 | 82 |
| 8 | Russia | 5.0 | 35 |
| 9 | Mexico | 4.1 | 32 |
| 10 | Japan | 4.0 | 32 |
| 15 | Philippines | 3.5 | 32 |
| 20 | France | 3.3 | 50 |
Source: OECD Global Plastics Outlook (2022), national waste tracking data.
Countries contributing most plastic to the ocean
(Estimated tonnes/year entering ocean)
| Rank | Country | Ocean plastic (tonnes/year) | Mismanaged waste % |
|---|---|---|---|
| 1 | Philippines | 356,000 | High |
| 2 | India | 327,000 | High |
| 3 | Malaysia | 245,000 | High |
| 4 | China | 230,000 | Medium-high (improving) |
| 5 | Indonesia | 196,000 | High |
| 6 | Brazil | 106,000 | Medium |
| 7 | Vietnam | 89,000 | High |
| 8 | Bangladesh | 74,000 | High |
| 9 | Thailand | 67,000 | Medium |
| 10 | Nigeria | 65,000 | High |
| ~50 | United States | 32,000 | Low (mostly managed) |
Source: Jambeck et al. (2015), Science; updated with OECD data and national waste management surveys.
Why the US leads production but not ocean pollution
The disconnect between total waste generation and ocean contribution comes down to a single variable: waste management infrastructure.
In the United States, nearly all generated plastic waste is collected and either landfilled (~76%), incinerated (~16%), or recycled (~9%). Landfill and incineration are not ideal outcomes for the climate or long-term land use, but they prevent plastic from reaching waterways and oceans. The US's ocean plastic contribution — approximately 32,000 tonnes per year — is lower than Cambodia's despite the US generating more than 1,000 times more total waste.
In the Philippines, India, Indonesia, and Bangladesh, large proportions of plastic waste are uncollected — not because individuals choose to litter, but because formal waste collection systems do not exist across significant portions of the population. Rural areas in many South and Southeast Asian countries have no waste collection service whatsoever. When plastic accumulates with no formal disposal pathway, it ends up burned in open pits, dumped near rivers, or left at informal sites that flood into waterways during monsoon season.
The Philippines is a useful case study. It generates roughly 3.5 million tonnes of plastic waste per year — a fraction of the US total — but contributes an estimated 356,000 tonnes to the ocean annually, roughly 11 times more than the US. Its coastline is dense with population, its river systems are numerous, and its waste management infrastructure is severely underfunded relative to its plastic consumption, which has grown rapidly with economic development and aggressive packaging by multinational consumer goods companies.
Think of it like a city water system: a city that generates enormous volumes of wastewater but has an effective sewage treatment plant discharges little pollution. A smaller city with no sewage system contaminates its river with far less volume. The plastic waste crisis is, in this sense, primarily an infrastructure and governance crisis.
A deeper look at the top ocean polluters
Philippines
The Philippines is an archipelago of 7,641 islands with over 36,000 km of coastline — the fifth-longest in the world. This geography means that any mismanaged plastic is at high risk of reaching the sea. The sachet economy compounds the problem: a large proportion of the population buys consumer goods in single-use sachets (shampoo, coffee, condiments) because the upfront cost of larger containers is beyond reach. These sachets — made of multi-layer plastic laminate — are entirely unrecyclable under any current technology. Studies of Manila Bay consistently find these sachets as the dominant type of marine litter.
Source: Our World in Data / Jambeck et al. (2015) — Philippines ocean plastic contribution estimates.
India
India's 26.3 million tonnes of annual plastic waste make it the second-largest absolute generator after the US. Its ocean contribution (327,000 tonnes/year) is driven by a combination of enormous coastal population, high rates of mismanaged waste in lower-income urban and rural areas, and the fact that several major river systems — the Ganges, Godavari, Krishna — discharge into the ocean and carry significant plastic loads. India has implemented a national ban on specific single-use plastics since 2022, though enforcement varies substantially by state.
Source: OECD Global Plastics Outlook (2022) — India national waste figures.
China
China was the world's largest ocean plastic contributor as recently as 2015. Significant investment in waste management infrastructure since then — including collection expansion, incineration capacity, and formal recycling systems — has reduced its ocean contribution substantially. China's shift from "medium-high" to "improving" in mismanaged waste metrics is one of the more significant positive developments in global plastic pollution data over the past decade, though its total plastic production remains enormous.
Malaysia
Malaysia's high ocean contribution relative to its population and waste volumes reflects a specific dynamic: it became a destination for plastic waste exported from the US, EU, Japan, and Australia after China's 2018 National Sword policy banned those imports. Overwhelmed processing facilities and unscrupulous operators led to significant illegal dumping adjacent to waterways. Malaysia has since tightened import controls, but the episode revealed how "recycling" exports can simply shift plastic mismanagement to lower-income countries.
The recycling myth
Recycling numbers are widely misunderstood. When the US or UK reports "recycling rates," these figures typically measure plastic collected for recycling — not plastic that is actually recycled. Collection and actual reprocessing are different things, separated by sorting, washing, and finding buyers for the output.
From 2016 to 2018, much of the plastic collected for recycling in wealthy nations was shipped to China under a system that appeared to function until China's National Sword policy banned low-quality plastic imports in 2018. After the ban, collected plastic flowed to Malaysia, Vietnam, and Thailand — where a significant proportion was improperly managed at overwhelmed facilities.
The true global recycling rate for plastic — the percentage actually processed back into usable material — is approximately 9%. This number has barely moved since the 1990s despite decades of recycling campaigns. This is not primarily a consumer behaviour problem. Most plastic packaging is not technically recyclable at scale: the economics of collecting, sorting, cleaning, and reprocessing most plastic types simply do not work. Multi-layer packaging, flexible film, polystyrene foam, and PVC are technically recyclable in laboratory settings but economically unviable in commercial systems.
The "chasing arrows" recycling symbol, stamped on virtually every piece of plastic, was designed by the plastics industry. The numbers 1–7 inside the symbol denote resin type, not recyclability. Symbols 3 (PVC), 6 (polystyrene), and 7 (other) are rarely accepted in municipal recycling streams anywhere in the world.
The microplastics crisis
Even properly managed plastic creates a permanent, irreversible problem: microplastics. All plastic, over time, physically degrades into smaller and smaller fragments — but does not chemically decompose. The polymer chains remain intact regardless of fragment size. For the wider picture, see the plastic pollution crisis explained.
Microplastics are particles under 5 mm in diameter. Nanoplastics are under 1 micron — small enough to cross cell membranes and the blood-brain barrier. Both are now:
- Found in every sample of ocean water ever tested
- Detected in human blood, lungs, liver, placenta, and breast milk
- Present in remote Arctic and Antarctic ice cores
- Measured in rainfall globally, including over the Pyrenees mountains and the Rocky Mountains
- Found in the Mariana Trench, the deepest point in the ocean
A 2022 study published in Environment International detected microplastics in the blood of 77% of a sample of healthy adult donors in the Netherlands. Health effects are not yet fully characterised, but preliminary research suggests potential endocrine disruption, inflammatory response, and cellular damage from both plastic particles and the chemical additives (plasticizers, flame retardants, stabilizers) that leach from them.
The plastic that entered the ocean in the 1960s is still there, still fragmenting. There is no known mechanism that removes microplastics from the ocean at meaningful scale.
Source: Leslie et al. (2022), Environment International — "Discovery and quantification of plastic particle pollution in human blood."
Historical context: how we got here
Commercial plastic production began at scale in the 1950s. Global annual production was approximately 2 million tonnes in 1950; it reached 430 million tonnes by 2023 — a 215-fold increase in 70 years. For comparison, global steel production grew roughly 8-fold over the same period.
The explosive growth was driven by plastic's unique combination of properties: cheap to produce from petrochemical feedstocks, lightweight, durable, mouldable into any shape, and chemically resistant. Plastic packaging replaced glass, metal, and paper across almost every consumer goods category through the 1960s–1980s because it was simply cheaper per unit.
The "convenience" economy — single-serve packaging, disposable utensils, individually wrapped portions — was architecturally designed around cheap plastic. The Coca-Cola Company's shift from glass refillable bottles to single-use PET bottles in the 1980s exemplifies the pattern: producers externalised the end-of-life cost onto consumers, municipalities, and ultimately the environment.
The internal documents of major plastic producers, revealed through litigation in the 2020s, show that industry leaders knew by the 1970s that recycling was not economically viable at scale for most plastic types — and promoted recycling messaging anyway as a strategy to forestall regulation. This history is detailed in academic research by Gabbatiss and others and is central to current treaty negotiations.
Policy responses: what is actually being done
Single-use plastic bans: The EU banned single-use plastic items (straws, cutlery, cotton buds, balloon sticks, certain food containers) under Directive 2019/904, effective from 2021. Similar bans now exist in over 60 countries, though enforcement quality varies widely. Kenya has one of the world's strictest plastic bag bans, with criminal penalties for violations. Bangladesh banned polythene bags in 2002 — an early adopter whose enforcement has been inconsistent.
Source: European Commission (2021) — EU Single-Use Plastics Directive enforcement data.
Extended Producer Responsibility (EPR): EPR policies require plastic producers to finance end-of-life collection and recycling. The logic: if producers pay for disposal, they have a financial incentive to design products that are actually recyclable. The EU has implemented EPR for packaging; Japan has long had producer take-back schemes; several Canadian provinces have adopted EPR frameworks. The key design question is whether the fees are high enough to actually fund the infrastructure or are simply compliance costs passed to consumers.
Global Plastics Treaty: UN member states began formal negotiations for a legally binding global plastics agreement in 2022. The treaty, if concluded, could be the most significant environmental agreement since the Paris Climate Accords. The central dispute is whether the treaty should cap plastic production (which would affect oil companies and petrochemical producers) or focus only on waste management and pollution. A coalition of oil-producing nations and plastic industry interests has resisted production caps. Negotiations have extended beyond the original 2024 deadline.
China's waste management expansion: China has invested substantially in domestic waste management infrastructure since 2016, including expansion of incineration capacity (contentious on air quality grounds) and formal waste collection systems. Its ocean plastic contribution has declined measurably as a result. This is the clearest example that infrastructure investment directly reduces ocean plastic regardless of production volumes.
What this data reveals about inequality
Plastic pollution is inseparable from global economic inequality. The countries contributing most plastic to the ocean are generally the same countries where:
- Per-capita income is too low to fund comprehensive waste management infrastructure
- Consumer goods companies market aggressively to large populations using unrecyclable single-use packaging
- Formal waste collection does not reach rural and peri-urban populations
The countries generating the most plastic per capita — the US, Germany, the UK — are precisely the countries with enough infrastructure to contain most of the damage. They export the visible pollution problem to lower-income nations while remaining the largest consumers of the plastic products creating it.
This dynamic is not accidental. It is the predictable outcome of pricing systems that make plastic production cheap while externalising the collection, treatment, and remediation costs onto others. Extended producer responsibility, production caps, and international funding for waste infrastructure in developing nations are all attempts to correct this externality.
Frequently asked questions
Q: Can plastic ever be fully recycled? A: Current mechanical recycling processes only handle certain plastic types efficiently — primarily PET (bottles) and HDPE (rigid containers). Chemical recycling, which breaks plastic back into monomers or fuel, is technically feasible but currently expensive and energy-intensive relative to making virgin plastic. No current commercial technology makes all plastic types economically recyclable. Scalable solutions require both better product design — less plastic, single-material packaging — and significant reduction at the production source.
Q: Is biodegradable plastic the solution? A: Most "biodegradable" plastics require industrial composting conditions — high temperature, specific humidity, defined microbial populations — to actually degrade. They do not break down in oceans, rivers, or standard home compost bins. Compostable plastics can contribute to the solution for food-contact packaging where industrial composting infrastructure exists and is used. Replacing conventional plastic with bioplastics does not solve the microplastics or ocean pollution problem unless paired with proper collection infrastructure.
Q: What plastics are most problematic? A: Single-use flexible packaging — wrappers, film, plastic bags — is the most problematic category. It is the hardest to sort and recycle, lightweight enough to blow into waterways, and produced in enormous volumes. Plastic bags and abandoned fishing gear are the most commonly found items in ocean cleanups. Ghost gear (abandoned nets and lines) accounts for approximately 46% of the Great Pacific Garbage Patch by weight, according to research by The Ocean Cleanup and others.
Q: Does ocean plastic cleanup actually work? A: Large-scale ocean cleanup projects — most prominently The Ocean Cleanup's systems deployed in the Pacific — can collect surface plastic, but the quantities removed are small relative to the ongoing input. The fundamental problem is that removing plastic from the ocean treats the symptom while the source continues. Prevention — keeping plastic from entering the ocean in the first place — is several orders of magnitude more cost-effective per tonne than extraction. Cleanup efforts are valuable for specific contexts (river interception before plastic reaches the ocean) but are not a primary solution.
Q: Which countries are improving the most? A: China's measurable reduction in ocean plastic contribution is the most significant improvement over the past decade, driven by infrastructure investment. Several Southeast Asian nations have introduced policies post-Malaysia waste import scandal. The EU's Single-Use Plastics Directive is reducing the specific categories it targets. Rwanda and Kenya have some of the world's most effective plastic bag bans. Progress is real but fragmented — there is no coordinated global system yet.
Q: How much plastic is in the ocean total? A: Current estimates place the total stock of plastic in the global ocean at approximately 150–200 million tonnes, accumulated since the 1960s. This figure is inherently uncertain because the vast majority of ocean plastic sinks below the surface or is present as microplastics too small to directly count. The Great Pacific Garbage Patch alone contains an estimated 79,000 tonnes of floating plastic across 1.6 million km² — about twice the size of Texas.
Sources
Source: Jambeck, J.R. et al. (2015) — "Plastic waste inputs from land into the ocean," Science, 347(6223). The foundational quantitative model for ocean plastic contribution by country.
Source: OECD (2022) — Global Plastics Outlook: Economic Drivers, Environmental Impacts and Policy Options. National production, waste, and management data.
Source: Our World in Data / Hannah Ritchie (2023) — Plastic pollution dataset synthesising Jambeck, OECD, and national sources.
Source: Leslie, M.A. et al. (2022) — "Discovery and quantification of plastic particle pollution in human blood," Environment International, 163.
Source: European Commission (2021) — Single-Use Plastics Directive (EU) 2019/904 implementation reports.
The takeaway
Plastic pollution is a crisis where the numbers look different depending on which metric you choose. The US is the per-capita champion of waste generation; the Philippines and India contribute far more to ocean pollution because their waste management infrastructure cannot handle the volumes. The global recycling rate of 9% — after 70 years of the plastic age and decades of consumer recycling campaigns — is a systemic failure, not a consumer behaviour problem. The evidence points toward a structural set of solutions: reducing plastic production at source, designing packaging that is actually recyclable, building waste infrastructure in lower-income nations, and making producers financially responsible for end-of-life costs. All of these interventions are technically and economically feasible. Whether they are politically feasible is a different question.
Read next:
Follow new articles
Add SciHub101 to your feed reader to see new science and technology stories.
About the Author
SciHub101 is an independent science and technology publication founded and edited by Buğra Sözeri, a software engineer and app developer based in Türkiye. AI tools assist with drafting and research. Source documentation in the existing archive is uneven, and articles are being reviewed and corrected. The Editorial Team byline identifies editorial responsibility; it does not certify specialist or independent human review. Where we compare products, anything built by our own team is labelled as such — see the editorial guidelines and About page for how corrections and disclosures work.
Related Articles

Countries with the Most International Students (2025 Ranked)
The United States hosts over 1 million international students — the most of any country. The UK hosts 680,000. China has become the world's second-largest destination. International students contribute $40 billion annually to the US economy alone.

Countries with the Lowest Birth Rates (2025 Ranked)
South Korea has a total fertility rate of 0.72 — the lowest ever reliably recorded for any country in human history. At that rate, each generation is roughly one-third the size of its predecessor. Japan has been below replacement level since 1975. Here are the countries with the lowest birth rates and what the data actually means.
The Amazon Rainforest: Earth's Lungs Explained by Science
The Amazon is not Earth's oxygen factory, but it stores vast carbon and recycles rain across a continent. Here is what the evidence says about deforestation, drought, and tipping points.
Countries with the Most Desert Land (2025 Ranked)
Russia has the most desert and dryland by total area. But Australia has the highest percentage of desert territory at 35%. The Sahara covers 11 countries. Desertification is advancing at 12 million hectares per year — an area the size of England lost annually to spreading desert. Here's the full ranking and the crisis of expanding deserts.

Countries That Waste the Most Food (2025 Ranked)
Australia wastes 312 kg of food per person per year — the most in the world. The US wastes 80 million tonnes annually. Globally, one-third of all food produced is lost or wasted — enough to feed every hungry person on Earth twice over. Here's the full picture of global food waste and what the most effective interventions are.

The Carbon Footprint of AI: Energy per Query, Data Center Costs, and Comparisons
A typical text prompt to a current AI chatbot uses a fraction of a watt-hour, but billions of prompts, plus training runs and data center cooling, add up to a real slice of global electricity. This article sorts measured figures from folklore: energy per query, training costs, water, emissions, and how AI compares with other everyday loads.