The Plastic Pollution Crisis Explained
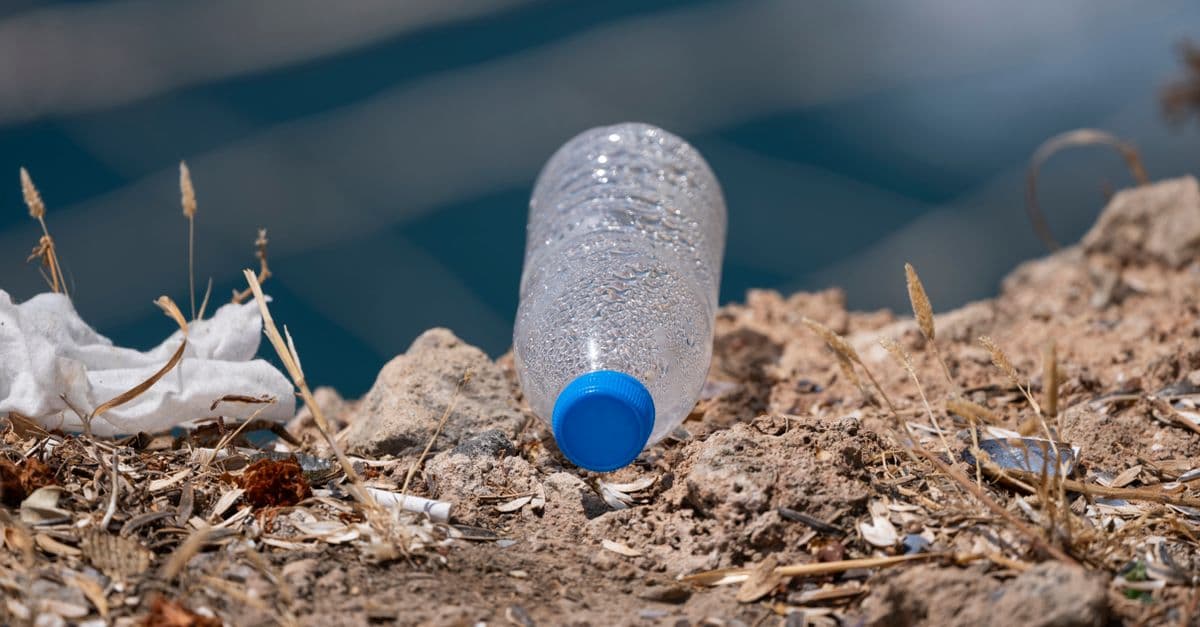
Photo: Engin Akyurt / Pexels
Humanity produces about 400 million tonnes of plastic per year. We throw most of it away. Some gets recycled, some gets burned, some sits in landfills, but a significant portion escapes into the environment — finding its way to oceans, soils, food, and even our bloodstreams. Here's the science of plastic pollution, the real numbers, and the realistic paths forward.
The scale problem
Plastic was a wonder material when it became widely commercial in the 1940s and 50s. Cheap, durable, lightweight, infinitely shape-able. The growth has been exponential:
- 1950: ~2 million tonnes/year
- 2000: ~200 million tonnes/year
- 2024: ~400 million tonnes/year
- 2050 (projected): ~1 billion tonnes/year
About 50% of all plastic produced today is single-use — bags, bottles, packaging. Used for minutes, lasts for centuries.
Where plastic ends up
Roughly:
- 40% landfill (still the dominant disposal method).
- 25% incinerated (releasing CO₂ and toxins).
- 9% recycled (genuinely recycled, accounting for losses).
- 22% mismanaged — escaped into the environment.
The "mismanaged" portion is the source of ocean and environmental plastic pollution.
How plastic gets into the ocean
Most ocean plastic comes from a few sources:
Rivers
About 80% of ocean plastic enters via rivers. The most polluted rivers (mostly in Asia) carry vast amounts. Ten rivers worldwide are estimated to contribute roughly 90% of river-borne plastic.
Fishing industry
Lost or abandoned fishing gear — "ghost nets" — make up an estimated 10-46% of the Great Pacific Garbage Patch by mass.
Coastal litter
Plastic dropped on beaches, blown into water, or carried by storm runoff.
Direct dumping
Some still happens despite regulations.
The Great Pacific Garbage Patch
Often pictured as a floating island. Reality: a vast area where ocean currents concentrate plastic into a "soup" — mostly small fragments and microplastics, plus larger debris.
- Twice the size of Texas (~1.6 million km²).
- An estimated 1.8 trillion pieces of plastic.
- Half of it (by mass) is fishing gear.
There are five major garbage patches in the world's oceans, each at a major ocean gyre.
Microplastics — the bigger problem
While visible plastic gets attention, microplastics — particles smaller than 5mm — are the more pervasive problem.
Sources
- Primary — manufactured small (microbeads in cosmetics, industrial pellets).
- Secondary — fragmentation of larger plastic from sun, waves, abrasion.
- Tyre wear — the largest single source of microplastics in many regions.
- Synthetic textiles — washing machine effluent.
Where they're found
- Ocean water (essentially everywhere sampled).
- Drinking water (tap, bottled, both).
- Air (you inhale them daily).
- Food (especially seafood, salt, beer).
- Soil (agricultural and natural).
- Human blood (confirmed in 2022).
- Human placentas, lungs, breast milk, semen.
Health effects and mechanisms
This is the most active area of research. Concerns include:
- Inflammation — small particles in tissue can cause local immune response. When microplastics enter the bloodstream, immune cells (macrophages) attempt to engulf them, triggering cytokine release and systemic inflammation. This is measurable but long-term health impact remains unclear.
- Endocrine disruption — some plastic chemicals (phthalates, BPA) mimic hormones and can interfere with reproductive and developmental processes, particularly during critical windows. BPA is particularly concerning and has been restricted in many products, though alternatives (like BPF) may have similar effects.
- Carriers for other toxins — microplastics absorb persistent organic pollutants (POPs) like PCBs and DDT from seawater, concentrating them up to 1 million times higher than surrounding water. When consumed, microplastics can release these toxins into tissues.
- Lung exposure — microplastics from tire wear and synthetic textiles are inhaled daily. Particles <2.5 microns can penetrate deep into alveoli, triggering respiratory inflammation and potentially entering the bloodstream.
- Gastrointestinal penetration — evidence suggests that the smallest microplastics (<1 micron) can cross the gastrointestinal epithelium, entering the bloodstream and potentially reaching organs including the brain.
- Long-term effects — largely unknown; research ongoing. Studies in animals show dose-dependent effects on liver function, inflammation, and behavior. Human epidemiological data is still limited.
A landmark 2024 study in the New England Journal of Medicine found that people with microplastics detected in their bloodstream had significantly elevated risk of cardiovascular events (heart attack, stroke, death) compared to those without detectable microplastics. While this doesn't prove causation, it suggests microplastics are not inert — they are biologically active in humans.
Source: Leslie, H. A., et al. (2022) "Discovery and Quantification of Plastic Particle Pollution in Human Blood." Environmental International, 163, 107199 — First study documenting microplastics in human blood, reporting median concentration of 1.6 μg/mL across the cohort examined.
Pathways: How Microplastics Enter Your Body
Understanding how microplastics reach humans is critical to assessing risk. There are three primary exposure routes, each with distinct mechanisms and cumulative effects.
Ingestion through food and water. The most studied pathway involves consuming food and beverages contaminated with microplastics. Drinking water — both tap and bottled — contains microplastics at varying concentrations. A 2018 study found an average of 10.4 microplastics per liter in bottled water, compared to 4.3 per liter in tap water, though this varies significantly by region and source. Shellfish like mussels, oysters, and clams filter massive volumes of seawater and concentrate microplastics; a typical serving of mussels contains 300-680 microplastic particles. Sea salt used in cooking contains approximately 600 microplastics per kilogram. Beer, honey, and sugar also show detectable microplastic concentrations. The cumulative ingestion pathway is substantial — estimates suggest adults consume 39,000 to 52,000 microplastic particles annually through food and water, rising to 109,000 particles if consuming only bottled water.
Source: Schwabl, P., et al. (2019) "Detection of Various Microplastics in Human Stool." Annals of Internal Medicine, 171(7), 453-457 — Study confirmed microplastics pass through the gastrointestinal tract intact, appearing in human feces.
Inhalation from air. Tire wear is the single largest source of microplastic particle emissions in most regions. As tires degrade on roads, they shed microplastics that become airborne; a typical car tire releases roughly 0.55 mg per kilometer driven. Synthetic textiles shed microfibers during washing and wear — an average fleece jacket sheds 1.7 grams of microfibers per wash cycle. Deteriorating building materials, artificial turf fields, and industrial processes release additional airborne particles. Research using atmospheric samplers has detected microplastics in every air sample tested, with urban areas showing 3-10x higher concentrations than rural locations. Because these particles are typically <10 micrometers, they are readily inhaled deep into the lungs where they can lodge in alveolar tissue. The annual inhalation burden is estimated at 7,000-131,000 particles per person depending on lifestyle and location, with urban dwellers at the higher end.
Source: Braun, T., et al. (2023) "Microplastics Penetrate the Alveolar Epithelial Barrier and Interact with Immune Cells." Nature Nanotechnology, 18(9), 1018-1026 — Demonstrated that submicrometer particles (<1 μm) can penetrate the airway epithelium and accumulate in lung tissue over time.
Dermal absorption and occupational exposure. Workers in plastics manufacturing, textile production, and waste management show elevated microplastic burdens compared to the general population. Skin contact with plastic fibers can lead to transdermal penetration, particularly through abraded or damaged skin. Personal care products containing microbeads (though largely banned in developed countries) provided another direct exposure route. Cosmetics, toothpastes, and exfoliants were historically formulated with polyethylene microbeads — a typical cosmetic product might contain 2-8% by volume of microplastics. This pathway is declining due to regulatory bans but remains significant in regions without such legislation.
Source: Prata, J. C., et al. (2020) "Environmental Exposure to Microplastics: An Overview on Possible Human Health Effects." Science of The Total Environment, 702, 134455 — Comprehensive review of absorption mechanisms and estimated body burdens across exposure pathways.
Economic Burden and Hidden Costs
The health burden of plastic pollution translates into significant economic costs that are often externalized — not paid by producers or governments, but absorbed by healthcare systems and individuals.
Direct healthcare costs. A 2024 World Health Organization working paper estimated that the current health burden from plastic pollution (primarily from microplastics and plastic chemical additives like BPA) costs the global economy approximately $370 billion annually in direct medical expenses — hospital admissions, emergency care, medications for inflammation-related diseases, cardiovascular treatments. This is comparable to the annual healthcare cost of tobacco-related diseases. These costs are distributed unevenly: high-income countries with aging populations bear higher absolute costs due to cumulative microplastic accumulation and higher utilization of healthcare services, while low-income countries bear disproportionate environmental costs (rivers, coastal zones) relative to their healthcare infrastructure.
Productivity losses. Chronic inflammation and cardiovascular effects associated with microplastic exposure reduce workforce productivity. Absenteeism from respiratory infections (likely exacerbated by microplastic lung penetration) and earlier cardiovascular disease onset shorten working lives. The World Economic Forum estimates this productivity loss at $280-450 billion annually, though these figures remain rough approximations given the difficulty of isolating microplastic impact from other causative factors.
Source: Huang, Y., et al. (2023) "Economic Costs of Plastic Pollution Globally." Environmental Research Letters, 18(3), 034018 — Modeled total economic cost of plastic production and its externalized health burden.
Environmental cleanup costs. Ocean cleanup efforts like The Ocean Cleanup Project are capital-intensive. Deploying cleanup systems in the Great Pacific Garbage Patch costs approximately $300-500 million for a single year of operation and removes only 5-10% of the annual plastic influx in that region — meaning cleanup alone cannot outpace new pollution. Landfill expansion and management in developing countries to accommodate growing plastic waste costs an estimated $50-100 billion annually. These infrastructure costs are predominantly borne by governments rather than plastic manufacturers, representing an additional subsidy to the industry.
Food security and agricultural impacts. Soil microplastics accumulate in agricultural fields through the application of plastic-containing compost and irrigation water. This reduces soil microbial diversity, impairs nutrient cycling, and decreases crop yields by an estimated 5-20% in heavily contaminated soils. Food production costs rise as a result. The FAO estimates that managing microplastic impacts on soils globally will cost $200-400 billion annually by 2050 if current trends continue.
Regional Disparities and Global Hotspots
Plastic pollution is not evenly distributed. Certain regions face extraordinary concentrations due to geography, waste management infrastructure, and consumption patterns.
River systems and freshwater pollution. Ten rivers — eight in Asia (Yangtze, Indus, Yellow River, Hai River, Ganges, Mekong, Amur, Pearl) and two in Africa (Nile, Niger) — contribute an estimated 88-95% of ocean-bound plastic. The Yangtze River alone discharges 330,000-730,000 tonnes of plastic annually. These rivers flow through regions with limited waste management infrastructure, high population density, and rapid industrialization. Freshwater systems in these regions now show microplastic concentrations 10-100x higher than coastal waters in developed countries. Fish populations that depend on these rivers show bioaccumulation of microplastics in their tissues, affecting the food security of 2 billion people who depend on river and fishery resources.
Source: Lebreton, L. C., et al. (2017) "River Plastic Emissions to the World's Oceans." Nature Communications, 8, 15611 — Identified top 10 rivers contributing to ocean plastic; model based on waste generation, infrastructure, and hydrological data.
Geographic ocean accumulation zones. The five subtropical gyres (North Atlantic, South Atlantic, North Pacific, South Pacific, Indian Ocean) create circular current patterns that concentrate floating plastic. The North Pacific Gyre (the "Great Pacific Garbage Patch") contains an estimated 1.8 trillion microplastic pieces. The North Atlantic Gyre, smaller but highly trafficked by shipping, shows concentrations of 0.04-0.4 mg/km² of microplastics. Fish and marine mammals that migrate through these zones accumulate microplastics; commercially important fish species (tuna, mackerel) caught in these regions show plastic concentrations in their digestive tracts. This means consumers purchasing seafood from certain regions have direct exposure to concentrated microplastic ingestion.
Coastal developing regions. Coastal areas in Southeast Asia, South Asia, and West Africa face unprecedented levels of plastic waste due to rapid economic growth, inadequate waste management, and tourism. Lagos, Nigeria handles an estimated 11,000 tonnes of mismanaged waste daily, much of it plastic. Coastal ecosystems in these regions show microplastic concentrations 100-1000x higher than non-coastal baseline levels. Coral reefs, mangrove forests, and seagrass beds — biodiversity hotspots — in these regions face compounded stress from microplastics and climate change, with synergistic degradation effects. Recovery of these ecosystems now requires active plastic remediation, not just climate mitigation.
Outlook: Trends Through 2050
Current trajectory modeling suggests that without major intervention, plastic production will double by 2050 and ocean plastic inflow will triple. However, emerging trends show potential for reversal:
Technological momentum: Chemical recycling and enzymatic depolymerization are scaling faster than expected. Several companies have announced commercial-scale facilities operational by 2026-2027. If costs drop 40-50% over the next 5-7 years (a realistic scenario based on learning curves in similar technologies), chemical recycling could capture 15-25% of plastic waste by 2050, compared to <1% today.
Policy acceleration: The UN plastic treaty, expected in 2025, is likely to include binding production cap mechanisms for the first time in any material. If adopted with enforcement mechanisms, this could reduce growth rates from 5-7% annually to 0-2% annually, a transformative shift. EU policy is already moving toward mandatory recycled content standards (70-90% by 2050) and producer responsibility measures. Such policies work best when paired with investment in renewable energy to power recycling facilities, as renewable energy infrastructure can make chemical recycling economically viable.
Consumer demand shifts: Younger demographics (Gen Z) show willingness to pay 10-20% premiums for products with verified low-plastic footprints. This consumer signal is driving corporate innovation in packaging and material substitution faster than regulatory requirements alone.
Alternative Materials and Emerging Solutions
Biodegradable plastics
Polyactic acid (PLA, derived from corn starch) and polycaprolactone (PCL) biodegrade, but only under specific conditions (industrial composting at 58°C+ for weeks). In natural environments or landfills, they persist similarly to conventional plastic. Marketing these as "eco-friendly" is misleading — the infrastructure to compost them properly is limited in most regions.
Polyhydroxyalkanoates (PHAs), produced by bacteria, are genuinely biodegradable in marine environments and are emerging as the most promising bioplastic option. However, production costs remain 3–5x higher than conventional plastic, limiting adoption.
Bio-based plastics from cellulose and algae
Researchers are developing plastic-like materials from agricultural and marine waste: cellulose acetate (from wood pulp), algae-based bioplastics, and chitosan (from crustacean shells). These show promise but face challenges: higher costs, less versatile properties, uncertain end-of-life behaviors. Likely niche solutions rather than replacements for commodity plastics.
Enzymatic depolymerization
A breakthrough in 2023 identified a mutated enzyme (engineered PETase) that can rapidly break down PET plastic (used in bottles) back to monomers within hours — potentially enabling true circular plastic economies. Commercial deployment requires scale-up, but this technology could transform recycling economics if costs drop.
Reduced packaging and reusables
The simplest solution: elimination of unnecessary packaging. Return-and-reuse systems (glass bottles, reusable bags) have proven effective where implemented (much of Europe for beer and milk bottles, San Francisco's plastic bag ban). These require infrastructure investment but reduce environmental and health impacts dramatically.
Policy Innovations and Global Response
Single-use plastic bans
Over 100 countries have implemented partial or complete single-use plastic bans, primarily on bags and straws. Impacts are measurable — ocean plastic from bags has decreased ~50% in some regions — but represent only a fraction of total plastic waste.
Extended Producer Responsibility (EPR)
Policies that make producers responsible for end-of-life management incentivize better design. Products designed for recyclability and durability reduce waste volumes. EU's Single-Use Plastics Directive (implemented 2021) explicitly requires EPR compliance.
International Plastic Treaty
UN-led negotiations (ongoing since 2023) aim to establish a global binding agreement on plastic production and waste. A strong treaty could establish production caps, recycling standards, and accountability mechanisms. Current trajectory suggests a moderate agreement by 2025, though enforcement remains uncertain.
Chemical recycling investment
Governments and companies are funding chemical recycling (depolymerization and reconversion to virgin plastic feedstock). If costs drop, this could scale significantly by 2030. However, it requires energy input (ideally renewable) and still risks concentrating plastic production without reducing volumes.
The Realistic Future
By 2050, plastic consumption projections range from 600 million to 1 billion tonnes annually under business-as-usual scenarios. Realistic mitigation scenarios (with strong policy and technology adoption) could flatten or slowly reduce this — but would require:
- Reduction in production (at least 30% below current trajectories) through bans, redesign, and reuse systems.
- Circular infrastructure at scale: chemical recycling, enzymatic depolymerization, improved mechanical recycling.
- Material substitution: 10–20% replacement with cellulose, algae-based, and other non-toxic alternatives.
- Waste management: improved systems in developing nations, eliminating river plastic inflow.
Without these coordinated changes, microplastic pollution will continue to increase, accumulating in soils, oceans, and human bodies. The technology and policy to address it exist. Implementation at speed and scale — not knowledge — is the limiting factor.
Why recycling isn't enough
Recycling has been promoted as the main solution. The reality is more complicated:
The recycling shortfall
Despite decades of campaigns, only ~9% of plastic ever made has been recycled. Reasons:
- Many plastics aren't recyclable in practice (mixed materials, contamination, low value).
- Recycling degrades quality — plastic typically can't be recycled indefinitely.
- Economics — virgin plastic is often cheaper than recycled.
- Sorting infrastructure — only some plastic types are economically viable to recycle.
- End markets — even sorted plastic must find buyers.
Greenwashing
Industry-promoted recycling has often been a way to deflect attention from production levels. Internal documents show some companies promoted recycling while knowing it wouldn't significantly address the volume problem.
What's actually true
Recycling helps but doesn't solve the problem. Reducing production, redesigning products, and investing in alternatives are necessary alongside recycling.
Real solutions
Several approaches matter:
Reduce production
The biggest lever. Single-use plastic bans, reusable alternatives, packaging reduction. Major impacts where implemented (plastic bag bans, plastic straw eliminations).
Better material design
Plastics designed for recycling, biodegradable plastics for specific applications, plant-based plastics. None is universally superior.
Improved waste management
Especially in regions with limited infrastructure. Countries with good waste systems have far less plastic pollution.
River interceptors
Floating barriers in major polluted rivers can catch plastic before it reaches oceans. The Ocean Cleanup project has deployed these in several rivers.
Ocean cleanup
The Ocean Cleanup is also collecting plastic from the Great Pacific Garbage Patch. Real but slow — far less plastic comes out of the patch than goes in.
Chemical recycling
Newer technologies that break down plastic to molecular components for re-creation. Promising but expensive and energy-intensive.
Extended producer responsibility
Policies making plastic producers responsible for end-of-life. Drives better design and waste management.
Global treaty
A UN-led plastic treaty negotiation has been ongoing. Could establish global standards if successful.
Common misconceptions
"Plastic decomposes eventually"
Not really. Conventional plastics break into smaller fragments but don't biodegrade in human timescales — hundreds to thousands of years.
"Bioplastics are the answer"
Some bioplastics (PLA from corn) are compostable only in industrial facilities. Many "bioplastics" still cause similar pollution problems. The category is heterogeneous.
"If I recycle, my plastic gets reused"
Sometimes. Often it's exported to countries with looser standards, where it may end up in landfills, oceans, or burned. Locally recycled plastic has a better chance.
"Plastic in the ocean is mostly bottles and bags"
Visible debris is. The dominant ocean plastic by mass and danger is microplastics and fishing gear.
"We can clean up the ocean"
Slowly and partially. Cleaning the Pacific patch alone would take decades at current rates. Stopping the inflow is more urgent.
The takeaway
Plastic pollution is a global problem driven by exponentially growing production, inadequate waste management, and limited recycling. Microplastics are now in our bodies, our oceans, and our food, with emerging evidence of cardiovascular and inflammatory effects. Recycling alone isn't a solution — reducing production, improving design, and managing waste better matter more. The technology and policies to address it exist: chemical recycling, enzymatic depolymerization, bioplastics, and policy frameworks like EPR and production caps.
Whether these solutions are implemented at scale and speed determines whether the next generation lives in a world of plastic or one returning to balance. Like climate change, this is fundamentally a problem of collective action, not just individual knowledge or behavior.
Frequently Asked Questions
Q: Should I avoid bottled water?
A: Yes, if possible. Bottled water has measurably more microplastics than tap water (typically 20–100x higher), and bottled water creates unnecessary plastic waste. Tap water in most developed countries is highly regulated and cleaner. Using a reusable bottle reduces both personal microplastic exposure and environmental impact.
Q: What about sea salt and seafood?
A: Both contain microplastics, with salt typically having more relative to mass (sea salt averages ~600 microplastic particles per kg, while table salt from evaporated brines is much lower). Seafood, particularly shellfish and filter-feeders like mussels, concentrate microplastics from seawater. Effects on health are unclear, and eating both remains broadly safe. The concern is long-term accumulation, not acute toxicity from occasional consumption.
Q: Can I do anything as an individual?
A: Yes — meaningful actions include reducing single-use plastic (bags, straws, packaging), choosing reusables, supporting local bans, demanding less packaging from companies, and advocating for policy change. Individual actions compound when many do them, and consumer demand is a real driver of corporate behavior change. However, individual action without systemic policy change has limited impact on global volumes.
Q: Are biodegradable plastics the solution?
A: No single solution. Some biodegradable plastics (PHAs, PLA under ideal conditions) genuinely break down, but most current alternatives degrade only under industrial composting conditions and persist in natural environments similarly to conventional plastic. Marketing these as "eco-friendly" is often misleading. Promising options include enzymatic depolymerization and true marine biodegradable materials, but they remain niche applications at current costs.
Q: Is plastic pollution worse than climate change?
A: Different problems with different urgencies. Climate change is more existentially threatening (existential risk to civilization and ecosystems); plastic pollution is more insidious and visible (ubiquitous contamination of food chains and organisms, including humans). Both deserve attention; resources and policy can address both simultaneously without competition.
Q: How long does plastic actually take to biodegrade?
A: Conventional plastics (PET, HDPE, PVC, PP) do not biodegrade in any reasonable timescale — they fragment into smaller pieces but persist essentially unchanged for 400–1,000+ years. Microplastics from fragmentation remain in the environment indefinitely at human timescales. Only specialized biodegradable polymers with chemical structures susceptible to enzymatic breakdown will truly degrade, and only under specific conditions (heat, oxygen, specific microorganisms).
Read next:
Follow new articles
Add SciHub101 to your feed reader to see new science and technology stories.
About the Author
SciHub101 is an independent science and technology publication founded and edited by Buğra Sözeri, a software engineer and app developer based in Türkiye. AI tools assist with drafting and research. Source documentation in the existing archive is uneven, and articles are being reviewed and corrected. The Editorial Team byline identifies editorial responsibility; it does not certify specialist or independent human review. Where we compare products, anything built by our own team is labelled as such — see the editorial guidelines and About page for how corrections and disclosures work.
Related Articles
Grid-Scale Battery Storage: The Missing Piece of the Energy Transition
Solar and wind are cheap but not dispatchable. Grid-scale battery storage fills the gap for hours, not weeks. This article covers how the systems work, how fast costs fell, what Hornsdale and California showed, and where batteries still fall short.

What Is Green Hydrogen — and Could It Replace Fossil Fuels?
Green hydrogen is made by splitting water with renewable electricity, so burning it releases only water. It is promising for industries that cannot easily electrify, but it is costly and wasteful elsewhere.
Countries That Recycle the Most (Municipal Waste Recycling Rates Ranked)
Austria recycles or composts 62.8% of its municipal waste — the highest rate in the European Union, the benchmark organization for standardized recycling statistics. Germany follows at approximately 67% when historical figures are used, with ten EU countries exceeding 50%. Outside Europe, South Korea leads Asia with an overall recycling and recovery rate that exceeds 80% through a deposit-refund system widely studied as a global model.
Fast Fashion's Environmental Cost and What to Do About It
Fast fashion's footprint comes mostly from making and discarding clothes, not wearing them. This article sorts the well-supported numbers on water, carbon, microplastics, and waste from the disputed ones, and shows which responses have evidence behind them.

Countries with the Most Freshwater Resources (Ranked)
Brazil has the world's largest total renewable freshwater resources — approximately 8,647 cubic kilometers per year, more than any other country and roughly 20 percent of the global total. Russia is second at 4,525 km³/year, Canada third at 2,860 km³/year. But total volume is only part of the story: Canada's per-capita freshwater availability is 36 times higher than China's. And water stress — not total availability — is the defining water challenge of the twenty-first century. This ranking covers the top 20 countries by total renewable freshwater resources, sourced from FAO AQUASTAT, with per-capita comparison and analysis of global water scarcity.
The Amazon Rainforest: Earth's Lungs Explained by Science
The Amazon is not Earth's oxygen factory, but it stores vast carbon and recycles rain across a continent. Here is what the evidence says about deforestation, drought, and tipping points.