Countries with the Most Desert Land (2025 Ranked)
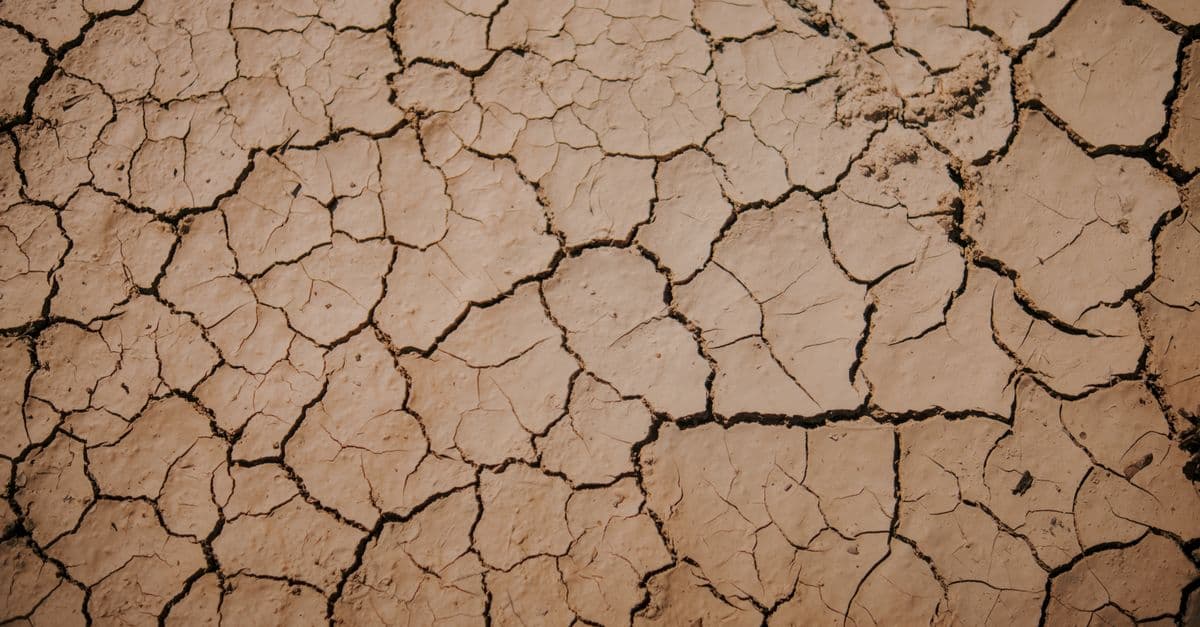
Photo: Abdullah Öğük / Pexels
Deserts cover approximately 33% of Earth's land surface — roughly 50 million km². But "desert" is broader than the popular image of endless sand dunes: by scientific definition, a desert is any region receiving less than 250mm of precipitation per year. This includes the vast Arctic and Antarctic polar deserts (the largest deserts on Earth), the Sahara, Arabian, and Gobi hot deserts, and the cool temperate deserts of Central Asia.
The UNCCD (United Nations Convention to Combat Desertification) monitors global dryland extent and the critical threat of desertification — the process by which fertile land degrades into desert through climate change, deforestation, overgrazing, and poor land management.
Key takeaways
- Antarctica is technically the world's largest desert (14.2 million km²) — a cold polar desert; the Sahara (9.2 million km²) is the largest hot desert.
- Russia has the most desert and dryland by total area (including its vast cold steppes and semi-arid regions).
- Australia has the highest proportion of national territory classified as desert or dryland — approximately 35% of the continent.
- Desertification is advancing at approximately 12 million hectares per year globally — an area the size of England converted to unproductive land annually.
- The Sahel belt of Sub-Saharan Africa is the region most severely affected by advancing desertification — threatening food security for 500 million people.
Countries with the most desert land
(Combined hot desert, cold desert, and dryland area, km²)
| Rank | Country | Desert area (km²) | % of territory | Desert type |
|---|---|---|---|---|
| 1 | Russia | ~8,500,000 | 50% | Cold steppe/semi-arid + tundra |
| 2 | China | ~3,300,000 | 34% | Gobi, Taklamakan, loess plateau |
| 3 | United States | ~2,000,000 | 21% | Mojave, Sonoran, Great Basin, Chihuahuan |
| 4 | Australia | ~2,700,000 | 35% | Great Victoria, Simpson, Gibson, Tanami |
| 5 | Saudi Arabia | ~2,150,000 | 95% | Arabian/Rub' al Khali (Empty Quarter) |
| 6 | Kazakhstan | ~1,900,000 | 70% | Central Asian steppes, Kara Kum extension |
| 7 | Algeria | ~2,000,000 | 84% | Sahara dominant |
| 8 | Sudan | ~1,800,000 | 70% | Sahara, Nubian desert |
| 9 | Libya | ~1,750,000 | 99% | Libyan Desert/Sahara |
| 10 | Mongolia | ~1,500,000 | 96% | Gobi desert |
| 11 | Iran | ~1,000,000 | 60% | Dasht-e Kavir, Dasht-e Lut |
| 12 | Brazil | ~900,000 | 11% | Caatinga (semi-arid northeast) |
| 13 | Argentina | ~700,000 | 25% | Patagonian desert (cold) |
| 14 | Egypt | ~1,000,000 | 94% | Eastern/Western Saharan desert |
| 15 | Peru | ~300,000 | 23% | Atacama and coastal desert |
| 20 | India | ~500,000 | 15% | Thar desert (Rajasthan) |
| 25 | Mexico | ~430,000 | 22% | Chihuahuan, Sonoran (shared with US) |
Source: UNCCD Dryland Status Report (2024), USGS Global Land Cover Database, ESA Copernicus Programme satellite monitoring — vegetation and precipitation-based dryland classification updated annually.
Where This Data Comes From
Desert and dryland areas are defined and monitored using precipitation data (regions receiving <250mm/year), satellite vegetation indices (NDVI — Normalized Difference Vegetation Index tracking greenness), and soil moisture measurements. The UNCCD (United Nations Convention to Combat Desertification) compiles this data from national governments, space agencies (USGS, ESA Copernicus, NOAA), and academic institutions into annual dryland extent assessments. Desertification rates are estimated via satellite time-series analysis comparing vegetation cover over decades — detecting regions where desert has encroached into previously productive land. One key limitation: satellite data is most reliable for detecting large-scale changes; degradation of agricultural land at smaller scales (farm-level grazing damage, soil salinization) is underestimated. Precipitation-based definitions (250mm threshold) are somewhat arbitrary — transition zones between steppe and desert are graded rather than sharp. Cold deserts (polar regions, high-altitude steppes) are classified differently than hot deserts, which is why Russia's figure is so large (it includes substantial cold-steppe and tundra regions).
What Desert Distribution Reveals About Climate Geometry and Human Vulnerability
The geographic concentration of deserts at 15–30°N and 15–30°S latitude (the subtropical high-pressure belts) is not random — it reflects fundamental atmospheric circulation patterns that are fixed by physics and solar geometry. Australia's 35% desert extent and Russia's vast dryland reflect these unavoidable climate zones. However, the expansion of deserts into formerly productive land (desertification) is not fixed — it is a function of land management, climate change, and human choice. The Sahel's rapid desertification is accelerating partly due to natural climate variation but significantly driven by overgrazing, charcoal harvesting, and deforestation that feedback to reduce local rainfall. The Aral Sea's transformation from lake to toxic desert is purely anthropogenic — irrigation overuse drained it entirely. The contrast between the two demonstrates that while natural deserts are ineradicable, human-driven desertification is preventable (and reversible, as China's Loess Plateau restoration shows). The data thus functions as a warning: the 12 million hectares lost annually to desertification are predominantly in poor countries (Sub-Saharan Africa, South Asia) that contributed least to climate change but face the harshest expansion of dryland. This geographic inequality — wealthy temperate-zone nations need not worry about desertification, while Sub-Saharan Africa and Central Asia are at maximum risk — is one of the starkest manifestations of climate injustice.
The Sahara: the world's defining hot desert
The Sahara (9.2 million km²) covers 11 countries and 31% of Africa. It is not static:
The Sahara is expanding: The Sahara grew by approximately 10% over the 20th century, primarily expanding southward into the Sahel. Climate model analysis suggests further southward expansion under most warming scenarios.
The Green Sahara cycle: Geological evidence shows the Sahara has alternated between green and desert states multiple times over millennia — the "African Humid Period" (11,000–5,000 years ago) saw grasslands and lakes across today's Sahara. Orbital cycles (Milankovitch cycles) that altered solar radiation distribution drove these changes. The next natural "greening" isn't due for thousands of years.
The Great Green Wall: In response to Saharan expansion, 11 African nations have initiated the Great Green Wall project — an 8,000 km belt of trees and restored land across the Sahel from Senegal to Djibouti. By 2022, 18 million hectares had been restored. Full completion would sequester 250 million tonnes of CO₂ and create 10 million jobs.
Australia: the desert continent
Australia's extraordinary desert extent reflects its position directly under the subtropical high-pressure belt — the same atmospheric feature that creates the world's great deserts at 15–30°N and 15–30°S latitude.
The great Australian deserts: The Great Victoria Desert (424,000 km²) is Australia's largest single desert; the Simpson Desert is famous for its 1,100 sand dunes oriented parallel to prevailing winds; the Nullarbor Plain is a flat, treeless expanse stretching 1,200 km.
Population distribution: 85% of Australians live within 50 km of the coast, leaving the vast interior almost uninhabited. The interior is referred to as "the Outback" — romanticised in Australian culture but genuinely hostile to settlement (heat, no water, extreme isolation).
The Indigenous relationship: Aboriginal Australians have inhabited the Australian desert for 65,000+ years — developing sophisticated knowledge of water sources (soakages, native wells), seasonal movement, and plant resources. Their survival in an environment European settlers consistently found lethal is one of humanity's greatest feats of cultural adaptation.
Desertification: the creeping crisis
Desertification — the degradation of fertile dryland into unproductive desert — is distinct from natural desert. It is caused by:
Overgrazing: Livestock remove vegetation cover, exposing soil to wind and water erosion. This is the leading cause of desertification in Sub-Saharan Africa.
Deforestation: Removing trees eliminates transpiration, reduces rainfall, and exposes soil. Deforestation in the Sahel directly accelerated Saharan expansion.
Unsustainable irrigation: Over-irrigation raises saline water tables; when irrigation stops, salt-crusted dead soil remains.
Climate change: Higher temperatures increase evaporation, shifting the aridity boundary. The IPCC projects the area affected by desertification will increase by 10–23% by 2100 under high-emission scenarios.
The Aral Sea is the world's most dramatic desertification case: once the world's 4th-largest lake (68,000 km²), Soviet-era irrigation of the Amu Darya and Syr Darya rivers for cotton farming reduced it to 10% of its former size by 2007. The exposed seabed became the Aralkum desert — toxic salt flats that generate dust storms affecting health across Central Asia.
Frequently asked questions
What is the coldest desert on Earth?
Antarctica is both the world's largest desert and its coldest. The Antarctic ice sheet receives so little precipitation (15–200mm water equivalent per year — less than the Sahara in some areas) that it qualifies as a desert. The interior plateau averages -57°C, with the coldest recorded temperature at -89.2°C (Vostok Station, 1983).
Can deserts be reversed?
Yes — the Loess Plateau in China is the world's largest land restoration success: 35,000 km² of severely degraded land was restored over 20 years through terracing, reforestation, and restricted grazing. China's "Grain for Green" programme paid farmers to convert farmland on slopes to forest. The result: vegetation cover increased dramatically, erosion dropped 90%, and local temperatures fell. Saudi Arabia is investing $7 billion in a national greening initiative. Restoration is possible but requires sustained political and financial commitment.
Is the desert biome important for biodiversity?
Yes — despite appearing lifeless, hot deserts support significant adapted biodiversity. The Namib Desert contains fog-collecting beetles; the Sonoran Desert has 2,000+ native plant species and supports jaguar. The Arabian oryx was extinct in the wild (from hunting) and successfully reintroduced in Oman's desert. Desert biodiversity is shaped by extreme adaptation — organisms capable of surviving in deserts often have unique biochemistry with medical and technological applications.
The bottom line
Deserts are both natural landscapes of great beauty and biodiversity, and — in their advancing form — one of the most serious threats to global food security and human habitability. The natural deserts of Australia, the Arabian Peninsula, and Central Asia are permanent features of Earth's climate system. The advancing deserts of the Sahel, Central Asia, and northern China are human-influenced catastrophes destroying farmland and forcing displacement. The 12 million hectares lost to desertification every year is not an abstraction — it is families who lose their farmland, villages that are abandoned, ecosystems that are destroyed. The Great Green Wall initiative shows that reversal is possible; whether it happens at the scale and speed needed to outpace climate change is one of the defining environmental questions of the next generation.
Related Reading
Follow new articles
Add SciHub101 to your feed reader to see new science and technology stories.
About the Author
SciHub101 is an independent science and technology publication founded and edited by Buğra Sözeri, a software engineer and app developer based in Türkiye. AI tools assist with drafting and research. Source documentation in the existing archive is uneven, and articles are being reviewed and corrected. The Editorial Team byline identifies editorial responsibility; it does not certify specialist or independent human review. Where we compare products, anything built by our own team is labelled as such — see the editorial guidelines and About page for how corrections and disclosures work.
Related Articles

Cycling Infrastructure: How to Compare Network Quality
Why kilometres of bike lanes cannot establish a global winner, and how connectivity, junctions, and design standards affect a network assessment.
Countries with the Most Mountainous Terrain (2025 Ranked)
Bhutan is the world's most mountainous country — 98% of its territory is above 600m. Nepal has the world's highest peaks including Everest. The Himalayas, Andes, and Alps define some of Earth's most dramatic geography. Here's the full ranking of the world's most mountainous nations and what extreme altitude means for human life.
The Amazon Rainforest: Earth's Lungs Explained by Science
The Amazon is not Earth's oxygen factory, but it stores vast carbon and recycles rain across a continent. Here is what the evidence says about deforestation, drought, and tipping points.
Countries That Generate the Most Plastic Waste (2025 Ranked)
The United States generates more plastic waste per capita than any large nation — 130 kg per person per year. But the Philippines, Indonesia, and India contribute the most plastic to the ocean. How you rank countries on plastic pollution depends entirely on whether you measure production, per-capita waste, or ocean contribution.

Direct Air Capture: How It Works, What It Costs, and Where It Fits
Direct air capture (DAC) machines pull carbon dioxide out of ambient air with chemical sorbents or solvents, then release it as a pure stream for storage or use. The technology works. The constraint is energy and cost: reported prices run from about $600 to more than $1,000 per tonne, and operating capacity is a tiny fraction of annual emissions.
How to Reduce Your Carbon Footprint: 20 High-Impact Actions (Ranked by Real Data)
The average person in a high-income country produces 16 metric tons of CO2-equivalent emissions annually. Half of this comes from four categories: transportation (27 percent), energy (home heating/cooling and electricity, 25 percent), food (14 percent), and consumption (goods and packaging, 14 percent). Reducing your carbon footprint requires action in these four areas. However, the impact varies dramatically. Flying four times per year generates 2 metric tons (12 percent of your footprint); driving 10,000 miles generates 2 metric tons; eating meat 5 times weekly for a year generates 0.5 metric tons. A household reducing driving 50 percent saves 1.5 metric tons per year; switching to a renewable-energy grid saves 2–4 metric tons annually; adopting a plant-dominant diet saves 0.3–1 metric ton per year. This guide ranks reduction actions by real-world impact (based on life-cycle assessment studies and carbon accounting data), separates high-impact actions from feel-good gestures, and addresses the systemic limitations of individual action. The highest-impact step is also the most difficult: reduce air travel. The second-highest is home energy efficiency. The third is dietary shift. Together, these three actions can reduce emissions by 40–60 percent; the remaining 20 actions add incremental improvements.