Countries with the Most Agricultural Land (FAO 2022 Ranked)
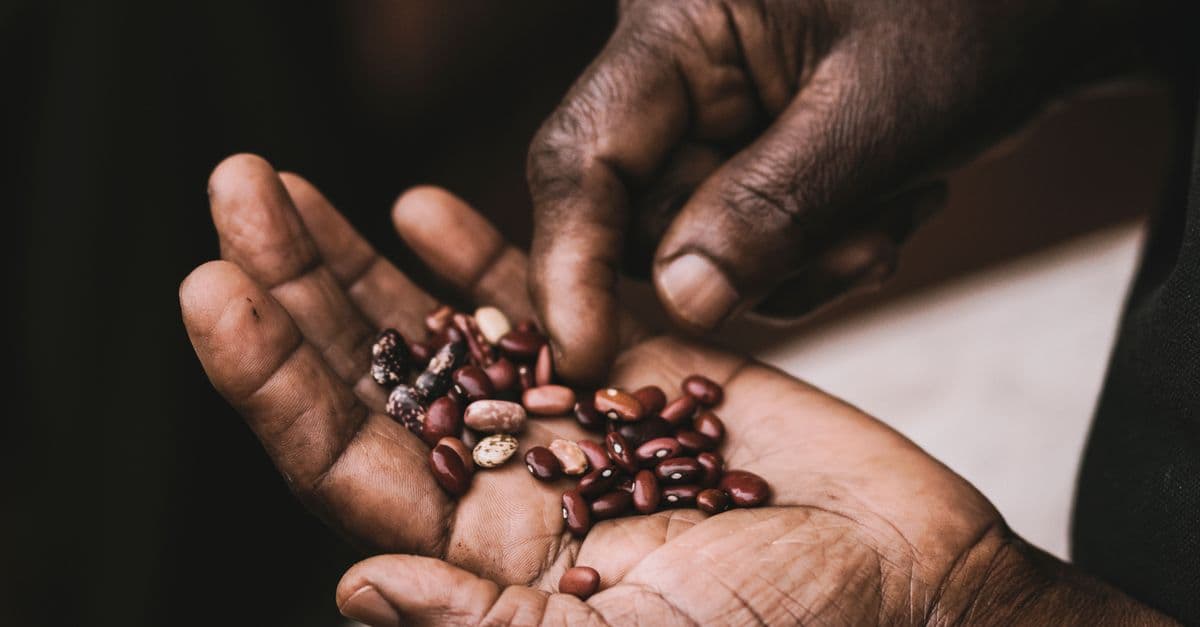
Photo: Nicholas Githiri / Pexels
The countries with the most agricultural land are the United States (about 421 million hectares), China (392 million), and Australia (364 million), according to Food and Agriculture Organization (FAO) data for 2022 as published by the World Bank. Together, the world's farmland and pasture cover roughly 4.8 billion hectares, or 37 percent of all land. The ranking is less simple than it looks, because a hectare of Australian rangeland and a hectare of Iowa cropland are different resources.
Educational only, not financial advice. Investing involves risk of loss; past performance does not guarantee future results. Consult a licensed financial advisor before making investment decisions.
Rankings by total area tell you who holds land. They do not tell you who can grow food, how many people share that land, or how fast it is being lost. This article separates those questions: total agricultural land, arable land, land per person, and yields, with a named source and year for every figure.
Key takeaways
- The United States leads on total agricultural land (421.5 million ha in 2022), ahead of China (391.9 million ha) and Australia (363.5 million ha).
- India has the most arable land (154.2 million ha), narrowly ahead of the United States (151.6 million ha) and well ahead of Russia (121.6 million ha) and China (108.0 million ha).
- Most agricultural land is not cropland. Pasture makes up about two-thirds of agricultural land use worldwide, so countries with huge grazing areas rank high on totals and low on food production.
- Arable land per person is highest in Kazakhstan, Australia, and Argentina among the countries tabulated below. China, the Netherlands, and the United Kingdom have under 0.1 hectare per person.
- Pressure on land is rising. World Resources Institute estimates that without action, feeding the world in 2050 would require agricultural expansion of 593 million hectares beyond the 2010 footprint.
The ranking: top 15 countries by agricultural land
Agricultural land, as FAO defines it, is the sum of arable land, land under permanent crops, and land under permanent pastures. The table uses the 2022 values from the World Bank's World Development Indicators, which republish FAO figures. Square kilometers were converted to millions of hectares (1 square kilometer = 100 hectares).
| Rank | Country | Agricultural land (million ha) | Share of land area | Arable land (million ha) |
|---|---|---|---|---|
| 1 | United States | 421.5 | 46.1% | 151.6 |
| 2 | China | 391.9 | 41.7% | 108.0 |
| 3 | Australia | 363.5 | 47.3% | 31.3 |
| 4 | Brazil | 236.8 | 28.3% | 55.6 |
| 5 | Russia | 215.6 | 13.2% | 121.6 |
| 6 | Kazakhstan | 214.9 | 79.6% | 30.3 |
| 7 | India | 178.6 | 60.1% | 154.2 |
| 8 | Saudi Arabia | 173.7 | 80.8% | 3.4 |
| 9 | Sudan | 112.7 | 60.3% | 21.0 |
| 10 | Mongolia | 112.0 | 71.9% | 1.1 |
| 11 | Mexico | 98.9 | 50.9% | 20.6 |
| 12 | South Africa | 96.3 | 79.4% | 12.0 |
| 13 | Argentina | 74.2 | 27.1% | 46.1 |
| 14 | Nigeria | 69.3 | 76.1% | 36.5 |
| 15 | Canada | 57.1 | 6.5% | 38.3 |
Sources: World Bank WDI indicators AG.LND.AGRI.K2, AG.LND.AGRI.ZS, and AG.LND.ARBL.HA, 2022, compiled from FAO. Links in the Sources section.
A few other countries matter for context. Ukraine ranks 26th in the same dataset with 41.3 million hectares, of which 32.9 million are arable. France has 28.5 million hectares of agricultural land (16.98 million arable), the United Kingdom 17.4 million (6.0 million arable), Germany 16.6 million (11.7 million arable), and the Netherlands 1.8 million (1.0 million arable).
Where this data comes from
These figures come from national land-use reports that FAO harmonizes into one database, and the World Bank republishes them. FAO defines arable land as land under temporary crops, temporary meadows for mowing or pasture, market and kitchen gardens, and temporarily fallow land. Land under permanent crops covers orchards, vineyards, and plantations that are not replanted each year. Permanent pasture is land used five or more years for forage (World Bank indicator metadata).
Definitions differ at the margins. A country that counts thinly vegetated rangeland as pasture will report far more agricultural land than one that counts only managed grassland. That is a large part of why Saudi Arabia, Mongolia, and Kazakhstan appear so high, and why the 2022 vintage of the data may not match older versions that circulate in other rankings. FAO updates historical series as countries revise their reports, so compare numbers only within the same vintage.
Why total hectares mislead: how much of each country's land is actually cropland
The fairest single check is the share of agricultural land that is arable, since cropland produces most of the world's calories. The ratio varies enormously.
| Country | Agricultural land (million ha) | Arable land (million ha) | Arable as share of agricultural land |
|---|---|---|---|
| India | 178.6 | 154.2 | 86% |
| Ukraine | 41.3 | 32.9 | 80% |
| Canada | 57.1 | 38.3 | 67% |
| Russia | 215.6 | 121.6 | 56% |
| United States | 421.5 | 151.6 | 36% |
| China | 391.9 | 108.0 | 28% |
| Brazil | 236.8 | 55.6 | 23% |
| Australia | 363.5 | 31.3 | 9% |
| Saudi Arabia | 173.7 | 3.4 | 2% |
| Mongolia | 112.0 | 1.1 | 1% |
Calculated from World Bank WDI / FAO data, 2022. Ratios rounded.
The contrast between India and Australia is the clearest. India has less agricultural land than Australia in total (178.6 versus 363.5 million hectares) but five times as much arable land. Almost everything India counts as agricultural is cropland. Most of what Australia counts is grazing country, much of it in dry regions where a hectare supports very few animals.
Think of it like comparing restaurants by floor area. A restaurant with a huge dining room and a tiny kitchen can have more square meters than one with a compact dining room and a large kitchen, but the second one may serve far more meals. Agricultural area is the dining room. Arable area is closer to the kitchen.
Pasture counts for the largest share worldwide. The World Resources Institute puts pastureland at two-thirds of agricultural land use (WRI). For a longer treatment of why grazing land dominates the global footprint, the resource pages on Countries with the Most Forest Cover and Countries with the Largest Land Area are useful companions, since forests, pastures, and deserts compete for the same continents.
Arable land per person: who has room to spare
Dividing arable land by population shows a different order. In 2022 the world average was about 0.17 hectare of arable land per person.
| Country | Arable land per person (ha) |
|---|---|
| Kazakhstan | 1.51 |
| Australia | 1.20 |
| Argentina | 1.02 |
| Canada | 0.98 |
| Russia | 0.84 |
| Ukraine | 0.80 |
| United States | 0.45 |
| Sudan | 0.43 |
| Mongolia | 0.33 |
| Brazil | 0.26 |
| France | 0.25 |
| South Africa | 0.19 |
| Nigeria | 0.16 |
| Mexico | 0.16 |
| Germany | 0.14 |
| India | 0.11 |
| Saudi Arabia | 0.11 |
| United Kingdom | 0.09 |
| China | 0.08 |
| Netherlands | 0.06 |
| World | 0.17 |
Source: World Bank WDI indicator AG.LND.ARBL.HA.PC, 2022, from FAO and UN population data.
Two patterns stand out. First, the countries with the most arable land per person are mostly large, sparsely populated grain exporters. Second, several of the countries that feed the most people per hectare, including China and the Netherlands, have very little arable land per person. They compensate with high yields, imports, or both. A low number here is not automatically a weakness, and a high one is not a guarantee of food security.
Yields: land only matters if it is productive
Output per hectare is where the quality of land, water, technology, and climate show up. The World Bank reports average cereal yield, which is a rough but comparable measure across countries.
| Country | Cereal yield, 2022 (kg per hectare) |
|---|---|
| Netherlands | 8,860 |
| United States | 8,066 |
| United Kingdom | 7,720 |
| Germany | 7,126 |
| France | 6,655 |
| China | 6,386 |
| South Africa | 5,310 |
| Saudi Arabia | 5,002 |
| Brazil | 4,908 |
| Argentina | 4,822 |
| Ukraine | 4,614 |
| Canada | 4,105 |
| Mexico | 3,950 |
| India | 3,564 |
| Russia | 3,428 |
| Australia | 3,278 |
| Nigeria | 1,660 |
| Kazakhstan | 1,372 |
| Mongolia | 1,113 |
| Sudan | 676 |
| World average | 4,186 |
Source: World Bank WDI indicator AG.YLD.CREL.KG, 2022.
The spread is more than tenfold between the Netherlands and Sudan. Yield differences reflect soil, rainfall, irrigation, fertilizer, and seed, but also which crops and which regions a country farms. Australia's cereal yield looks low because much of its wheat is grown in dry regions with limited rainfall, not because its farmers are unskilled. Ukraine's 4,614 kilograms per hectare beats India's 3,564, but it falls short of France's 6,655.
Yield gains come from technology as much as from land. The nitrogen fertilizer chemistry behind them is covered in Haber-Bosch Process: Industrial Nitrogen Fixation, and the plant-breeding side of the story is in the profile of Norman Borlaug. Newer tools such as AI-guided precision farming aim to squeeze more from the same hectares.
Is farmland growing or shrinking?
The global total is nearly flat. The World Bank series shows world agricultural land of about 4.73 billion hectares in 2000 and 4.80 billion in 2022, an increase of about 1.5 percent. Under the surface, individual countries moved a lot.
| Country | 2000 (million ha) | 2022 (million ha) | Change |
|---|---|---|---|
| Australia | 455.5 | 363.5 | -20% |
| China | 433.98 | 391.9 | -10% |
| Mongolia | 130.5 | 112.0 | -14% |
| United States | 414.4 | 421.5 | +2% |
| Brazil | 228.3 | 236.8 | +4% |
| Nigeria | 65.5 | 69.3 | +6% |
| Argentina | 128.5 | 74.2 | -42% |
| Ukraine | 41.4 | 41.3 | 0% |
| World | 4,733.9 | 4,802.8 | +1.5% |
Calculated from World Bank WDI indicator AG.LND.AGRI.K2, values for 2000 and 2022.
Treat large moves with caution. A fall of 42 percent in Argentina over 22 years is more likely to reflect a revision in how national authorities classify pasture than a physical loss of nearly half the country's farmland. Even where the changes are real, the causes differ: conversion to cities and forest, abandonment, drought, or reclassification. The headline series cannot distinguish them, so the honest reading is that the world is not running out of agricultural land in aggregate, but the quality and location of that land are shifting.
The United States: the largest base and a water problem
The United States tops the ranking and has the second-largest arable area, with only 1.6 percent of employment in agriculture in 2022 (ILO modeled estimate via the World Bank). That combination, a huge land base and very few farm workers, reflects heavy mechanization and high yields. Its cereal yield of 8,066 kilograms per hectare is nearly double the world average.
Part of that productivity depends on irrigation from the Ogallala Aquifer, which underlies about 450,000 square kilometers across eight states from South Dakota to Texas. It supplies roughly 30 percent of the groundwater used for irrigation in the United States. Pumping since the late 1940s has removed an estimated 410 cubic kilometers of water, and some areas have dropped by more than 90 meters. Natural recharge ranges from about 0.6 millimeter a year in parts of Texas and New Mexico to about 150 millimeters in south-central Kansas, so refilling at human timescales is not realistic (Wikipedia, Ogallala Aquifer, summarizing USGS data). It is one reason that water, not land area, is often the binding limit on future farm output.
The United States has also lost its position as a net agricultural exporter. In calendar year 2025, U.S. agricultural exports were about $171 billion and imports about $212 billion, a deficit of $41 billion, according to USDA's Economic Research Service. Export values peaked in 2022, and the trade balance had been positive for nearly 60 years until 2019 (USDA ERS). Having the most farmland does not mean exporting the most food in every category, because Americans also import large volumes of produce, coffee, and processed foods.
China and India: feeding a third of humanity from small fields
China ranks second in total agricultural land, but only 108 million hectares, or 28 percent of that, is arable, and arable land per person is 0.076 hectare. About 24 percent of Chinese workers were employed in agriculture in 2022. Its cereal yield of 6,386 kilograms per hectare is among the highest of the large producers, which is how it feeds a population of roughly 1.4 billion from a limited cropland base.
India has the most arable land in the world, 154.2 million hectares, and about 43 percent of its workers are in agriculture. Its cereal yield of 3,564 kilograms per hectare is below the world average of 4,186. Because India already counts 86 percent of its agricultural land as arable, extra output has to come mostly from higher yields rather than from new fields. Closing even part of that gap would matter for world food balances.
For readers interested in who ends up short of food despite all this land, the ranking in Countries with the Worst Hunger and Food Insecurity shows that land area and hunger are only loosely related. Distribution, income, conflict, and storage losses matter as much as hectares.
Ukraine and Russia: why a few grain regions matter worldwide
Ukraine's agricultural land is small by total area, 41.3 million hectares, but 32.9 million of that is arable, one of the highest cropland shares in the table. Russia has 121.6 million hectares of arable land, the third-largest in the world. Together they sit at the center of global grain trade, which is why Russia's 2022 invasion of Ukraine produced a world food price shock.
Before the war, almost all of Ukraine's wheat, corn, and sunflower oil moved through its Black Sea ports, and the FAO has said Ukraine supplies more than 45 million tonnes of grain a year to global markets. After the invasion, the Black Sea Grain Initiative, signed on July 22, 2022 in Istanbul, allowed shipments to resume. By mid-July 2023, nearly 33 million tonnes of grain and other food had left Ukrainian ports under the deal, and 57 percent of grain exports went to developing countries. Russia declined to renew it on July 17, 2023 (Wikipedia, Black Sea Grain Initiative).
The episode showed that a modest share of the world's cropland can have an outsized effect on price and supply when it is concentrated in one corridor. It also showed the value of transport routes, not only fields.
Soil degradation: the slow loss behind the totals
The most worrying risk is not that land disappears but that it gets worse. FAO defines soil degradation as a change in soil health that reduces the ecosystem's capacity to provide goods and services. Soil erosion, the loss of topsoil and nutrients, is its most visible form. Desertification refers to degradation in drylands (FAO Soils Portal).
Estimates of the scale vary with method. One study in Nature Communications found that almost 36 billion tonnes of soil are lost every year to water erosion, and the United Nations has said that an area of fertile soil the size of Ukraine is lost annually to drought, deforestation, and climate change (Wikipedia, Soil erosion, summarizing these sources). Because topsoil takes a very long time to form compared with how fast it can wash away, losses are effectively permanent on human timescales.
Soil is also related to water, since irrigation can leave salts behind and groundwater pumping can run down aquifers. The water side of the problem is covered in Water Scarcity: The Growing Global Crisis Explained and the country ranking in Countries with the Most Freshwater Stress.
How much land will the world need by 2050?
The World Resources Institute framed the question as a "land gap," the difference between agricultural land in 2010 and the expansion that would be needed by 2050 under business as usual. Its estimate is 593 million hectares, an area nearly twice the size of India. The drivers are about 3 billion more people than in 2010, a 56 percent gap between crop calories produced in 2010 and those needed in 2050, and projected growth of 70 percent in demand for animal-based foods.
The same analysis warns that without adaptation, global crop yields will likely decline by at least 5 percent by 2050, and that a 10 percent yield decline would raise the land gap by 45 percent (WRI). The message is that the future is not fixed by the hectare count. It depends on yield growth, diets, food waste, and how much forest is cleared, and those can be changed. The country-level view of waste is in Countries That Waste the Most Food, and the associated cost of expanding farmland is partly forest, as shown in the forest cover ranking.
Who is buying farmland abroad
Foreign acquisition of farmland, often called land grabbing, is a smaller but contentious topic. It generally refers to very large-scale purchases or leases of land, often 100,000 hectares or more, by foreign governments, corporations, or investors in lower-income countries. As of January 2013, the Land Matrix database recorded deals covering 49 million hectares globally, of which 26 million were transnational. The Overseas Development Institute said that figure may have been exaggerated because data are limited and some deals appear stalled (Wikipedia, Land grabbing).
Critics point to weak land-tenure recognition in target countries, thin community consultation, displacement without adequate compensation, and promised jobs that mechanization reduces. Supporters argue that investment can bring capital and infrastructure to underfarmed land. Both sides agree that the outcome depends on the contract terms and local rights, which vary widely. Nothing here is investment advice, and farmland as an asset class carries its own risks, from weather and commodity cycles to political and legal exposure.
Can vertical farming replace field agriculture?
Vertical farms grow crops in stacked indoor layers under artificial light. They suit high-value leafy greens and herbs, and they use little land. Their constraint is energy. Commercial LEDs were about 28 percent efficient as of 2018, which keeps produce costs high, and vertical farms use much more energy per kilogram than ordinary greenhouses, mainly for lighting. Some have failed commercially: Jones Food Company, which opened in Gloucestershire, England, in 2024 with 14,500 square meters of growing space, was placed into administration in April 2025 (Wikipedia, Vertical farming).
Wheat, rice, and corn supply most of humanity's calories and are grown efficiently with free sunlight, so indoor farming is unlikely to displace them. It is better understood as a niche supplement near cities than as a replacement for the fields in the ranking above.
Frequently asked questions
Q: Which country has the most agricultural land? A: The United States, at about 421.5 million hectares in 2022 according to FAO data republished by the World Bank. China is second at 391.9 million and Australia third at 363.5 million. Older rankings that put China first may rely on earlier data vintages, so check the year before comparing.
Q: What is the difference between agricultural land and arable land? A: Agricultural land is the total of arable land, permanent crops, and permanent pasture. Arable land is only the part used for annual crops, temporary meadows, gardens, and fallow. India has the most arable land (154.2 million hectares), while the United States has the most agricultural land overall.
Q: Why does Australia rank high on farmland but low on food output? A: Most of Australia's 363.5 million hectares is grazing land. Only 31.3 million hectares, about 9 percent, is arable, and its cereal yield of 3,278 kilograms per hectare is below the world average because much of the cropping area is dry.
Q: Which country has the most arable land per person? A: Among the countries tabulated here, Kazakhstan, with 1.51 hectares per person in 2022, followed by Australia (1.20) and Argentina (1.02). The world average is about 0.17 hectare. China and the Netherlands have under 0.1 hectare per person.
Q: How much additional farmland could the world need by 2050? A: The World Resources Institute estimates a land gap of 593 million hectares between 2010 agricultural land and the expansion implied by business-as-usual growth. The gap shrinks with higher yields, less food waste, and changes in diets, and grows if yields fall.
Q: Is the world running out of farmland? A: Not in aggregate. FAO-based World Bank data show world agricultural land of about 4.8 billion hectares in 2022, up about 1.5 percent since 2000. The concern is quality and location: soil erosion, water shortages, and conversion of land in specific places.
Q: Is vertical farming a substitute for field farming? A: No. It works best for leafy greens and herbs, and its lighting costs make staple crops uneconomical. Several vertical farms have failed, including a large English facility placed into administration in April 2025.
The bottom line
The most useful way to read a farmland ranking is to ask three more questions after "how many hectares." How much of it is cropland? How many people share it? And how much does a hectare yield? On the first, the United States leads, but India has more cropland. On the second, Kazakhstan, Australia, and Argentina have the most arable land per person, while China and the Netherlands have the least. On the third, the Netherlands and the United States produce more than twice the cereal per hectare of India or Russia.
The global footprint is stable at about 4.8 billion hectares, and the outlook for the next 25 years depends less on discovering new land than on managing the land already in use: keeping soils intact, conserving water, and raising yields where they lag. Those are slower and less visible stories than a single price spike, but they decide how much food the planet can produce.
Sources
- World Bank, World Development Indicators, agricultural land (sq. km), 2022: AG.LND.AGRI.K2. Metadata and FAO definitions: indicator note
- World Bank, arable land (hectares), 2022: AG.LND.ARBL.HA
- World Bank, agricultural land (% of land area), 2022: AG.LND.AGRI.ZS
- World Bank, arable land per person: AG.LND.ARBL.HA.PC, cereal yield: AG.YLD.CREL.KG, employment in agriculture: SL.AGR.EMPL.ZS
- World Resources Institute, How to Sustainably Feed 10 Billion People by 2050, in 21 Charts
- USDA Economic Research Service, Agricultural Trade
- FAO Soils Portal, Soil degradation and restoration
- Wikipedia (secondary summaries of cited studies): Ogallala Aquifer, Soil erosion, Black Sea Grain Initiative, Land grabbing, Vertical farming
Related Reading
Follow new articles
Add SciHub101 to your feed reader to see new science and technology stories.
About the Author
SciHub101 is an independent science and technology publication founded and edited by Buğra Sözeri, a software engineer and app developer based in Türkiye. AI tools assist with drafting and research. Source documentation in the existing archive is uneven, and articles are being reviewed and corrected. The Editorial Team byline identifies editorial responsibility; it does not certify specialist or independent human review. Where we compare products, anything built by our own team is labelled as such — see the editorial guidelines and About page for how corrections and disclosures work.
Related Articles

Countries With the Highest Cost of Living: Price Levels, Housing and Purchasing Power
There is no single universal cost-of-living ranking. This guide separates national price levels, expensive cities, housing affordability, food costs and wages using OECD, Eurostat, World Bank, ILO and EIU data.

Countries With the Highest Homeownership Rates: What the Data Really Show
Homeownership rates are not a simple prosperity ranking. OECD and Eurostat data show how outright ownership, mortgages, renting, housing costs and historic policy produce very different housing outcomes.
Countries With the Most Arable Land (2025)
India and the United States each farm roughly 150 million hectares of arable land, with Russia and China next. Yield, water, and soil decide what that land actually feeds. Here is the ranking and what it leaves out.
AI & Sustainable Agriculture: Feeding 10 Billion Without Destroying the Planet
How machine learning cuts fertilizer and herbicide use, catches disease early, and pushes yield up without expanding farmland.
AI in Sustainable Agriculture: How Crop Yield Prediction Is Changing Farming
Machine learning models are helping farmers grow more food with fewer resources, reducing waste and environmental impact at scale.
Countries That Waste the Most Food (2025 Ranked)
Australia wastes 312 kg of food per person per year — the most in the world. The US wastes 80 million tonnes annually. Globally, one-third of all food produced is lost or wasted — enough to feed every hungry person on Earth twice over. Here's the full picture of global food waste and what the most effective interventions are.