Countries With the Most Arable Land (2025)
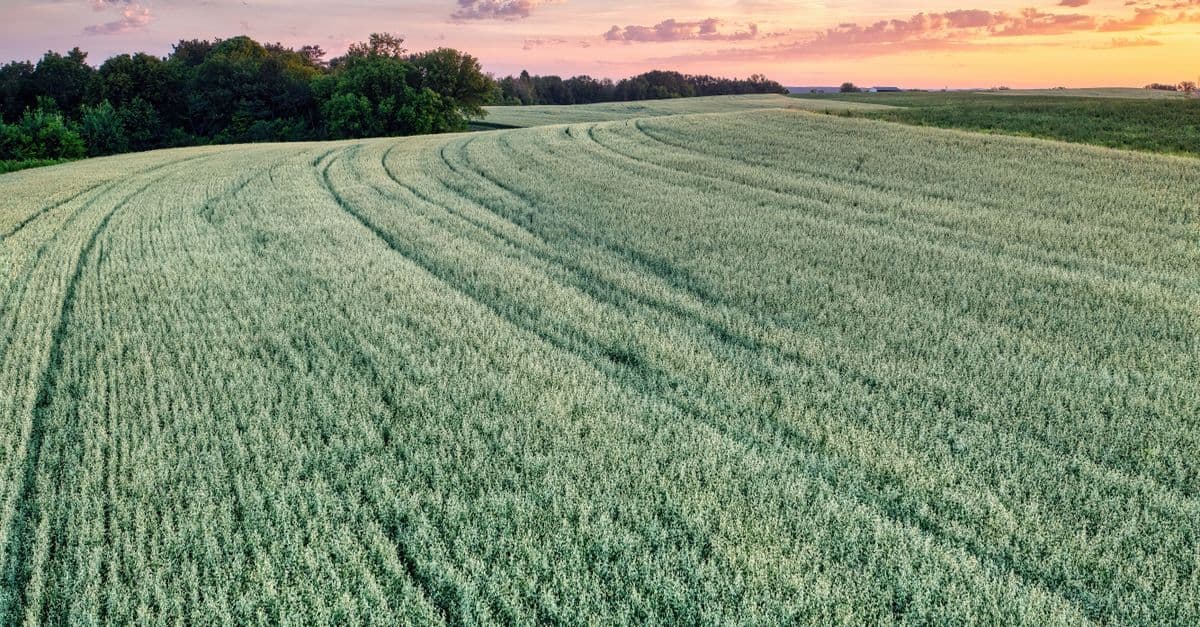
Photo: Tom Fisk / Pexels
India and the United States each farm roughly 150 million hectares of arable land, the most of any country. Russia and China follow, and then there is a steep drop to Brazil at about 56 million hectares. Arable land means land under temporary crops, temporary meadows, gardens, and fallow ground, so it is the part of a country's territory that can grow wheat, rice, corn, and soybeans in a given season. The ranking below uses World Bank figures for 2022, which come from the Food and Agriculture Organization (FAO), and then explains why a bigger number does not always mean more food.
Educational only. Not financial advice. Investing involves risk of loss; past performance does not guarantee future results. This article describes land statistics and agricultural economics and does not recommend any investment.
Farmland is one of the few resources that cannot be manufactured on demand. The FAO has estimated that forming 2 to 3 centimeters of fertile soil can take up to 1,000 years, which is why topsoil lost to erosion or salt is effectively gone on a human timescale (FAO Family Farming Knowledge Platform). That is one reason arable land shows up in discussions of food security, trade, and the strategic weight of countries such as the United States and Ukraine in world commodity markets, and why governments tend to treat it differently from financial assets like national debt.
Key takeaways
- India (154.2 million hectares) and the United States (151.6 million) lead the 2022 World Bank ranking, and the gap between them is small enough that revisions to either country's data could swap the order.
- Russia has 121.6 million hectares and China 108.0 million. Brazil, in fifth place, has 55.6 million, so the top four countries hold a large lead over everyone else.
- Cereal yield per hectare varies by a factor of more than ten between countries. The United States averaged 8,066 kg per hectare in 2022, India 3,564, and Sudan 676.
- Ukraine has about 33 million hectares, yet together with Russia it supplied nearly 30 percent of global wheat exports in the 2017 to 2021 period, per USDA data compiled by the University of Illinois.
- Water, not land, is the limiting factor in many of the largest farming regions, including India's northwest and the U.S. High Plains.
The 2022 ranking: which countries have the most arable land
The table lists the 15 countries with the largest arable area in the World Bank's World Development Indicators series AG.LND.ARBL.HA for 2022. The numbers are rounded to one decimal place and expressed in millions of hectares (one hectare is 10,000 square meters, or about 2.47 acres).
| Rank | Country | Arable land, million hectares (2022) |
|---|---|---|
| 1 | India | 154.2 |
| 2 | United States | 151.6 |
| 3 | Russia | 121.6 |
| 4 | China | 108.0 |
| 5 | Brazil | 55.6 |
| 6 | Argentina | 46.1 |
| 7 | Canada | 38.3 |
| 8 | Nigeria | 36.5 |
| 9 | Ukraine | 32.9 |
| 10 | Australia | 31.3 |
| 11 | Kazakhstan | 30.3 |
| 12 | Pakistan | 30.2 |
| 13 | Sudan | 21.0 |
| 14 | Mexico | 20.6 |
| 15 | Turkiye | 20.2 |
Source: World Bank, World Development Indicators, "Arable land (hectares)," indicator AG.LND.ARBL.HA, year 2022, retrieved through the World Bank API in October 2026. The underlying data are from FAO. The next five countries in the same series are Indonesia (17.8), Niger (17.7), France (17.0), Ethiopia (16.4), and Thailand (15.7).
Two things stand out. First, the order of the top two is a statistical near-tie. India's 154.2 million hectares exceeds the U.S. figure by about 2.7 million hectares, less than two percent, and earlier editions of the same dataset have had the two in the opposite order. Second, several countries that people associate with big agriculture, including France and Germany, sit outside the top 15 once ranked by area. France had 17.0 million hectares and Germany 11.7 million in the same series.
Where this data comes from and what it can't tell you
The World Bank's definition, which it takes from FAO, says arable land covers land under temporary crops, temporary meadows for mowing or pasture, market or kitchen gardens, and temporarily fallow land. Double-cropped areas are counted once, and land abandoned from shifting cultivation is excluded (World Bank metadata for AG.LND.ARBL.HA). Permanent crops such as orchards, vineyards, and coffee plantations are counted in a separate category, and so are permanent pastures.
The World Bank also lists the caveats. Complete consistency across countries and over time is not possible, because definitions, statistical methods, and data quality vary. FAO sometimes revises categories and earlier data, so small year-to-year changes should be read cautiously. Satellite images can show land use that differs from ground-based measures. In some countries the data come from reporting systems originally built to collect land tax, and the World Bank notes that data quality and coverage have declined in places such as India as land taxes became less important as a revenue source.
Think of the numbers as a census taken with different rulers. Each country reports in good faith, yet one country's "temporarily fallow" may be another's "abandoned," and the totals are best read as orders of magnitude rather than precise counts. A difference of a few percent between neighbors in the ranking means very little.
Arable land is not the same as farmland
A common mistake is to treat arable land as all agricultural land. Agricultural land also includes permanent pasture and permanent crops. Australia is the clearest example: it has about 31 million hectares of arable land by this definition, but vast rangelands carry cattle and sheep that never show up in the arable figure. Brazil likewise has far more land in pasture than in annual crops, a fact that matters for the Amazon and Cerrado debate described below.
Arable land per person: a different leaderboard
Dividing arable land by population reshuffles the order completely. The World Bank series AG.LND.ARBL.HA.PC for 2022 gives the following values for large producers.
| Country | Arable land per person (hectares, 2022) |
|---|---|
| Kazakhstan | 1.51 |
| Australia | 1.20 |
| Argentina | 1.02 |
| Canada | 0.98 |
| Russia | 0.84 |
| Ukraine | 0.80 |
| United States | 0.45 |
| Brazil | 0.26 |
| Turkiye | 0.24 |
| Nigeria | 0.16 |
| Mexico | 0.16 |
| Pakistan | 0.12 |
| India | 0.11 |
| China | 0.08 |
| World average | 0.17 |
Source: World Bank, World Development Indicators, indicator AG.LND.ARBL.HA.PC, 2022.
India and China have the most or fourth-most arable land in absolute terms, yet each person there has well under the world average of 0.17 hectares. Kazakhstan, Australia, Argentina, and Canada have between 1.0 and 1.5 hectares per person, which is between six and nine times the global average. That gap explains why these countries are major grain exporters while India and China focus on feeding their own populations. A country's ranking by area says little about its trade position until you divide by the number of mouths.
Yield: why the same hectare feeds very different numbers
Area is one input. The other is how much grain each hectare produces. The World Bank's cereal yield series (AG.YLD.CREL.KG) measures harvested cereals, including wheat, rice, maize, barley, oats, and rye, in kilograms per hectare.
| Country | Cereal yield (kg per hectare, 2022) | Arable land (million ha) |
|---|---|---|
| United States | 8,066 | 151.6 |
| Germany | 7,126 | 11.7 |
| France | 6,655 | 17.0 |
| China | 6,386 | 108.0 |
| Indonesia | 5,393 | 17.8 |
| Brazil | 4,908 | 55.6 |
| Argentina | 4,822 | 46.1 |
| Ukraine | 4,614 | 32.9 |
| Canada | 4,105 | 38.3 |
| Mexico | 3,950 | 20.6 |
| India | 3,564 | 154.2 |
| Turkiye | 3,465 | 20.2 |
| Pakistan | 3,463 | 30.2 |
| Russia | 3,428 | 121.6 |
| Australia | 3,278 | 31.3 |
| Ethiopia | 2,691 | 16.4 |
| Nigeria | 1,660 | 36.5 |
| Kazakhstan | 1,372 | 30.3 |
| Congo, Dem. Rep. | 850 | 15.6 |
| Sudan | 676 | 21.0 |
| World average | 4,186 | |
| Sub-Saharan Africa average | 1,595 |
Source: World Bank, World Development Indicators, indicators AG.YLD.CREL.KG and AG.LND.ARBL.HA, 2022.
The U.S. yield was roughly 2.3 times India's and nearly twice the world average, and it was almost 12 times the yield in Sudan. The multiple also moves with the weather in any given year, so a single year's yield is a snapshot rather than a fixed property of a country.
Some low yields are deliberate. Kazakhstan and Australia grow wheat on dry land with low rainfall, so a low yield per hectare is paired with very large farms and low costs per hectare. Maximizing yield there would mean irrigation that the climate cannot support. Other low yields reflect real constraints, such as limited fertilizer, seed, and roads in much of sub-Saharan Africa, where the regional average of 1,595 kg per hectare is well under half the world figure.
The United States: productivity and the Ogallala question
The U.S. has the highest cereal yield among the large arable-land holders and a farming system built on large machines, hybrid seeds, and heavy use of fertilizer. According to the USDA Economic Research Service, the country had 1.88 million farms in 2024, the lowest count in more than a century, down from 2.04 million in 2017 and a peak of 6.81 million in 1935. Land in farms covered 876 million acres in 2024, and the average farm was 466 acres (USDA ERS, "Number of U.S. farms continues slow decline," April 2025). In other words, the U.S. farms about one-quarter as many farms as it did 90 years ago, and each farm is much larger.
The main long-run risk is water. The High Plains aquifer, often called the Ogallala, underlies about 112 million acres (175,000 square miles) across Colorado, Kansas, Nebraska, New Mexico, Oklahoma, South Dakota, Texas, and Wyoming. U.S. Geological Survey (USGS) analysis found that water in storage had declined about 267 million acre-feet, or 8 percent, from predevelopment (about 1950) to 2011, and that average water levels had fallen 15.4 feet from predevelopment to 2013 (USGS, "High Plains Aquifer Groundwater Levels Continue to Decline"). The USGS linked the 2011 to 2013 decline to increased groundwater pumping, and the agency's later reports show the declines are uneven: the southern and central parts of the aquifer have lost far more than the north.
The aquifer is the clearest example of why arable-land statistics hide dependencies. A hectare of Kansas corn that depends on irrigation from a falling aquifer is counted exactly the same as a hectare of Iowa corn watered by rain. Whether such acreage stays productive depends on pumping rules, crop choices, and the price of energy, not on the number in the table.
For readers interested in how technology changes farming outputs, see AI and sustainable agriculture, which covers precision tools that try to raise yields while using less water and fertilizer.
India: dense cultivation and a groundwater ceiling
India has the world's largest arable area in the 2022 World Bank series, and the land is intensively used: the World Bank puts arable land at 51.9 percent of India's land area, one of the highest shares for any large country. India's cereal yield of 3,564 kg per hectare is below the world average, yet its output is large because so much land is under crops and much is double-cropped, with a rice or wheat harvest followed by another planting.
The "Green Revolution" of the 1960s and 1970s combined high-yielding wheat and rice varieties, irrigation, and fertilizer, and it is closely associated with the plant breeder Norman Borlaug, whose story is told in Norman Borlaug: The Iowa Farm Boy Who Fed a Billion People. Synthetic nitrogen fertilizer, whose chemistry is covered in the Haber-Bosch process explainer, was a central ingredient. The same high-input system now faces a water problem.
India's Central Ground Water Board assesses groundwater by administrative unit (blocks, mandals, and talukas). In the 2024 assessment, 751 of 6,746 units, or 11.13 percent, were classified as over-exploited, meaning groundwater extraction exceeded the annual replenishment. A further 206 units (3.05 percent) were critical, 711 (10.54 percent) semi-critical, and 4,951 (73.39 percent) safe. That is an improvement on 2017, when 17.24 percent of units were over-exploited (PIB, Ministry of Jal Shakti release on the 2024 assessment).
The national average conceals a regional pattern. Over-exploited units cluster in Punjab, Haryana, Delhi, western Uttar Pradesh, Rajasthan, Gujarat, and parts of the south. Those are the regions where rice and wheat are grown on pumped groundwater, which is the part of India's agriculture most tied to the Green Revolution. For a wider look at the global picture, see Water Scarcity: The Growing Global Crisis Explained.
Russia and Ukraine: a large share of exports from a modest share of land
Russia's 121.6 million hectares and Ukraine's 32.9 million hectares together equal roughly 154 million hectares, about the same as India alone. They matter more for trade than for total output because both are net exporters. The University of Illinois farmdoc team, using USDA Foreign Agricultural Service data, calculated that the two countries supplied nearly 30 percent of global wheat exports on average from 2017 to 2021, that Ukraine supplied over 15 percent of world corn exports, and that the two together accounted for over 75 percent of world sunflower oil exports (farmdoc daily, February 2022).
Russia's full-scale invasion of Ukraine in February 2022 put Ukrainian ports out of reach for commercial shipping. The Black Sea Grain Initiative, signed in Istanbul in July 2022, reopened three Ukrainian ports. By July 15, 2023, the UN coordinator's office reported that about 32.8 million tonnes of grain and foodstuffs had left those ports on 1,003 voyages, going to 45 countries. Asia received 46 percent, Western Europe 40 percent, and Africa 12 percent. For wheat, 38 percent went to high-income countries and 9 percent to low-income countries (UN operational update, July 2023). The arrangement ended on July 17, 2023, when Russia announced it would not extend the deal.
The distribution is a useful correction to a common story. The corridor's grain mostly went to richer and middle-income buyers by volume, and the effect on poorer countries was felt mainly through world prices rather than direct shipments. For the broader picture of who suffers when staples get expensive, see Countries With the Worst Hunger and Food Insecurity.
Ukraine's land has a particular advantage: its chernozem, or black earth, soils are rich in organic matter. The World Bank puts arable land at 56.8 percent of Ukraine's land area, the highest share among the countries discussed here. Ukraine's cereal yield of 4,614 kg per hectare is above Russia's 3,428, partly because more of Russia's arable land lies in dry or short-season regions.
China: intensive farming on limited land per person
China ranks fourth with 108.0 million hectares, but it has only 0.08 hectares of arable land per person, less than half the world average. It compensates with one of the world's highest cereal yields among large countries, 6,386 kg per hectare, which is 53 percent above the global average of 4,186. High yields come from irrigation, intensive fertilizer use, and multiple crops per year in the southern and eastern provinces.
This is the opposite model from Kazakhstan. Kazakhstan has twenty times more arable land per person than China and a cereal yield of 1,372 kg per hectare. The two countries use the same resource very differently, and each has made a rational choice for its climate and population. China's challenge is that high yields have already been squeezed hard, so future gains are costly, and soil quality and water in the north are binding constraints. Our overview of the countries that produce the most food compares production by value and commodity rather than land area.
Brazil and the arable-land accounting trap
Brazil's arable area of 55.6 million hectares looks modest next to India or Russia. It understates Brazil's weight in global agriculture for two reasons. Much of Brazil's agricultural land is pasture that does not count as arable, and the country grows two crops in a year on much of its cropland, usually soybeans followed by corn, so the harvested area exceeds the arable area.
Brazil is now one of the world's largest soybean producers and exporters, and successive crop forecasts from the USDA Foreign Agricultural Service have set records in recent seasons. The expansion happened largely in the Cerrado, a tropical savanna, and the environmental cost is the subject of continuing research. MapBiomas, the Brazilian land-cover monitoring network, has documented a large expansion of soybean area across the Cerrado since 1985 and continuing conversion of native vegetation, especially in the northeastern frontier known as Matopiba. Land-use change linked to soy and cattle is one of the main sources of Brazil's greenhouse gas emissions, so the productivity of existing land is a climate issue as much as an economic one.
For the forest side of this trade-off, see Countries With the Most Forest Cover.
Africa: land that is available and yields that are not
Africa has several countries with large arable areas. Nigeria has 36.5 million hectares, Sudan 21.0 million, Niger 17.7 million, Ethiopia 16.4 million, and the Democratic Republic of Congo 15.6 million. Their cereal yields in 2022 ranged from 676 kg per hectare in Sudan to 2,691 in Ethiopia, and the sub-Saharan average was 1,595. Closing even part of the gap to the world average of 4,186 would add a very large amount of grain without clearing new land.
Why yields are low is a mix of factors. Fertilizer use per hectare is low, seed varieties are often not improved, irrigation is limited, roads and storage are poor, and conflict in places such as Sudan disrupts planting. These are exactly the kind of factors that the arable-land ranking leaves out. The table makes Nigeria look like a farming powerhouse, ranked eighth in the world by area, but its yield of 1,660 kg per hectare is well under half of the global average.
The implication for food security is the reverse of what a land ranking suggests. Countries at the top of the ranking by area, such as India and China, are not necessarily rich in spare land. Several countries lower down hold large reserves of land that could be farmed more productively, and the barrier is investment and stability rather than geography.
Three nested measures: arable, cropland, and agricultural land
Land statistics use three overlapping terms, and mixing them is the most common source of confusing headlines. Arable land is the narrowest: temporary crops, temporary meadows, gardens, and fallow. Cropland adds permanent crops such as orchards, vineyards, and plantations. Agricultural land adds permanent meadows and pastures on top of that. Think of three nesting dolls, each holding the one before.
FAO's land statistics give the global scale of each outer doll. In 2023, world agricultural land was about 4,800 million hectares, more than one-third of the global land area, of which about 1,600 million hectares was cropland and about 3,200 million hectares was permanent meadows and pastures (FAO, Land statistics 2001-2023). Two-thirds of the world's farmland, in other words, is grazing land that never appears in an arable ranking.
| Measure | What it includes | World total (FAO, 2023) |
|---|---|---|
| Arable land | Temporary crops, temporary meadows, gardens, fallow | Subset of cropland (country series from the World Bank, as above) |
| Cropland | Arable land plus permanent crops | About 1,600 million ha |
| Permanent meadows and pastures | Grazing land | About 3,200 million ha |
| Agricultural land | Cropland plus pasture | About 4,800 million ha |
The four largest countries in the 2022 table hold 535.4 million hectares of arable land between them (154.2 plus 151.6 plus 121.6 plus 108.0). Against FAO's roughly 1,600 million hectares of cropland, which is a wider category, that is about a third, so the top four countries hold somewhat more than a third of the world's arable land. The arithmetic is approximate because the two series use different definitions and years.
More food from the same land
If the ranking measured what mattered, the best-fed countries would be the ones with the most land. The long-run record shows the opposite: output has grown far faster than area. FAO reports that global agricultural production tripled over 60 years with only an 8 percent increase in agricultural land, and that expanding the farmed area is no longer a viable path to the extra food needed by 2050, when agriculture must produce about 50 percent more food, feed, and fiber than in 2012 alongside 25 percent more freshwater (FAO newsroom on the 2025 State of the World's Land and Water Resources).
That tripling came from yield, not acreage: improved crop varieties, irrigation, and synthetic fertilizer. The chemistry behind the fertilizer is traced in Artificial Fertilizer: The Invention That Feeds Half the World. The same FAO release warns that more than 60 percent of human-induced land degradation occurs on agricultural land, so the intensive methods that raised yields also threaten the soil and water that sustain them.
Where cropland is growing and shrinking
Global cropland grew by about 80 million hectares, or 5 percent, between 2001 and 2023, while permanent meadows and pastures fell by about 150 million hectares, a 4 percent decrease. Netting the two, total agricultural land shrank by roughly 70 million hectares over the same period. The change was uneven across regions, as FAO's regional breakdown shows.
| Region | Change in cropland, 2001 to 2023 (million ha) |
|---|---|
| Africa | +75 |
| South America | +25 |
| South-eastern Asia | +20 |
| Northern America | -25 |
| Eastern Europe | -7 |
| Southern Europe | -6 |
Source: FAO, Land statistics 2001-2023. Regions not listed are omitted here and are not necessarily unchanged.
The pattern tells a story the static ranking hides. Africa added the most cropland, in a region where, as described above, yields are low and adding area is one way to grow output. Northern America lost about 25 million hectares, which shows that even a leading producing region can shrink its cropland. Neither direction is automatically good or bad. Expansion in the tropics can mean clearing savanna or forest, while contraction in rich countries can reflect urban growth or marginal fields leaving production.
Why a land ranking is a poor guide to food supply
Three misreadings are common. The first is treating area as output. As the yield table shows, a hectare in the United States produced about 2.3 times the cereal of a hectare in India in 2022. The second is treating a high rank as strategic security. Russia and Ukraine matter to wheat markets because of exports, not because of area alone. The third is treating the ranking as stable. The top two sit within two percent of each other, and revisions can swap them.
A fourth, subtler point concerns time. Arable land is a stock, while food is a flow that depends on rain, heat, pests, and prices each season. A drought year can cut output on the same hectares by a large fraction without changing the arable-land number at all. Rankings by area are therefore most useful as the denominator in other calculations, such as yield per hectare or land per person, rather than as conclusions in themselves.
What arable land rankings leave out
A ranking by area is a starting point. Several other measures change the picture.
| Measure | What it adds | Where to find it |
|---|---|---|
| Cereal yield | Output per hectare, which can differ more than tenfold | World Bank AG.YLD.CREL.KG |
| Arable land per person | Whether a country has room to export | World Bank AG.LND.ARBL.HA.PC |
| Irrigation and water stress | Whether yields depend on a depleting source | FAO AQUASTAT, USGS, national groundwater boards |
| Land quality | Soil depth, organic matter, salinity | FAO soil databases, national surveys |
| Trade balance | Net exports or imports of grain | USDA FAS PSD database, FAO trade statistics |
| Conflict and governance | Whether farms can plant and ship | UN, WFP, FAO reports |
Reading the table above across a row shows how misleading the single number can be. The U.S. combines large area, high yield, and exports. India has large area, mid yields, and a population that absorbs nearly all of its output. Nigeria has large area, low yields, and large food needs.
Climate, water, and the future of arable land
Arable land is not fixed. Cropland expands into new areas and contracts as soil degrades, cities spread, or land is abandoned. Climate change is likely to alter the geography of farming, with warming extending the growing season in some northern areas and increasing heat and water stress in others. How much net change results is uncertain, and published projections differ widely by region and crop, so claims that the world will gain or lose a specific number of million hectares by 2050 or 2100 should be treated cautiously.
What is better established is that water is the constraint that tends to bind first. The World Bank figure for arable land per person worldwide, 0.17 hectares in 2022, is low enough that yield gains have to do most of the work of feeding a growing population. Irrigated land is the most productive part of the system and also the most exposed, because the aquifers and rivers that supply it are limited. This is the logic behind the interest in precision agriculture, drought-tolerant varieties, and drip irrigation, and also behind the policy attention given to groundwater regulation in India and the U.S. High Plains.
A second area of uncertainty is how well the underlying data capture reality. Remote sensing has improved land-cover mapping, but definitions of "fallow" and "abandoned" remain a matter of national reporting. Future editions of FAO and World Bank data will almost certainly revise some of the numbers above.
Frequently asked questions
Q: Which country has the most arable land? A: India, with about 154.2 million hectares in 2022 according to the World Bank, which uses FAO data. The United States is a close second at 151.6 million hectares. The two are separated by less than two percent, and revisions to the underlying data could change their order.
Q: Which country has the most arable land per person? A: Among large countries, Kazakhstan, with about 1.51 hectares per person in 2022, followed by Australia (1.20), Argentina (1.02), and Canada (0.98). The world average is 0.17 hectares per person. India (0.11) and China (0.08) are well below it.
Q: Is the amount of arable land growing or shrinking? A: It varies by country and period. Land is added through clearing and drainage and lost to erosion, salinization, urban growth, and abandonment. World Bank and FAO statistics also change as definitions and reporting improve, so trends over long periods should be read with caution. Because yields have risen, global food output has grown much faster than arable area.
Q: Why does the United States produce so much more grain per hectare than India? A: The U.S. cereal yield was 8,066 kg per hectare in 2022 compared with 3,564 in India, a ratio of about 2.3. Contributing factors include crop mix (the U.S. grows a lot of high-yielding maize), mechanization, input use, farm size, and climate. India grows more rice and wheat on smaller farms, often with limited irrigation reliability.
Q: Does having more arable land make a country food secure? A: Not by itself. Food security also depends on yield, water, income, trade access, storage, and stability. Sudan has 21.0 million hectares of arable land but a cereal yield of 676 kg per hectare and widespread conflict. Japan has a much smaller arable area than the countries in the table and relies on imports financed by a large economy.
Q: How did the war in Ukraine affect world food supplies? A: Before 2022, Russia and Ukraine together supplied nearly 30 percent of global wheat exports and over 75 percent of sunflower oil exports (USDA data compiled by farmdoc daily). Disruption to Ukrainian ports in 2022 cut exports until the Black Sea Grain Initiative, under which about 32.8 million tonnes were shipped by mid-July 2023. Ukrainian exports have continued by other routes since then.
Q: What counts as arable land? A: FAO defines it as land under temporary crops, temporary meadows for mowing or pasture, market and kitchen gardens, and temporarily fallow land. Permanent crops such as orchards and vineyards, and permanent pasture, are separate categories. Land abandoned from shifting cultivation is excluded.
The bottom line
The countries at the top of the arable-land ranking are India, the United States, Russia, and China, and the first two are close to a tie. The ranking is useful for scale but weak as a predictor of what a country can grow or sell. Yield differs by more than a factor of ten between countries, arable land per person ranges from 0.08 to more than 1.5 hectares among large countries, and the water behind much irrigated cropland is being used faster than it is replaced in some of the most productive regions. The next decades of food supply depend less on adding land than on how far yields rise on the land already farmed and how well the water holds up.
Sources
- World Bank, World Development Indicators: Arable land (hectares), AG.LND.ARBL.HA, with per-person (AG.LND.ARBL.HA.PC) and cereal yield (AG.YLD.CREL.KG) series, 2022; data from FAO.
- USDA Economic Research Service: Number of U.S. farms continues slow decline, April 2025.
- USGS: High Plains Aquifer Groundwater Levels Continue to Decline.
- PIB, Government of India: Dynamic Ground Water Resource Assessment Report 2024.
- UN Geneva: Operational update, UN Coordinator for the Black Sea Grain Initiative, July 2023.
- farmdoc daily, University of Illinois: Revisiting Ukraine, Russia, and agricultural commodity markets, February 2022 (data from USDA FAS PSD).
- FAO: Family Farming Knowledge Platform, soil formation note.
- FAO: Land statistics 2001-2023: global, regional and country trends.
- FAO newsroom: Better land, soil and water management key to feeding 10 billion people, 2025.
Related Reading
Follow new articles
Add SciHub101 to your feed reader to see new science and technology stories.
About the Author
SciHub101 is an independent science and technology publication founded and edited by Buğra Sözeri, a software engineer and app developer based in Türkiye. AI tools assist with drafting and research. Source documentation in the existing archive is uneven, and articles are being reviewed and corrected. The Editorial Team byline identifies editorial responsibility; it does not certify specialist or independent human review. Where we compare products, anything built by our own team is labelled as such — see the editorial guidelines and About page for how corrections and disclosures work.
Related Articles

Countries With the Most Billionaires (2025 Rankings)
The United States leads the world with 813 billionaires, but China's rapid rise to second place with 473 signals a profound shift in global wealth creation. Here's the definitive 2025 ranking of billionaire nations.

Countries With the Lowest Tax Rates in the World (2025-2026)
Gulf states, the Cayman Islands, and the Bahamas charge no personal income tax. Hungary, Bulgaria, and Ireland lead on corporate rates. Here is who charges what, who pays the bills instead, and what the OECD 15% floor changed.
Countries That Produce the Most Food (Ranked, 2026 Update)
China leads almost every broad measure of food output, but the ranking changes with the metric. Here is who leads by value added, by staple crop tonnage, and by meat and milk, with sources and caveats.
Countries with the Most Agricultural Land (FAO 2022 Ranked)
The United States has the most agricultural land at about 421 million hectares, ahead of China and Australia. But India has the most cropland, Kazakhstan has the most arable land per person, and most of the world's farmland is pasture. Here is who has what, and what threatens it.

Artificial Fertilizer: The Invention That Feeds Half the World
How Fritz Haber and Carl Bosch synthesized nitrogen from air in 1909–1913, feeding billions — and triggering an environmental crisis that still grows.
What If All Bees Disappeared?
Bees pollinate $235B in crops yearly. If they vanished, almonds, apples, and coffee would collapse — but humanity wouldn't starve. Here's why.