Countries With the Most Rare Earth Metals (USGS 2026 Data)
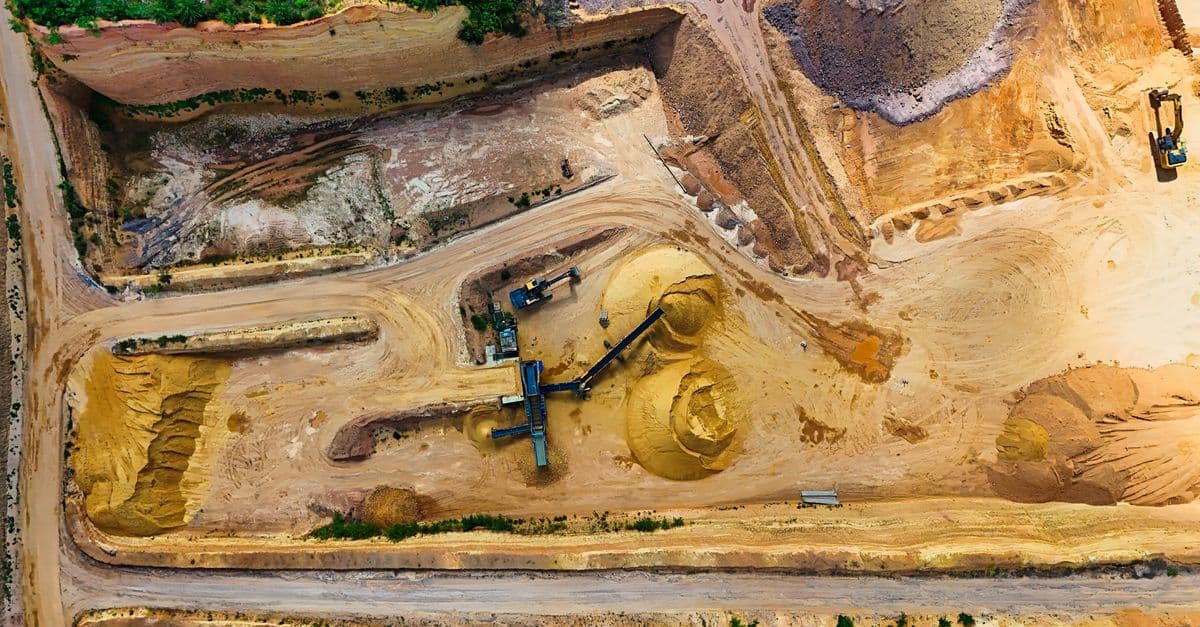
Photo: Volker Braun / Pexels
Rare earth elements are a group of 17 metals, the 15 lanthanides plus scandium and yttrium, that sit inside electric-vehicle motors, wind turbine generators, hard drives, camera lenses, and guided missiles. The U.S. Geological Survey (USGS) estimates that China holds about 44 million tonnes of rare earth oxide reserves and mined roughly 270,000 tonnes in 2025, about 69% of a world total near 390,000 tonnes. Reserves, mine output, and refining are three different rankings, and they do not match.
Educational only, not financial advice. Investing involves risk of loss; past performance does not guarantee future results. Consult a licensed financial advisor before making investment decisions. This article describes mineral statistics and supply chains. It does not recommend any company or security.
The name is misleading. USGS states that rare earths are "relatively abundant in Earth's crust, but minable concentrations are less common than for most other mineral commodities." The scarce thing is not the metal itself but a deposit rich enough, with the right chemistry, and a chemical industry able to pull seventeen near-identical elements apart. Most of this article is about that second problem, because it explains why a country can top one table and barely appear on another.
All reserve and production figures below come from the USGS Mineral Commodity Summaries 2026 (published February 2026) unless noted. Where the 2025 edition gave a materially different figure, that is flagged, because several widely repeated numbers, including Vietnam's, were revised downward.
Key takeaways
- USGS puts China's reserves at 44 million tonnes of rare earth oxide (REO) equivalent and its 2025 mine production at 270,000 tonnes, about 69% of the estimated world total of 390,000 tonnes.
- Brazil (11 million tonnes) is second in reserves, followed by Australia (6.3 million), Russia (3.8 million), and Vietnam (3.5 million). Vietnam was listed at 3.5 million tonnes in both the 2025 and 2026 editions, far below the 22 million tonnes older articles still repeat.
- The United States is the second-largest producer, at 51,000 tonnes of REO in mineral concentrates in 2025, but still sent much of that material abroad for processing.
- The International Energy Agency (IEA) reports that China is the dominant refiner for 19 of 20 energy-related minerals it tracks, with an average market share around 70%. Refining and magnet manufacturing are more concentrated than mining.
- In April 2025 China added export controls on seven medium and heavy rare earths and related products, and in October 2025 expanded them, before suspending the October measures for one year in November.
Top countries by rare earth reserves
Reserves are the part of a resource that can be extracted profitably under current conditions, as defined by USGS. They change when prices, technology, or a government report changes. The table lists every country USGS reports a reserve figure for in 2026.
| Rank | Country | Reserves (tonnes REO) | Notes |
|---|---|---|---|
| 1 | China | 44,000,000 | Unchanged from the 2025 edition |
| 2 | Brazil | 11,000,000 | Revised down from 21,000,000 in 2025 based on government reports |
| 3 | Australia | 6,300,000 | 3,300,000 tonnes meet JORC (Joint Ore Reserves Committee) standards |
| 4 | Russia | 3,800,000 | Revised in the 2025 edition from older figures |
| 5 | Vietnam | 3,500,000 | Well below the 22,000,000 tonnes in earlier editions |
| 6 | United States | 1,900,000 | Mostly Mountain Pass, California |
| 7 | Greenland | 1,500,000 | No current production |
| 8 | Tanzania | 890,000 | No current production |
| 9 | South Africa | 860,000 | No current production |
| 10 | Canada | 830,000 | No current production |
| 11 | Malaysia | 710,000 | New reserve figure in 2026 |
Source: USGS, Mineral Commodity Summaries 2026, "Rare Earths," February 2026. India, Burma, Madagascar, Nigeria, and Thailand are listed as "NA" (not available) for reserves. Reserves for India were 6.9 million tonnes in the 2025 edition but were not reported in 2026. World reserves are given only as "more than 75,000,000 tonnes."
Two details matter more than the order. First, China's 44 million tonnes is a bit under 59% of that 75 million tonne floor, and the true world total is higher than the floor, so China's share of reserves is lower than that. China's share of mining (about 69%) therefore runs well ahead of its share of the ground. Second, the world total itself fell: the 2025 edition said "more than 90,000,000 tonnes," the 2026 edition says "more than 75,000,000." That drop is largely the Brazil and India revisions, not a physical loss of rock.
Top countries by rare earth mine production
Production is the more reliable table. Companies report what they ship, customs agencies record exports, and analysts can cross-check both. Even so, USGS flags that several of the figures, notably Burma's, are estimated from Chinese import data.
| Rank | Country | 2024 (tonnes REO) | 2025 est. (tonnes REO) | Share of 2025 world total |
|---|---|---|---|---|
| 1 | China | 270,000 | 270,000 | about 69% |
| 2 | United States | 45,500 | 51,000 | about 13% |
| 3 | Australia | 29,000 | 29,000 | about 7% |
| 4 | Burma (Myanmar) | 27,000 | 22,000 | about 6% |
| 5 | Thailand | 2,100 | 4,800 | about 1% |
| 6 | India | 2,900 | 2,900 | under 1% |
| 7 | Madagascar | 1,400 | 2,700 | under 1% |
| 8 | Russia | 2,600 | 2,600 | under 1% |
| 9 | Brazil | 560 | 2,000 | under 1% |
| 10 | Nigeria | 1,500 | 1,500 | under 1% |
Source: USGS, Mineral Commodity Summaries 2026. Shares are calculated here from USGS figures against the 390,000-tonne 2025 world total. Vietnam (150 tonnes), Malaysia (110 tonnes), and "other" (550 tonnes) make up most of the rest.
The top four countries account for about 95% of 2025 output by this arithmetic (270,000 + 51,000 + 29,000 + 22,000 is 372,000 tonnes of 390,000). Brazil, which ranks second in reserves, mined an estimated 2,000 tonnes. Vietnam, once cited as the sleeping giant, mined about 150.
Why the reserve map and the production map disagree
If you only read one of the tables above you would draw the wrong conclusion about each country. A few reasons the two rankings diverge:
- Reserves need a buyer. A deposit counts as a reserve only if someone can profitably mine it. Brazil reports large reserves, but until a processing route and a customer exist, output stays small.
- Geology decides the cost. Some ores, like the weathered clays of southern China and Burma, can be leached with relatively simple chemistry. Hard-rock ores like bastnaesite, the main mineral at Mountain Pass, need crushing, flotation, and acid roasting. Cost per tonne of oxide differs a lot.
- Politics sets the permit. Greenland has 1.5 million tonnes of reserves and produces nothing. A 2021 law banned uranium prospecting and mining, and the major deposit at Kvanefjeld contains uranium alongside rare earths (more below).
- Reporting rules differ. Australia's reserve figure is 6.3 million tonnes, but only 3.3 million tonnes meet the strict JORC audit standard. A country that publishes tighter numbers can look smaller than a country that does not.
An analogy helps. Think of a wine region. Land suitable for vineyards (the resource) is far larger than the acres actually planted (the reserve), which is larger again than the bottles on shelves (production). Rare earths add one more layer: even if you have grapes, you need a winery. In this case the winery is the separation plant.
What counts as a rare earth, and why the heavy ones matter
The 17 elements are usually split into light and heavy groups. Lanthanum, cerium, praseodymium, and neodymium are light rare earths and are found in large quantities. Heavy rare earths such as dysprosium and terbium (plus yttrium) are much less abundant in most ores, and they are the ones that make magnets tolerate heat.
The price table makes the split visible. USGS publishes annual average prices (free on board, from Argus Media) for several oxides:
| Oxide (price per kg) | 2021 | 2022 | 2023 | 2024 | 2025 |
|---|---|---|---|---|---|
| Lanthanum oxide, 99.5% | $1.51 | $1.39 | $0.96 | $0.97 | $1.00 |
| Cerium oxide, 99.5% | $1.54 | $1.45 | $1.03 | $1.21 | $1.71 |
| Praseodymium oxide, 99.99% | $93 | $128 | $76 | $56 | $74 |
| Neodymium oxide, 99.5% | $98 | $134 | $78 | $56 | $73 |
| NdPr oxide, 99% | $92 | $124 | $75 | $55 | $69 |
| Europium oxide, 99.99% | $31 | $30 | $27 | $27 | $27 |
Source: USGS Mineral Commodity Summaries 2026, U.S. salient statistics table. Heavy rare earth prices such as dysprosium and terbium were listed in the 2025 edition for 2024 at $260 and $810 per kilogram for 99.5% and 99.99% oxides, respectively.
Lanthanum, used mostly in catalysts and glass, sold for about a dollar a kilogram in 2025. Neodymium oxide, the key magnet metal, sold for about 73 times as much. USGS's 2025 edition put terbium oxide at $810 per kilogram in 2024. That is the economic meaning of "light" and "heavy": you cannot mine a deposit for its cheap elements and make money unless you can sell the expensive ones too, and the cheap ones are produced in larger volumes than the market needs.
Where the magnets go
USGS says the leading global use of rare earths is magnets, while in the United States the leading domestic end use is catalysts. The magnet that matters is the neodymium-iron-boron (NdFeB) type, the strongest commercial permanent magnet. For a plain-language explanation of why some materials hold a field and others do not, see How Magnetism Works: From Atoms to Earth. NdFeB magnets turn up in the traction motors of electric cars, in wind turbine generators, and in precision actuators. Adding a bit of dysprosium or terbium lets the magnet keep its strength at high temperatures, which is why those two metals receive disproportionate attention. Related background on where that demand comes from is in Countries With the Most Electric Vehicles and Countries With the Most Wind Power Capacity.
The chain: mine, separate, refine, magnet
Mining is the first of four steps, and it is the least concentrated. Rare earth ore comes out of the ground as a mixture. It then moves through:
- Beneficiation. Crushing and concentrating the ore, usually to a mixed rare earth concentrate. This often happens at the mine.
- Separation. Dissolving the concentrate and using solvent extraction, a long cascade of mixer-settler tanks, to separate one element from another. Neighboring rare earths differ by only a tiny amount in chemical behavior, so many repeated stages are needed to reach high purity.
- Metal and alloy making. Converting oxides to metals, then to the alloys used in magnets.
- Magnet manufacturing. Powdering, pressing, sintering, and coating the magnet block.
A coffee analogy fits here. Mining is harvesting cherries. Separation is the roasting, grading, and blending that decides whether the beans are worth anything. Plenty of countries can grow the cherries; very few have the roasters, and the roasters hold the margin.
The IEA's 2025 Global Critical Minerals Outlook gives the broad picture. For 20 energy-related minerals it tracks, China is the dominant refiner of 19, with an average market share around 70%. The average share of the top three refining countries across key energy minerals rose from about 82% in 2020 to 86% in 2024. The IEA also notes that China was the top single supplier behind about 90% of the growth in refining between 2020 and 2024 for minerals including rare earths, cobalt, and graphite.
For rare earths specifically, the IEA names China as the source of most of the growth in refining supply since 2020, and notes that Europe, Malaysia, and the United States are investing in separation facilities while magnet-making capacity is being developed in Europe, Japan, Korea, and the United States. The pattern is the point: the further downstream, the higher the concentration. A country that mines a lot and ships concentrate out earns a small slice of the final value.
How China came to dominate, and what changed after 2010
The Chinese position was built over decades. The country has a very large deposit at Bayan Obo in Inner Mongolia and ionic clay deposits in the south, a state policy that treated rare earths as a strategic industry, and a chemical sector willing to scale solvent extraction. As Chinese oxide prices fell, producers elsewhere found it hard to compete.
The Mountain Pass mine in California illustrates what happened outside China. The mine closed in 2002 after a toxic waste spill and competition from Chinese suppliers. Chevron sold it in 2008 to Molycorp Minerals, a private company formed to revive it, and Molycorp listed on the New York Stock Exchange in 2010. The company filed for Chapter 11 bankruptcy in June 2015, with about $1.4 billion in outstanding bonds. MP Materials acquired the assets out of bankruptcy in July 2017 and resumed mining and refining in early 2018.
In 2010 a diplomatic dispute between China and Japan disrupted rare earth shipments, and Western governments and companies began looking again at mines outside China. Molycorp's difficulties show how hard it is to build a Western supply chain on market prices alone, which is part of why governments now discuss price floors (more below).
China's export policy also went to the World Trade Organization (WTO). The United States, the European Union, and Japan filed a complaint in 2012 about Chinese export duties and quotas on rare earths, tungsten, and molybdenum. A WTO panel found in March 2014 that the measures breached China's obligations, and the Appellate Body upheld the report in August 2014. The ruling did not end the leverage. China later shifted to licensing and technology controls, which are harder to challenge.
The 2025 export controls in plain terms
USGS summarizes the recent sequence in its 2026 edition:
| Date | Action |
|---|---|
| April 2025 | China adds specific export controls on alloys, compounds, metals, and oxides of samarium, gadolinium, terbium, dysprosium, lutetium, scandium, and yttrium |
| October 2025 | China expands controls to include europium, holmium, erbium, thulium, and ytterbium |
| November 2025 | China suspends the October controls for one year; the April controls stay in effect, though China begins issuing general licenses to selected exporters |
Source: USGS Mineral Commodity Summaries 2026, "Events, Trends, and Issues."
The IEA's executive summary described the early-2025 measures as part of a wider trend in which more than half of a broader group of energy-related minerals are subject to some form of export control. The mechanism is a licensing requirement, not a ban. A licensing regime lets a government slow shipments to one buyer while approving them to another, which is a more flexible tool than a quota. For buyers, the uncertainty itself is the cost: a magnet maker that cannot be sure of dysprosium supply next quarter has to hold inventory, qualify alternatives, or accept delays.
The United States: second in mining, still dependent downstream
The U.S. numbers look odd at first. The country mined an estimated 51,000 tonnes of REO in mineral concentrates in 2025 and valued that at $240 million, according to USGS. Bastnaesite from Mountain Pass was the primary product, and monazite was also produced from heavy-mineral sands in the southeastern United States. Yet USGS says the net import reliance for rare earth compounds and metals was 67% of apparent consumption in 2025, up from 53% in 2024. Mining is not the constraint. Downstream capacity is.
| U.S. indicator (USGS) | 2024 | 2025 (est.) |
|---|---|---|
| Mineral concentrates produced (tonnes REO) | 45,500 | 51,000 |
| Compounds and metals produced (tonnes) | 4,300 | 8,900 |
| Compounds imported (tonnes) | 8,120 | 21,000 |
| Ores and compounds exported (tonnes) | 37,500 | 14,000 |
| Net import reliance, compounds and metals | 53% | 67% |
Source: USGS Mineral Commodity Summaries 2026. USGS notes the value of imported compounds and metals fell from $168 million to $165 million in 2025, "reflecting a shift toward lower-value imported products."
Two things stand out. First, exports of ores and compounds fell from 37,500 tonnes to 14,000 tonnes, consistent with the U.S. keeping more of its concentrate at home rather than shipping it to China. Second, the 2021 to 2024 import sources for rare earth compounds and metals were China (71%), Malaysia (13%), Japan (5%), and Estonia (5%). Compounds from Malaysia, Japan, and Estonia were derived from concentrates and chemical intermediates produced in Australia, China, and elsewhere, so the real share of Chinese origin is probably higher than the headline.
The 2025 Pentagon deal with MP Materials
In July 2025 the U.S. Department of Defense and MP Materials announced a public-private partnership. According to the company's announcement, the terms were:
- DoD buys $400 million of new convertible preferred stock plus a warrant, together equal to about 15% of shares outstanding as of July 9, 2025.
- A 10-year minimum price of $110 per kilogram for MP's neodymium-praseodymium (NdPr) products, whether stockpiled or sold.
- A second U.S. magnet plant (the "10X" facility) expected to begin commissioning in 2028, bringing total U.S. magnet capacity to an estimated 10,000 tonnes, with a commitment letter from JPMorgan Chase and Goldman Sachs for $1.0 billion of financing.
- An offtake commitment from DoD covering the plant's magnets, as described by the company.
- A $150 million DoD loan, which the company said it expected to receive, to expand heavy rare earth separation at Mountain Pass.
Compare the price floor with the market. USGS lists the 2025 average NdPr oxide price at $69 per kilogram. A floor of $110 is about 59% above that average. That gap is the policy: a floor is meant to let a Western producer survive a price dip like the one in 2024, when NdPr oxide averaged $55 per kilogram. It also means the U.S. government is paying for resilience, a cost that does not show up in the market price.
This is a reported commercial transaction, and the long-term outcome is not known. Commissioning dates for new plants often slip, and a price floor only helps if the plant produces on time.
Australia, Burma, and the smaller producers
Australia is the third-largest producer at 29,000 tonnes in both 2024 and 2025. Lynas Rare Earths is the best-known operator. In May 2025 Lynas announced that it had produced dysprosium oxide at its Malaysian plant and described itself as the only commercial producer of separated heavy rare earths outside China. That is the company's own claim, not an independently audited one. The Malaysian plant processes Australian concentrate, which is why USGS lists Malaysia's 2026 reserves (710,000 tonnes) separately from its small mine output (110 tonnes).
Burma (Myanmar) matters mainly for heavy rare earths. USGS estimates its 2025 output at 22,000 tonnes, down from 27,000 in 2024, based on Chinese import data. These are ionic clay deposits, where rare earths are recovered by leaching. Production is partly informal, and the data are less certain than any other figure in this article.
Thailand, Madagascar, Nigeria, and India all appear in the table with small but rising or steady outputs. Thailand's estimate more than doubled from 2,100 tonnes in 2024 to 4,800 tonnes in 2025. Several of these numbers rest on trade data rather than company reports, and USGS says it made "significant revisions" to the 2024 production figures for Australia, Brazil, Burma, Madagascar, Nigeria, and Vietnam in the 2026 edition.
Brazil, Vietnam, Greenland: large on paper, small in practice
Brazil reports 11 million tonnes of reserves in the 2026 edition, down from 21 million in 2025, and mined an estimated 2,000 tonnes in 2025, up from 560 tonnes the year before. The jump is large in percentage terms and small in absolute terms. The gap between reserves and output reflects the need for processing capacity and a regulatory path for monazite, which carries radioactive thorium.
Vietnam shows how fast a headline number can move. Earlier editions listed 22 million tonnes of reserves. USGS revised Vietnam "based on company and Government reports" to 3.5 million tonnes in the 2025 edition and kept it there in 2026. Many websites, including earlier versions of this article, still quote the old figure. Vietnam's 2025 mine output is estimated at 150 tonnes. It may still be a long-run source, but the evidence for the 22 million tonne number has gone.
Greenland is a policy story. USGS lists 1.5 million tonnes of reserves and no production. Greenland's parliament passed a 2021 law banning uranium prospecting, exploration, and exploitation, and the Kvanefjeld project, which contains uranium alongside rare earths, could not receive its exploitation licence. The developer, Greenland Minerals (now part of Energy Transition Minerals), started arbitration against the governments of Greenland and Denmark in March 2022, arguing that the ban unlawfully expropriated its investment. The dispute is unresolved as far as the sources reviewed here show. The lesson is that reserves under ice, with a legal fight attached, may not be a near-term supply.
Russia and India: reserves without much market impact
Russia holds 3.8 million tonnes of reserves and mined 2,600 tonnes in 2025. India's reserve figure disappeared from the 2026 table, and USGS notes only that a 2015 report from India's state-owned OSCOM indicated monazite reserves from its operations of 256,000 tonnes. India mined an estimated 2,900 tonnes. Neither country is a major supplier to Western magnet makers.
Reading the numbers without being fooled
Rankings like this are easy to misread. A few cautions that apply to every table on the page:
- Tonnes of REO are not tonnes of ore. REO is oxide equivalent. A deposit with 1% REO needs 100 tonnes of ore for one tonne of oxide.
- Not all tonnes are equal. A tonne of lanthanum and a tonne of dysprosium appear identically in a production total, yet their prices differ by orders of magnitude. A country's share of the total can say little about its share of the value.
- Revisions are common. Between 2025 and 2026, USGS cut the world reserve floor from 90 million to 75 million tonnes. A table printed two years ago will not match a table printed today.
- Estimates can be circular. Several 2024 and 2025 production figures (Burma, Madagascar, Nigeria, Thailand, Vietnam) are derived from Chinese import records. If China changes how it records imports, the apparent production of those countries changes with it.
- China's figures are partly quota-based. USGS has described China's production figure in earlier editions as a quota that does not include undocumented production, so the true number is likely higher.
For the same reasons, you should treat any single-number claim of the form "country X has Y% of rare earths" as incomplete until you know whether it refers to reserves, mining, refining, or magnets, and in which year.
Rare earths in the wider resource picture
Rare earths are one of several critical minerals whose supply is concentrated. The same logic applies to lithium and cobalt: a few countries mine, and a few countries refine. For a comparison with another battery-and-motor input, see Countries With the Most Lithium Reserves. For a broader look at how resource rankings are built and where they mislead, see Countries With the Most Natural Resources, and for the scale of the industry's physical footprint, see Biggest Mines in the World.
Substitution is the long-run counterweight. USGS says substitutes are available for many applications but are generally less effective. That sentence covers a lot: ferrite magnets are cheaper and weaker, and motor designs that avoid rare earths exist but give up power density or efficiency. Recycling is also small. USGS notes that only limited quantities of rare earths were recovered from batteries, permanent magnets, and fluorescent lamps in the United States.
Frequently Asked Questions
Q: Which country has the most rare earth reserves?
A: China, with an estimated 44 million tonnes of rare earth oxide equivalent according to the USGS Mineral Commodity Summaries 2026. Brazil is second at 11 million tonnes, followed by Australia at 6.3 million, Russia at 3.8 million, and Vietnam at 3.5 million. World reserves are listed only as more than 75 million tonnes.
Q: Which country produces the most rare earths?
A: China, at an estimated 270,000 tonnes of REO in 2025, about 69% of the world total of 390,000 tonnes. The United States was second at 51,000 tonnes, Australia third at 29,000 tonnes, and Burma fourth at 22,000 tonnes, per USGS.
Q: Are rare earth metals actually rare?
A: Not in the geological sense. USGS describes them as relatively abundant in Earth's crust, but notes minable concentrations are less common than for most other mineral commodities. The scarcity is economic: finding a deposit rich enough to mine, and then separating seventeen chemically similar elements from each other.
Q: What is the difference between light and heavy rare earths?
A: Light rare earths such as lanthanum, cerium, praseodymium, and neodymium are more abundant and cheaper. Heavy rare earths such as dysprosium and terbium are scarcer in most deposits and are added to magnets to keep them strong at high temperatures. In the USGS price tables, neodymium oxide sold for about 73 times the price of lanthanum oxide in 2025.
Q: Why does refining matter more than mining?
A: Rare earths come out of the ground as mixtures that must be chemically separated before use. The IEA reports China is the dominant refiner for 19 of the 20 energy-related minerals it tracks, averaging a market share of around 70%, and it names China as the source of most of the growth in rare earth refining since 2020. A country can mine a great deal and still depend on someone else to process the output.
Q: What export controls has China placed on rare earths recently?
A: According to USGS, China added controls on samarium, gadolinium, terbium, dysprosium, lutetium, scandium, and yttrium products in April 2025, expanded them to europium, holmium, erbium, thulium, and ytterbium in October 2025, then suspended the October measures for one year in November. The April controls remained in effect, with general licenses issued to selected exporters.
The takeaway
The most useful way to read a rare earth ranking is to ask which step of the chain it measures. China leads all three: reserves (44 million tonnes), mining (about 69% of 2025 output), and, according to the IEA, most of the growth in refining. The other countries in the top tables each solve only part of the problem. Brazil has the ground but little output. The United States and Australia have mines and growing but still partial processing. Vietnam looked like a giant until USGS revised its reserves down by about 85%.
For policymakers the lesson is not that China holds all the rocks. It is that the bottleneck sits in chemistry plants and magnet factories, which take years to build and depend on price stability that the market has not reliably supplied. Price floors, export licenses, and arbitration cases are all attempts to manage that gap. For readers, it means the numbers change, and an article that quotes a single reserve figure without a year and a source is probably out of date.
Sources
- U.S. Geological Survey, Mineral Commodity Summaries 2026: Rare Earths (February 2026)
- U.S. Geological Survey, Mineral Commodity Summaries 2025: Rare Earths (January 2025)
- International Energy Agency, Global Critical Minerals Outlook 2025, Executive Summary
- MP Materials, Public-private partnership with the Department of Defense (July 10, 2025)
Related Reading
Follow new articles
Add SciHub101 to your feed reader to see new science and technology stories.
About the Author
SciHub101 is an independent science and technology publication founded and edited by Buğra Sözeri, a software engineer and app developer based in Türkiye. AI tools assist with drafting and research. Source documentation in the existing archive is uneven, and articles are being reviewed and corrected. The Editorial Team byline identifies editorial responsibility; it does not certify specialist or independent human review. Where we compare products, anything built by our own team is labelled as such — see the editorial guidelines and About page for how corrections and disclosures work.
Related Articles
Countries With the Largest Stock Markets (2024-2025 Data)
The United States held $62.2 trillion of listed company value at the end of 2024, 54% of the world total in World Bank data. This ranking of the largest stock markets shows who follows, why one country dominates, and why some 2025 figures need care.
Countries With the Most Natural Gas Reserves, Ranked
Russia holds the largest proven natural gas reserves, followed by Iran and Qatar. But the sources behind the rankings disagree by a factor of two for some countries, and what a country can sell depends on pipelines and LNG terminals more than on geology. Here is the ranking, the caveats, and the export picture.
Countries With the Most Lithium Reserves (USGS 2026)
Chile holds the largest lithium reserves at 9.2 million tonnes, ahead of Australia, China, Argentina, and the United States. Reserves, resources, and production tell three different stories.

Countries with the Most Tourist Arrivals (Ranked)
France received more international tourists than any other country in 2024 — approximately 102 million arrivals, making it the first country in history to surpass the 100 million annual mark. Spain ranked second with 93.8 million, the United States third with 72.4 million. Turkey and Italy round out the top five. But raw arrival numbers obscure important distinctions: the United States earns more tourism revenue than any other country despite ranking third in arrivals. This ranking covers the top 20 countries by international tourist arrivals using UN Tourism (UNWTO) 2024 data, with methodology, historical context, and revenue analysis.

Bitcoin Mining Explained — How It Actually Works
How Bitcoin mining uses proof of work to order transactions and secure the network, with clear coverage of halvings, difficulty, hardware, energy estimates and profitability uncertainty.

Fastest Growing Economies in the World (2025)
Guyana's economy grew 43.8% in 2024 and an estimated 19.3% in 2025, but oil-driven jumps are not the whole story. Here is who grew fastest in 2025, why the list is full of small economies, and what the numbers do and do not mean.