Countries with the Most Natural Resources (2025 Ranked)
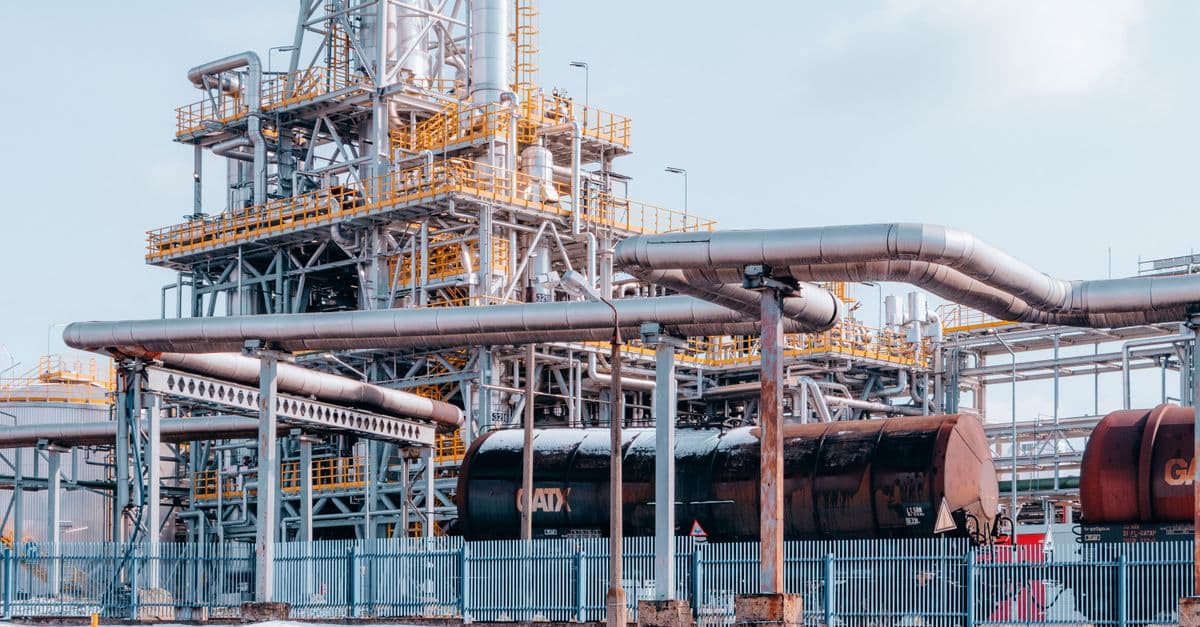
Photo: Jakub Pabis / Pexels
Natural resources — oil, natural gas, coal, metals, minerals, forests, freshwater, and agricultural land — are the physical foundation of economic wealth. The World Bank's Changing Wealth of Nations 2024 report values global natural capital at a significant share of total global wealth, though the precise figure varies by methodology and price assumptions. The most frequently cited estimate for Russia's natural resource endowment alone runs to approximately $75 trillion. But across a century of data, one pattern holds: countries with the most natural resources frequently fail to translate that wealth into broad-based development. Norway and Botswana are the two most studied exceptions. The rule is Venezuela, Nigeria, and the Democratic Republic of Congo.
What "natural resource wealth" means: methodology note
Natural capital — the economic value assigned to a country's stock of natural resources — is estimated using several methodologies:
Rent-based valuation (World Bank CWON methodology): Calculates the "rent" that would be earned from a resource stock — the market price minus the cost of extraction, summed over the estimated resource life. This is the basis for the World Bank's Changing Wealth of Nations report, which covers 151 countries.
Reserve valuation (USGS/commodity-price methodology): Multiplies proven or estimated reserve volumes by current commodity prices. The Visual Capitalist figures frequently cited in media ($75 trillion for Russia, $45 trillion for the US) use this approach.
Limitations: Both approaches assume current prices, which fluctuate dramatically (oil price ranges from $20 to $130/barrel in recent decades). Reserve estimates change with exploration, technology (shale unlocked US gas reserves; deepwater drilling unlocked Brazilian oil), and geopolitical access. The rankings in this article should be understood as order-of-magnitude estimates, not precise market valuations.
Source: World Bank — The Changing Wealth of Nations 2024; USGS Mineral Resources Program; Visual Capitalist resource valuation compilations.
Countries with the most total natural resource wealth
(Estimated total resource value, World Bank / USGS / Visual Capitalist 2023 estimates)
| Rank | Country | Total value ($trillion) | Key resources |
|---|---|---|---|
| 1 | Russia | 75 | Oil, gas, coal, timber, nickel, palladium, gold, diamonds |
| 2 | United States | 45 | Coal, oil, gas, agricultural land, copper, gold |
| 3 | Saudi Arabia | 34 | Petroleum (>90% of total resource value) |
| 4 | Canada | 33 | Oil sands, timber, freshwater, potash, gold, uranium |
| 5 | Iran | 27 | Oil and natural gas |
| 6 | China | 23 | Coal, rare earth elements, iron ore, copper |
| 7 | Brazil | 22 | Iron ore, oil, timber, agricultural land, freshwater |
| 8 | Australia | 20 | Iron ore, coal, LNG, gold, uranium, lithium |
| 9 | DRC | 24* | Cobalt, coltan, copper, diamonds, gold |
| 10 | Iraq | 16 | Oil |
| 11 | Venezuela | 14 | Oil (world's largest proven reserves by volume) |
| 12 | Kazakhstan | 12 | Oil, uranium, copper, chromium |
| 13 | UAE | 7 | Oil and gas |
| 14 | Norway | 5 | Oil, gas, fish, hydropower |
| 15 | India | 9 | Coal, iron ore, agricultural land |
*DRC ranking varies by source; its mineral reserves are estimated at $24 trillion but GDP per capita remains among the world's lowest, illustrating the resource curse most acutely.
Source: World Bank Changing Wealth of Nations 2024; Visual Capitalist — Ranked: Top 10 Countries by Value of All Their Natural Resources (2024); USGS Mineral Commodity Summaries.
Where This Data Comes From
This ranking aggregates estimates from three primary methodologies: the World Bank's Changing Wealth of Nations report, which uses rent-based valuation (market price minus extraction cost over resource life); the USGS Mineral Commodity Summaries, which reports proven and estimated reserve volumes; and Visual Capitalist compilations that multiply reserve estimates by current commodity prices. All three approaches are order-of-magnitude estimates, not precise valuations, because commodity prices fluctuate dramatically — oil has ranged from $20 to $130/barrel in recent decades — and reserve estimates change with exploration technology and geopolitical access.
Russia's $75 trillion and the US's $45 trillion are frequently cited but should be understood as baseline estimates that assume current price levels and reserve accessibility. If oil prices fall to $50/barrel from $90/barrel, valuations shrink proportionally. If new deposits are discovered or extraction technology improves, rankings shift. The rankings also reflect a snapshot of 2023–2024 valuations and do not account for environmental externality costs (carbon emissions, water pollution, habitat destruction) that should logically reduce the true economic value of fossil fuel reserves in a climate-constrained world.
Historical context: from subsistence to industrial extraction
For most of human history, natural resources were used locally and at human scale — forests for timber and fuel, rivers for water and fish, land for crops. The industrial revolution transformed the relationship between nations and their resource endowments.
Coal and the industrial age (1760–1920). Britain's coal deposits enabled the industrial revolution; the presence or absence of accessible coal largely determined which regions industrialised first. The Ruhr Valley (Germany), Pennsylvania (US), and Silesia (Poland) became industrial heartlands because coal was there. Nations without coal — France's relative coal scarcity, Japan's complete dependence on imports — shaped their industrialisation trajectories.
Oil and the 20th century (1850–present). The discovery of oil in Pennsylvania in 1859 launched what would become the defining commodity of industrial modernity. The US dominated global oil production through the 1950s; Middle Eastern discoveries in the 1930s–1950s shifted geopolitical gravity. The 1973 OPEC oil embargo and 1979 oil shock demonstrated that resource control could be weaponised as geopolitical leverage — a lesson Russia applied in Europe in 2022.
The minerals turn (2000–present). The energy transition and digital economy have shifted which resources matter most. Oil remains central, but lithium, cobalt, copper, nickel, and rare earth elements now command strategic attention disproportionate to their absolute market value. The DRC's cobalt, Chile and Australia's lithium, and China's rare earth processing capacity have become 21st-century strategic assets in the same way Persian Gulf oil was for the 20th century.
Source: Vaclav Smil, Energy and Civilization: A History (MIT Press, 2017); Daniel Yergin, The Prize: The Epic Quest for Oil, Money and Power (1991).
Russia: the resource superpower
Russia's estimated $75 trillion in natural resource wealth encompasses an extraordinary range of commodities and represents the largest single-country natural resource endowment on earth — approximately equal to one year's global GDP.
Fossil fuels. Russia holds the world's largest proven natural gas reserves (approximately 38 trillion cubic metres — roughly 20% of global proven reserves) and ranks among the top-10 oil producers. Before 2022 sanctions, Russia supplied approximately 40% of Europe's natural gas and 12% of global oil exports.
Forests. Russia's boreal taiga forest covers approximately 815 million hectares — the world's largest contiguous forest system and a carbon sink of global climatic significance. Russian forests hold approximately 25% of the world's forest carbon stock. Much of the Russian boreal forest sits in permafrost zones too remote for commercial exploitation; the accessible fringe in western Siberia and the Far East is logged for export to China and Japan.
Strategic metals. Russia controls approximately 40% of global palladium supply (essential for automotive catalytic converters and electronics), is the world's second-largest platinum producer, and produces significant quantities of nickel (critical for EV batteries), aluminium, gold, and titanium. Alrosa, the Russian state diamond company, historically produced approximately 30% of the world's rough diamonds by volume.
The sanctions constraint. Post-2022 Western sanctions forced Russia to redirect resource exports from European buyers (who had built decades of infrastructure around Russian gas) to Asian markets, primarily China and India. This redirection involved significant discounts (Russian Urals crude sold at $15–30/barrel below Brent at peak discount in 2022–2023), logistical costs (new pipeline infrastructure, longer tanker routes), and loss of the European premium market for gas. The sanctions have not severed Russia's ability to sell resources, but they have reduced the economic benefit per unit sold.
Source: BP Statistical Review of World Energy 2023; USGS Mineral Commodity Summaries 2024; World Bank Russia country data.
The United States: diverse and underappreciated
The US at $45 trillion is typically ranked second globally — yet US citizens rarely frame their country as a "resource nation," partly because resource rents constitute a relatively small share of US GDP (under 1%), and partly because manufacturing and services have dominated the economic narrative since deindustrialisation.
Coal. The US holds the world's largest coal reserves by some estimates — approximately 250 billion tonnes of recoverable reserves. US coal is primarily bituminous and sub-bituminous; it powered US electricity generation for most of the 20th century. Domestic coal use has fallen sharply since 2007 as natural gas and renewables compete; coal now accounts for under 20% of US electricity generation. Export demand from Asia partially offset domestic decline through the 2010s.
Natural gas and the shale revolution. Hydraulic fracturing (fracking) technology, developed commercially in the 2000s, unlocked massive US shale gas deposits that were previously uneconomic. The US went from a projected major LNG importer in 2005 to the world's largest LNG exporter by 2023. This transformed global gas markets and is the primary reason US gas prices are structurally lower than European or Asian prices.
Agricultural land. The US Great Plains — the Corn Belt, Wheat Belt, and surrounding agricultural regions — represent some of the world's most productive agricultural land by yield per hectare. US agricultural exports (corn, soybeans, wheat) make the US the world's leading food exporter and a food security backstop for many nations. This agricultural capital is not always included in natural resource rankings but represents enormous strategic and economic value.
Copper, gold, and critical minerals. Arizona, Nevada, and Montana hold significant copper deposits; Nevada's Carlin Trend is one of the world's largest gold districts; the Appalachians yield coal; offshore Gulf of Mexico and Alaska hold oil and gas. The US also holds lithium deposits in Nevada and North Carolina that are becoming increasingly strategic for domestic battery supply chains.
Source: US Energy Information Administration (EIA); USGS Mineral Commodity Summaries 2024; USDA Economic Research Service.
Saudi Arabia: one commodity, extraordinary concentration
Saudi Arabia's $34 trillion resource valuation derives almost entirely from petroleum. The Ghawar field — discovered in 1948, roughly 280 km long — is the world's largest conventional oil field and has produced approximately 65–70 billion barrels since discovery, with significant reserves remaining. Saudi Arabia holds approximately 17% of proven global oil reserves.
The Saudi economy is extraordinarily concentrated in petroleum: oil revenues have historically constituted 70–90% of government revenue and 40–50% of GDP. This concentration — deliberately managed through OPEC production quotas — has given Saudi Arabia enormous influence over global oil prices but has also made the country acutely vulnerable to the long-term energy transition.
Vision 2030 is Saudi Arabia's stated response: a programme announced in 2016 to diversify the economy toward tourism, entertainment, technology, and manufacturing before petroleum revenues decline. Progress has been real but mixed — non-oil revenue has grown, Riyadh has hosted major sporting and entertainment events previously unthinkable in the kingdom's social context, and NEOM (the planned $500 billion megacity project) has attracted global attention. The fundamental challenge — building a competitive, diversified private sector that employs Saudi nationals — remains formidable.
Source: Saudi Aramco Annual Reports; IMF Saudi Arabia Article IV consultations; Vision 2030 progress reports.
The DRC: the world's richest poor country
The Democratic Republic of Congo presents the most extreme resource curse case in recorded history. Its estimated $24 trillion in mineral reserves — primarily cobalt, coltan, copper, gold, and diamonds — sits beneath one of the world's poorest and most conflict-affected populations.
Cobalt. The DRC produces approximately 70% of the world's cobalt — the material that is currently essential for lithium-ion battery cathodes in electric vehicles and consumer electronics. Every smartphone manufactured today contains cobalt that has a meaningful probability of having come from the DRC. The EV transition has significantly increased cobalt demand and prices, raising the economic stakes of DRC's mining regions.
Coltan. Columbite-tantalite (coltan) is processed into tantalum, used in capacitors for mobile phones, laptops, and other electronics. The DRC holds the world's largest coltan deposits. During the early 2000s, coltan demand from consumer electronics manufacturers — particularly surging demand from the PlayStation 2 launch — was directly linked to escalation of conflict in eastern DRC, as armed groups captured and taxed mining operations.
The historical extraction problem. The DRC's resource curse has roots in one of history's most brutal colonial regimes. King Leopold II of Belgium's personal rule of the Congo Free State (1885–1908) was characterised by forced labour, mutilation, and mass killing to extract rubber and ivory. The Belgian colonial state that succeeded it (1908–1960) maintained extractive infrastructure without investing in human capital or governance. Independence in 1960 was followed by CIA-backed assassination of elected Prime Minister Patrice Lumumba, installation of Mobutu Sese Seko, and 32 years of kleptocratic rule that systematically dismantled state institutions while western companies extracted minerals.
The resulting institutional vacuum — weak property rights, pervasive corruption, predatory governance — has made it structurally impossible for mineral revenues to translate into public goods. The cobalt mining regions of Lualaba and South Kivu employ artisanal miners, including children, in dangerous hand-dig operations. Mining communities remain desperately poor while multinationals extract billions.
Source: UN Panel of Experts on the DRC; World Bank DRC Country Data; Natural Resource Governance Institute — DRC Resource Governance Index.
The resource curse: why abundance fails
The resource curse (also known as the "paradox of plenty") is the documented empirical finding that countries with large natural resource endowments tend to experience lower economic growth, worse governance, higher corruption, and more civil conflict than comparable resource-poor countries. The term was coined by economist Richard Auty in 1993 and has since accumulated a substantial empirical literature.
Lower economic growth. Oil-dependent economies have historically grown slower than comparable non-oil economies over 30-year periods. The mechanism: resource revenues allow governments to fund spending and patronage without taxing citizens or building a productive private sector. When commodity prices fall — and they always fall eventually — there is no diversified economy to absorb the shock. Nigeria's GDP collapsed by 5.9% in the year crude oil prices fell sharply; Venezuela's economy contracted by over 70% in real terms between 2013 and 2021.
Dutch Disease. When resource exports are large, they generate foreign exchange inflows that appreciate the domestic currency. An appreciated currency makes all other exports — manufactured goods, agricultural products, services — more expensive in world markets and therefore less competitive. Manufacturing and agriculture, which build broad-based employment and human capital, are structurally crowded out. Nigeria's oil wealth progressively destroyed its competitive agricultural sector over 50 years; palm oil, groundnuts, and cocoa that once generated significant export revenue were replaced by oil rents that employed relatively few people.
The taxation-accountability link. In non-resource states, governments must tax citizens and businesses to fund public services. This creates a contractual relationship: citizens who pay taxes expect public goods in return, and have an incentive to monitor and discipline government if those goods are not delivered. Resource revenues break this link: a government that funds itself from oil rents does not need to tax citizens, and citizens have less leverage to demand accountability. Political scientists call this the "oil-for-loyalty" model — rents are distributed to buy political quiescence rather than invested in productive governance.
Conflict and armed groups. High-value, easily captured resources — alluvial diamonds, artisanal gold and cobalt, portable oil infrastructure — provide the economic motivation and means for armed groups and warlords. Sierra Leone's diamond-funded RUF, Angola's UNITA, the DRC's dozens of armed militias, and Nigeria's Niger Delta insurgency are all resource conflicts. The academic literature finds that the probability of civil conflict in resource-rich countries is substantially higher than in resource-poor countries, controlling for other factors.
Source: Richard Auty, Sustaining Development in Mineral Economies: The Resource Curse Thesis (1993); Jeffrey Sachs and Andrew Warner, "Natural Resource Abundance and Economic Growth" (NBER 1995); Macartan Humphreys, Jeffrey Sachs, and Joseph Stiglitz, Escaping the Resource Curse (Columbia University Press, 2007).
Norway: how to beat the curse
Norway is the canonical success case for resource wealth management. North Sea oil was discovered in 1969; Norway now exports approximately 2 million barrels per day and has accumulated the world's largest sovereign wealth fund. Yet Norway has avoided deindustrialisation, maintained strong public institutions, and preserved high-quality public services — the opposite of the resource curse pattern.
The Government Pension Fund Global (GPFG). Norway deposits oil revenues into its sovereign wealth fund — currently worth approximately $1.7 trillion (as of 2024), the world's largest SWF by assets. The fund invests exclusively abroad (to avoid flooding the domestic economy with petrodollars and causing Dutch Disease) across equities, bonds, and real estate in 70+ countries. Only the "real return" — estimated at 3% of fund value annually — is available for government spending; the principal is preserved for future generations.
The fiscal rule. Norway's "4% rule" (reduced to 3% in 2017 as expected returns fell) caps annual government withdrawals from the GPFG at 3% of fund value. This prevents commodity price booms from translating directly into government spending booms — the classic mechanism of resource-curse fiscal volatility.
Pre-existing institutions. Norway had strong democratic institutions, rule of law, low corruption, and professional bureaucracy before oil was discovered. The resource curse is most severe in countries that discover resources before developing capable institutions to manage them; Norway already had the institutional infrastructure to absorb oil revenues without corruption or capture.
Botswana as an African parallel. Botswana managed diamond revenues — through a 50/50 partnership with De Beers (Debswana), giving government a direct equity stake rather than just royalties — to fund education, healthcare, and infrastructure. From 1966–2000, Botswana was the world's fastest-growing economy. Diamond revenue financed universal secondary education; a professional civil service was built and maintained; property rights were upheld. The contrast with Sierra Leone — which had comparable diamond resources and chose differently — is stark.
Source: Norwegian Ministry of Finance — GPFG annual reports; World Bank Botswana Diamond Revenue Management case study; IMF Working Paper on resource fund governance.
The energy transition: new winners, new risks
The global transition away from fossil fuels is reshaping which natural resources carry strategic value. Oil and gas, while still dominant, face a long-term demand decline from electrification. The transition amplifies demand for a different set of minerals.
Lithium. Electric vehicle batteries require approximately 8–10 kg of lithium carbonate equivalent per vehicle. Global EV production is projected to reach 40–50 million vehicles per year by 2030, implying lithium demand growth of 4–5x from 2022 levels. The "lithium triangle" — Bolivia, Chile, and Argentina — holds approximately 58% of global lithium reserves; Australia mines the largest volumes. Bolivia has the world's largest reserves but has struggled to attract investment due to nationalisation policies.
Cobalt. DRC's cobalt position (70% of global production) has made it a strategic chokepoint for the battery supply chain. The battery industry is actively working to reduce cobalt content per battery (through NMC811 cathode chemistry and lithium iron phosphate alternatives); cobalt-free batteries may become standard in lower-range EVs. This would reduce, though not eliminate, DRC's strategic leverage.
Copper. Every electric vehicle uses approximately 83 kg of copper — four times more than a conventional vehicle. Renewable energy infrastructure (wind turbines, solar panels, transmission lines) is also copper-intensive. Copper demand is projected to roughly double by 2035. Chile and Peru hold 40% of global copper reserves; the US, Australia, and DRC are also major producers. Copper mine development timelines run 10–15 years from discovery to production, creating a projected supply gap in the late 2020s.
Rare Earth Elements (REEs). The 17 rare earth metals — including neodymium, dysprosium, and praseodymium — are essential for permanent magnets in electric motors and wind turbines. China controls approximately 60% of global REE mining and approximately 85% of global REE processing. This concentration gives China strategic leverage over the energy transition supply chain; the US, Australia, Canada, and the EU are actively developing non-Chinese REE supply chains, but processing capacity is a multi-year build.
Source: IEA — The Role of Critical Minerals in Clean Energy Transitions (2021, updated 2024); USGS Mineral Commodity Summaries 2024; BloombergNEF battery raw materials tracking.
Frequently asked questions
Q: What are rare earth minerals and why do they matter? A: Rare earth elements (REEs) are a group of 17 metals including neodymium, dysprosium, and cerium. Despite the name, most are not geologically scarce — they are dispersed rather than concentrated, making mining and processing expensive and environmentally demanding. They are essential for electric motors, wind turbines, smartphones, missile guidance systems, and advanced electronics. China's dominance of REE processing (approximately 85% of global capacity) has created a strategic dependency that the US, EU, and Australia are actively trying to reduce by building domestic processing infrastructure.
Q: Is water the next oil? A: Freshwater scarcity is a growing strategic concern, but its dynamics differ from oil. Unlike oil, water cannot easily be transported globally — scarcity is local and regional, not a global market. Countries with abundant freshwater (Canada, Brazil, Russia, Norway) hold assets of increasing value as climate change reduces glacial meltwater and alters precipitation patterns. The Nile basin dispute — Egypt, Sudan, and Ethiopia in conflict over Ethiopia's Grand Ethiopian Renaissance Dam — is among the most prominent examples of water as a strategic resource. By 2050, the UN projects that over 5 billion people will face water scarcity for at least one month per year.
Q: What happens when resources run out? A: Countries dependent on finite resources face structural adjustment when production peaks and declines. Saudi Arabia's Vision 2030 is explicitly a pre-emptive diversification strategy. Norway's wealth fund is designed for a post-oil future. Countries that fail to diversify before depletion face severe economic contraction. Algeria, whose oil and gas revenues fund 60% of government spending, and Nigeria, which has been "preparing" for post-oil futures for 50 years without effective action, are cautionary cases. The energy transition may impose this timeline more aggressively than simple depletion — oil demand may peak before reserves are exhausted.
Q: Why does Venezuela have the world's largest oil reserves but a collapsed economy? A: Venezuela's Orinoco Belt holds approximately 300 billion barrels of proven reserves — the world's largest by volume — but much of this is extra-heavy crude that is expensive to upgrade and produce. More fundamentally, Venezuela's oil wealth was managed through a combination of populist redistribution (subsidising domestic fuel prices, cash transfers under Chávez), state company mismanagement (PDVSA became a patronage vehicle rather than an oil company), corruption, and the imposition of economic policies (price controls, nationalisations) that destroyed private sector capacity. When oil prices fell in 2014, there was no alternative economic sector to absorb the shock. The result was a collapse of over 70% of real GDP, hyperinflation, and the emigration of over 7 million Venezuelans.
Q: How is the DRC's cobalt connected to smartphones? A: Approximately 70% of global cobalt production comes from the DRC. Cobalt is a key component of the lithium-cobalt oxide (LCO) cathode chemistry used in most consumer electronics batteries — iPhones, Android phones, laptops. An estimated 40,000–100,000 artisanal miners in the DRC's Lualaba province, including children, mine cobalt by hand in dangerous conditions. Major technology companies have published supply chain audits and support programs (Apple, Google, Tesla), but artisanal production is structurally difficult to certify. Responsible sourcing remains an active and unresolved challenge.
Q: How does Denmark's lack of oil affect its economy compared to oil-rich neighbors?
A: Denmark has no significant oil reserves and historically imported petroleum, yet has outperformed most resource-rich countries on per-capita wealth, quality of life, and governance. Denmark's forced economic diversification into exports (Lego, wind turbines, shipbuilding, pharmaceuticals), strong institutions built before any oil wealth materialized, and consistent government reinvestment in education and infrastructure insulated it from resource curse dynamics. The contrast with nearby Norway, which was poor and oil-free until 1969, illustrates that the path to prosperity is institutional strength and diversity, not resource abundance.
The takeaway
Natural resource wealth is a governance test, not a gift. Norway passed by building institutions first, then systematically sequestering resource revenues from the domestic economy. The DRC, Venezuela, and Nigeria failed — in each case, the failure was not geological but political: the inability to build institutions strong enough to resist the incentive for elite capture. The energy transition is running a new iteration of this test, with lithium, cobalt, copper, and rare earths replacing oil and gas as the high-stakes commodities. The countries sitting on those deposits face the same choice that oil producers faced in the 20th century — and the historical base rate for passing that test is not encouraging.
Sources
- World Bank — The Changing Wealth of Nations 2024
- USGS Mineral Commodity Summaries 2024
- IEA — The Role of Critical Minerals in Clean Energy Transitions
- BP Statistical Review of World Energy 2023
- Natural Resource Governance Institute — Resource Governance Index
- Norwegian Ministry of Finance — GPFG Annual Report
Related Reading
Follow new articles
Add SciHub101 to your feed reader to see new science and technology stories.
About the Author
SciHub101 is an independent science and technology publication founded and edited by Buğra Sözeri, a software engineer and app developer based in Türkiye. AI tools assist with drafting and research. Source documentation in the existing archive is uneven, and articles are being reviewed and corrected. The Editorial Team byline identifies editorial responsibility; it does not certify specialist or independent human review. Where we compare products, anything built by our own team is labelled as such — see the editorial guidelines and About page for how corrections and disclosures work.
Related Articles

Countries with the Highest Murder Rates (2025 Ranked)
Honduras has a murder rate of 35 per 100,000 — among the world's highest. But Jamaica, South Africa, and Venezuela top many lists. El Salvador's dramatic drop shows murder rates can change fast with policy. Here's the complete global homicide ranking and what actually drives lethal violence.

Countries with the Most Tourists Per Capita (2025 Ranked)
San Marino receives 6 million tourists annually for a population of 34,000 — 176 tourists per resident. Iceland, Andorra, and the Maldives receive 3–8x their own population in tourists each year. Over-tourism is straining small destinations. Here's the complete tourists-per-capita ranking and the double-edged sword of being the world's most-visited small nation.
Countries with the Most Coffee Production (2025 Ranked)
Brazil produces nearly 40% of the world's coffee — more than the next three countries combined. Vietnam is the world's top Robusta producer. Ethiopia is coffee's birthplace. Global coffee production is worth $50 billion at origin but $460 billion at retail — the biggest markup in agriculture. Here's the full coffee production ranking.

Countries with the Most Chess Players (2025 Ranked)
Russia has produced more World Chess Champions than any country — 16 of 17 champions from 1927 to 2007 were Soviet or Russian. India is now the world's fastest-growing chess nation with 80+ active grandmasters. Magnus Carlsen of Norway held the world title for 10 years. Here are the countries dominating chess.

Countries with the Most Billionaires Per Capita (2025 Ranked)
Monaco has more billionaires per capita than any country — 1 per 1,000 residents. Switzerland ranks second among large nations. The US has more billionaires in total (735+) but smaller nations lead per capita. Here's the full ranking of where the world's ultra-wealthy concentrate.

Countries with the Most Cat Owners (2025 Ranked)
The United States has roughly 62 million pet cats — the most of any country. Russia has the highest cat ownership rate per capita at 59% of households. Japan's cat culture is a global phenomenon. There are an estimated 600 million domestic cats worldwide. Here's the full ranking of cat ownership by country.